CONTRIBUTION OF AGROFORESTRY SYSTEM IN MAINTAINING CARBON STOCKS
AND REDUCING EMISSION RATE AT JANGKOK WATERSHED,
LOMBOK ISLAND
Markum1*), Endang Ariesoesiloningsih2), Didik Suprayogo3), and Kurniatun Hairiah3) 1)Faculty of Agriculture University of Mataram Jl. Majapahit 62 Mataram Indonesia 2)Faculty of Sciences University of Brawijaya Jl. Veteran Malang 65145 East Java Indonesia 3) Faculty of Agriculture University of Brawijaya Jl. Veteran Malang 65145 East Java Indonesia
*) Corresponding author Phone:+62-370-621435 E-mail: [email protected]
Received: January 5, 2013/ Accepted: May 12, 2013
ABSTRACT
Agroforestry systems under rules of community-based forest management support local livelihoods in the Jangkok watershed, Lombok Island. One of the conditions from the forest authoritiesfor allowing agroforestry system is that it should maintain forest conditions. Since 1995 the Jangkok watershed has undergone rapid land use change, especially in the forest area. These changes led to a reduction of carbon stocks and thus to emission of CO2. This research aimed to: (1) Measure the carbon stocks in several land use system within the Jangkok watershed, (2) Assess the contribution of agroforestry systems in maintaining carbon stocks and reducing emissions. The assesment was performed based on the RaCSA (Rapid Carbon Stock Appraisal) method using three phases: (1) Classify land use change applying TM5 Landsat Satellite images for the period 1995-2009, (2) Measure carbon stock in the main land uses identified, (3) Quantify the contribution of agroforestry practices. Results showed that (1) The total
Keywords: agroforestry, carbon stocks, carbon emission rate
INTRODUCTION
The Jangkok watershed on Lombok Island has been experiencing rapid change and associated conflicts, resulting from two prominent factors: (1) Jangkok watershedis densely populated and close to Mataram city, with land conversion to dwellings, peri-urban farming, and infrastructure development; (2) 60% of Jangkok watershed is classified as forest area (19.088 ha) with high biodiversity and providing water to 3 regencies (Tjakrawarsa et al., 2008).Interpretation of satellite (Landsat) images for the 2000 – 2006 period showed that the closed natural forest on the slopes of the Rinjani volcano, Lombok Island, lost 3.2 % every year (Tjakrawarsa et al., 2008). Such decrease is due to the way local and national policies on forest management are implemented in the local context, with a lack of enforcement capacity.
Deforestration and forest degradation leads to a decrease of land-based carbon stock, and thus to carbon emission (Hairiah et al., 2006; Mutuo et al., 2005; Silver et al., 2004; van Noordwijk et al., 2002; Woomer et al., 2000;). Countering this trend and establishing tree-based farming systems (agroforestry) can lead to carbon sequestration in the long term (Van Noordwijk et al., 2008; Wang et al., 2010).
Carbon stocks vary according to land use, and are related to tree density and its diversity , soil type and management of land and landscape (Hairiah et al., 2008; Woodbury et al., 2006), therefore carbon stocks can be used as an indicator of forest quality. In general, the carbon stock (five pools: trees, understory vegetation, litter, roots and Corg in top 30 cm) in tropical ranges from 350 – 500 Mgha-1 (Mutuo et al., 2005). Conversion of natural forest into Accredited SK No.: 81/DIKTI/Kep/2011
agroforestry system may reduce carbon stocks use changeis primarily related to the tree density and the loss of large-diameter trees, due to forest fire or harvest (Hairiah et al., 2011; Markum, 2000), while the loss of soil carbon stock is relatively smaller and slower. In reverse, enhancement of tree density in open lands will increase carbon sequestration (Corbera et al., 2010). The ratio between total emission and local farmerss under agroforestry system in accordance with community-based forest management rules, aimed at increasing local income along side environmental conservation (Khususiyah et al., 2010). Agroforestry systemsare here dominated by Multi-Purpose Tree Systems (MPTs) that can stock 44 Mgha-1 averaged over a period of 10-40 years; this is 44 % lower than the carbon stock in secondary forest, measured to be 114 Mgha-1 (Rahayu, 2010). However, estimation of carbon emission rate at the Jangkok watershedas a whole still requiresfurther analysis.
The objective of this research was to evaluate the role of agroforestry systems as land use in reducing the net carbon emission rate from the Jangkok watershed area.
MATERIALS AND METHODS
The research was conducted at the Jangkok watershed, Lombok Island from 2010-2011. The research took place in the forest area of Sesaot with geographical position of 116o20’- 116o31’E and 8o43’ - 8o49’S, covering 3 villages in Sesaot, Ranget and Buwun Sejati. Estimation of carbon stock and emission rate was carried
relevant land use types; (3) calculating emission rates and sequestration by combining data of land use change and time-averaged carbon stock.
Estimation of Land Use Change
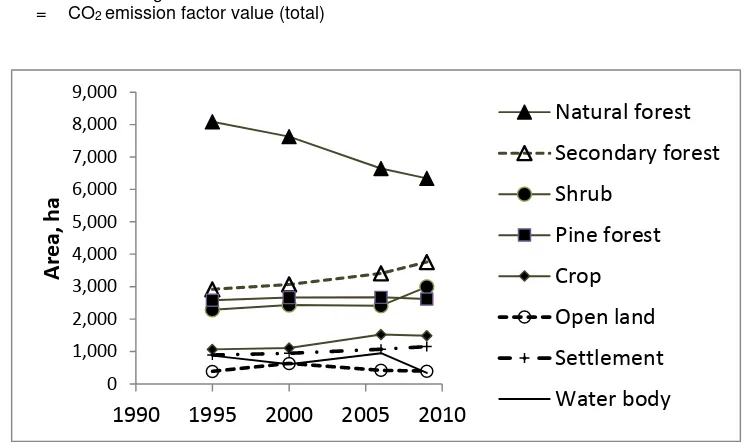
TM5 Landsat Satellite images of path row 116/66 date of 26th May 1995, 2nd July 2000, 13th May 2000 and 24th March 2009 were subjected to supervised classification by grouping training areas based on the similarity of spectral values and by visual checks on the image to obtain 8 categories of land cover/land use: (1) natural forest, (2) secondary forestwhich includes some agroforestry systems, (3) pine plantation forest, (4) shrub which includes other agroforestry systems, (5) crop, (6) open land, (7) dwelling and (8) water body.Estimation of coverage area and agroforestry class based on tree density was determined by ground check, plot level measurement and through focus group discussion inviting fiveteen local farmers.
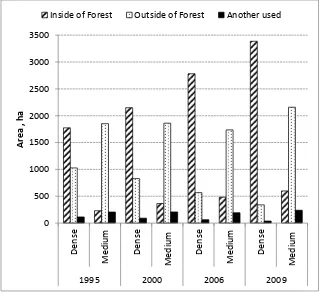
Based on analysis results through Landsat image, agroforestry (as part of the secondary forest) was further divided into two classes: dense and medium tree density. It is categorized as dense when ground truthing indicated on average 144 trees ofdiameter (DBH) > 30 cm and 844 trees of DBHranging from 5 to 30 cm , respectively; for the medium class 42 trees and 742 trees were found for the two diameter categories.
Carbon Stock Measurement
Carbon Sequestration Calculation
Estimation of net emission rate referred to the land use change and time-averaged C stock data for every land use which had been measured in advance.
Analysis on contribution of carbon stock of agroforestry system to carbon stock was calculated by comparing the amount of carbon in agroforestry system with carbon stock throughout the watershed as follow:
KC(agrf)=C(DAS)C(agrf)x 100%
Where:
KC(agrf) = Contribution of agroforestry C stock C(agrf) = C stock in agroforestry
C(DAS) = C stock throughout watershed
Analysis on the contribution of agro-forestry in reducing the emission rate was calculated by comparing the difference of CO2 emission factor value which is assumed without agroforestry sequestration, with the following total of CO2 emission factor value: time-averaged C stock is used FE(2) = CO2 emission factor value (total) 25%, 28% and 35%, respectively.
The areas for crop planting had been fluctuating due to the shift from rice fields to dwelling areas. Meanwhile, the area of open landincreased by 60% before 2000, especially due to logging in the mahoganys. However, by 2005, vegetation had come back to these areas. Agroforestry Areas at Jangkok Watershed
In 2009, the area of agroforestry at Jangkok watershed comprised 32% of total area (19088 ha), where around 20% of the total areaat Jangkok watershed was in the dense class of agroforestry. About 61% of the area was inside the watershed area, while the rest was outside of the watershed area. Meanwhile, the dense class comprised 12% of the toal area,with 19% inside and 81% outside of the forest area. Dense agroforestry inside the forest area kept increasing, while the medium class kept increasing outside the forest area (Figure 2).
Figure 2. Class of agroforestry based oninterpretation of 5-TM Landsat Satellite
Estimation of Carbon Stock
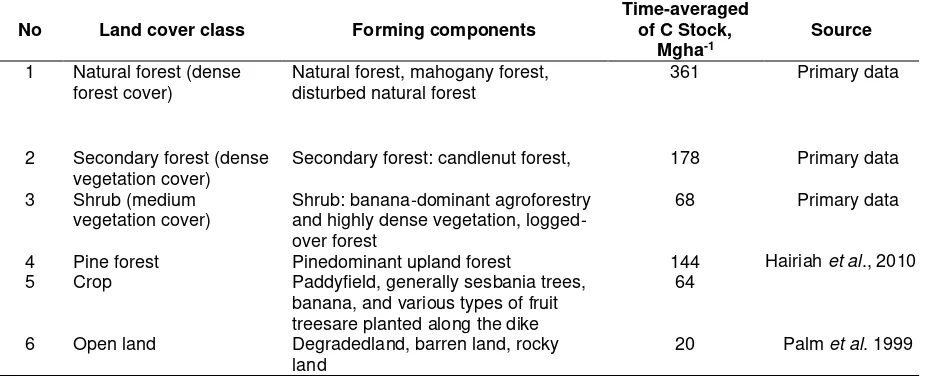
In interpreting the TM5 Landsat images for Jangkok watershed a number of land use classes had to be combined as no spectral distinction was feasible. Adjustments were needed to match available data on time-averaged carbon stock from previous research (Table 3).
The implication of the decrease of natural forest area within 14 years contributed a direct impact to the degradation of carbon stock at Jangkok watershed. In 1995, it was recorded that
the total of carbon stock at Jangkok watershed reached 4.05 Mton, subsequently decrease to 3.94 Mton, 3.67 and 3.65 in 2000, 2005 and 2009, respectively. The overall loss of carbon stock was 28 576 Mgyr-1 within 14 years.
Natural forest, despite its decreasing area stillhad the largest carbon stock compared to the other land uses, while carbon stock in the secondary forest remains increasing. Consequently, Jangkok watershed had decreased in carbon stock by as much as 400 Mg within 14 years (Figure 3). 0
500 1000 1500 2000 2500 3000 3500
De
n
se
Me
d
iu
m
De
n
se
Me
d
iu
m
De
n
se
Me
d
iu
m
De
n
se
Me
d
iu
m
1995 2000 2006 2009
A
re
a , h
a
Table 3. Classification of land use and time- averaged carbon stock
No Land cover class Forming components
Time-averaged of C Stock,
Mgha-1
Source
1 Natural forest (dense forest cover)
Natural forest, mahogany forest, disturbed natural forest
361 Primary data
2 Secondary forest (dense vegetation cover)
Secondary forest: candlenut forest, 178 Primary data
3 Shrub (medium vegetation cover)
Shrub: banana-dominant agroforestry and highly dense vegetation, logged-over forest
68 Primary data
4 Pine forest Pinedominant upland forest 144 Hairiah et al., 2010 5 Crop Paddyfield, generally sesbania trees,
banana, and various types of fruit treesare planted along the dike
64
6 Open land Degradedland, barren land, rocky land
20 Palm et al. 1999
Figure 3. Carbon stock of various type land use systems in Jangkok watershed
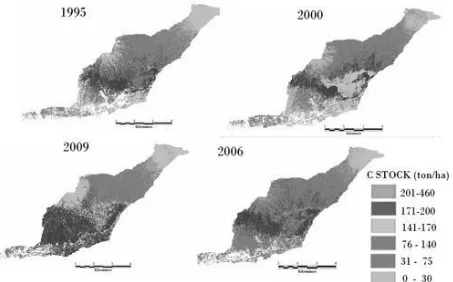
Change of Carbon Stock at Jangkok Watershed The loss of carbon stock from 1995 to 2000 and 2000 to 2005 as a resultof degradation of natural forest into secondary forest and the existence of open land (deforestration). In 2006-2009, however, the loss of carbon stock in secondary forest
camefrom either shrub cover or open land was recovered due to the implementation of Agroforestry initiated in 1995. The distribution of carbon stock at Jangkok watershed is presented in Figure 4.
0 500,000 1,000,000 1,500,000 2,000,000 2,500,000 3,000,000
Car
bo
n
s
toc
k
,
Mg
Table 4. Time-averaged carbon stock and carbon stock change from 1995-2009 in Jangkok watershed
No Land cover
Time-averaged
C-stock,
Difference in C total, Mg
Mgha-1 1995-2000 2000-2005 2006-2009 1995-2009
1 Natural forest 361 -165,702 -356,166 -109,326 -631,195
2 Pine forest 144 11,952 576 -7,057 5,471
3 Secondary forest/dense
agroforestry 178 27,540 60,411 62,588 150,539
4 Shrub/medium
agroforestry 68 9,849 -1,544 39,707 48,012
5 Crop 64 2,904 26,320 -2,352 26,872
6 Open land 30 7,320 -6,312 -778 230
Total -106,137
-276,715 -17,218 -400,071
Remarks: (-) means reduction of C-stock
Figure 4. Land use and carbon stock changes at Jangkok watershed based on TM5 Landsat Carbon Contribution from Agroforestry System
Agroforestry practice through community-based forest scheme (PHBM) was officially initiated in 1995 in Sesaot forest area. However, beyond its scheme, such a practice was carried
forest plants and MPTs. Secondary forests representing agroforestry system with complex multistrata character was categorized in dense class, and shrub representing simple Agroforestry system was categorized in medium class. Based on the categorization and results of FGD, it was estimated that 90 %of secondary forest and shrub were agroforestry system, and 10% were for another used (based onTM5 Landsat Image, 2011).
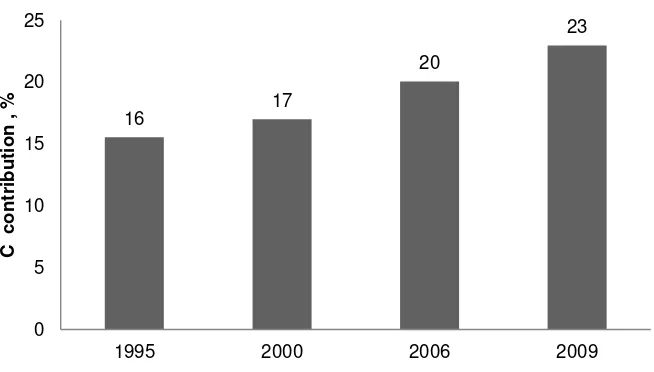
Referring to the average values of carbon stock in complex Agroforestry (177.7 Mgha-1) and simple Agro-forestry (67.8 Mgha-1) (Table 3), it was concluded that agroforestry secured a carbon stock at Jangkok watershed of as much as 0.639, 0.680 , 0.745 and 0.848 Gg in 1995, 2000, 2006 and 2009, respectively. The amount of Agro-forestry carbon tended to go up and contributed around 16% in 1995 and 23% in 2009 (Figure 5). Emission Rate and Carbon Sequestration
Emission rate and sequestration repre-sented the increase or decrease of CO2 either released or absorbed by plants due to the land use change. The land use change at Jangkok watershed occurred dynamically where land use
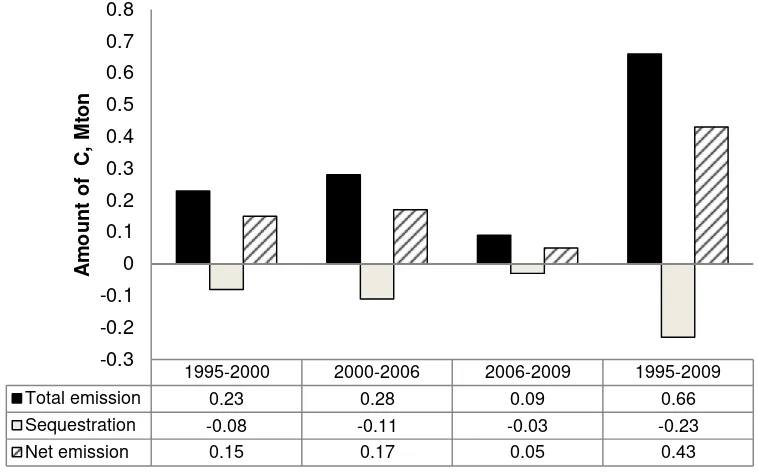
change had influence on one another. For instance, areas of agroforestry land covers increased in size due to the decrease of natural forest and result of agroforestry practiced in open land areas. Based on the results of analysis on land use change and data of time-averaged carbon stock (Table 4), were used to calculate of emission values and sequestration from 1995-2009 (Figure 6).
Figure 6 indicates that total emission of carbon was greater than the sequestration values, where it could be concluded that within 14 years, Jangkok watershed had been emitting carbon on average of 1.6 Mgha-1yr-1, or as much as the emission of CO2 (5.6 Mgha-1yr-1). However, the emission rate of carbon had tended to decrease since 2006, and this situation was affected by agroforestry practice (Table 7). The emission values at Jangkok watershed could be considered relatively higher than those of other research in Tahura R Suryo (1.98 Mgha-1yr-1) and in Kalikonto watershed (3.76 Mgha-1yr-1) (Hairiah et al., 2010; Kurniawan et al., 2008).
Figure 5. Percentage of contribution C from agroforestry to landscape level carbon stock
16 17
20
23
0 5 10 15 20 25
1995 2000 2006 2009
C
c
o
n
tr
ib
u
ti
o
n
,
Figure 6. Total emission, sequestration and net emission due to the shift of land covers
Table 7. Emission and sequestration with influenced and withinfluenced by agroforestry
No
Category
Time Interval
1995-2000 2000-2006 2006-2009 1995-2009
-AF +AF -AF +AF -AF +AF -AF +AF
1 Total emission (Mton C) 0.23 0.23 0.28 0.28 0.09 0.09 0.66 0.66
2 Total sequestration (Mton C) -0.08 -0.02 -0.11 -0.01 -0.03 0.00 -0.23 -0.05
3 Emission net (Mton C) 0.15 0.21 0.17 0.27 0.05 0.09 0.43 0.61
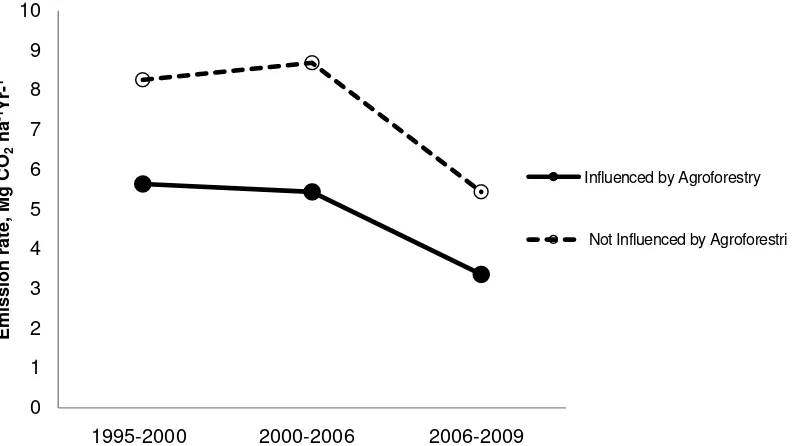
4 Emission level (Mg C ha-1) 7.70 11.3 8.91 14.2 2.75 4.45 22.4 32.1 5 C emission factor (Mgha-1yr-1) 1.54 2.25 1.48 2.37 0.92 1.48 1.60 2.29 6 CO2emission factor (Mgha-1yr-1) 5.64 8.26 5.44 8.69 3.36 5.44 5.86 8.41 Remarks: +AF : influenced by agroforestry, -AF: not influenced by agroforestry
Agroforestry Contribution in Reducing Emission Rate
Based on the previous calculation, it was obtained that average CO2 emission rate throughout Jangkok watershed was 5.6 Mgha -1yr-1. Another analysis was carried out to estimateagroforestry contribution in reducing emission rate at Jangkok watershed by eliminating the influence of sequestration values from agroforestry land cover followed. The analysis results were presented in Table 7.
Agroforestry has played a very important role in reducing net emission rates of CO2, which reached around 2.55 Mgha-1yr-1 (30%) on average. Agroforestry system has succeeded in transforming the lands with medium tree density into denser land covers. However, there is still emission released in the practice of agroforestry with smaller values of emission than those of sequestration (Figure 7).
1995-2000 2000-2006 2006-2009 1995-2009
Total emission 0.23 0.28 0.09 0.66
Sequestration -0.08 -0.11 -0.03 -0.23
Net emission 0.15 0.17 0.05 0.43
-0.3 -0.2 -0.1 0 0.1 0.2 0.3 0.4 0.5 0.6 0.7 0.8
A
mo
u
n
t
o
f
C
,
M
to
Figure 7. Comparison in emission rate where there was influenced and not influenced by Agroforestry
CONCLUSIONS
Agroforestry system contributed a significant carbon stock (16% - 23%), and also played a role (32-38%) in reducing net emission rates. These results lead to some concluding points: (1) Total carbon stock at Jangkok watershed was as much as 3.65 Mton in 2009, and the agroforestry system contributed 0.85 Mton (23%) of carbon stock; (2) Land use changehad put the carbon emission factor at 1.6Mg ha-1yr-1or CO2 emission rate at 5.86 Mgha-1yr-1; (3) Agroforestry with no sequestration had put CO2 emission rate at Jangkok watershed at the total of 8.41 Mgha-1yr-1, while this agroforestry practice managed to reduce the emission rate of CO2 to become 5.86 Mgha-1yr-1.
ACKNOWLEDGEMENTS
This manuscript is a part of the first authors dissertation for Doctoral Program at University of Brawijaya. Gratitude is addressed to WWF Int. Nusa Tenggara for providing the research funding. Last but not least, appreciation is also addressed to all of the farmers in Sesaot who involved in the carbon measurement in the field.
REFERENCES
Cabezas P.P. and K. Nathaniel. 2008. Reducing emissions from deforestation and forest degradation in developing countries (REDD): Implications for the carbon market. Environmental defense fund. pp.13. allometry and improved estimation of carbon stocks and balance in tropical forest. Oecologia 145: 87-99.
Corbera, E., M. Estrada and K. Brown 2010. Reducing greenhouse gas emissions from deforestation and forest degra-dation in developing countries: revisiting the assumptions. Climatic Change 100:355– 388.
Elverfeldt, C.S. 2010. Carbon finance possi-bilities for agriculture, forestry and other land use projects in a small-holder context. NRME Department, FAO. pp.23.
Glenda, J., 2008. Carbon storage and emissions offset potential in an Africa dry forest, the Arabuko-Sokoke forest, Kenya. Environ Monit Assess.142: 85-95
Hairiah K., J. Arifin, C. Prayogo, Widianto and Sunaryo. 2002. Prospects coffee-based agroforestry for carbon stocks Agro-teksos 12(2): 145-150. (in Indonesia)
Hairiah, K., S. Rahayu and Berlian, 2006. Environmental services of coffee-based agroforestry : carbon stocks in tree biomass and soil organic matter, case study in Sumberjaya, West Lampung. J. Agrivita. 28(3): 298-309. (in Indonesia) Hairiah, K., Widianto and D.Suprayogo. 2008.
Adaptation and mitigation of global warming: Can agroforestry reduce landslides and greenhouse gas emissions? INAFE, papers. Agroforestry education as strategies forcoping with global climate change. p. 42-62.
Hairiah, K. and S. Rahayu. 2010. Carbon stock and time-averaged-carbon stock in some land uses at Ngantang Subdistricts. In Hairiah K. and S. Rahayu. 2011. Carbon stocks measurement: From field to landscape. Word Agro-forestry Centre. pp.63. (in Indonesia)
Hairiah, K., A. Ekadinata, R.R Sari and S. Rahayu. 2011. Carbon stocks measurement: From field to landscape. Word Agro-forestry Centre. pp.88. (in Indonesia)
Khususiyah, N., Y.Buana and Suyanto, 2010. Community based forest management: Efforts to improve the welfare and equity income of poor farmers in the surrounding forest. ICRAF Policy Brief, Policy Analysis Unit no 6. pp.12.
Kurniawan,S.,C.Prayogo,Widianto,M.T. Zulkarnain, N.D. Lestari, F.K. Aini and K. Hairiah. 2008. Estimation of carbon stocks in agricultural land in Konto watershed, East Java. Research reports. pp.85 (in Indonesia) Markum, 2000. Assessment of greenhouse gas agroforestry for carbon sequestration and mitigation of greenhouse gas emissions from soils in the tropics. Nutrient Cycling in Agro-ecosystem 71: 43-54
Palm, C.A.., P.L. Woomer and J. Allegre. 1999. Carbon sequestration and trace gas emissions in slash and burn and alternative land uses in the humid tropics. ASB Climate Change Working Group Final Report, Phase II, ICRAF, Nairobi. pp.36. Rahayu, S. 2010. Agroforestry system in the buffer
zone of the protected forest in Sesaot: Its potential as carbon seques-tration. ICRAF Policy Analysis Unit Policy Brief no 7.pp.12. Silver, W.L., M.K. Lara, E.L. Ariel, O. Rebecca and M. Virginia. 2004.Carbon seques-tration and plant community dynamics following reforestation of tropical pasture. Ecological Application 14(4): 1115-1124 Carbon stock assessment for a forest-to-coffee conversion landscape in Sumberjaya (Lampung Indonesia): from allometric equation to land use change analysis. Science in China, 45:75-86 Van Noordwijk, M., D.A. Suyanto, B. Lusiana, A.
Ekadinata and K. Hairiah. 2008. Facilitating agroforestation of land-scapes for sustainable benefits: Tradeoffs between carbon stocks and local development benefits in Indonesia according to the FALLOW model. Agriculture Ecosystem and Environment 126: 98-112
Wang, Q., Y. Li and A. Alva. 2010. Cropping systems to improve carbon seques-tration for mitigation of climate change. Journal of Environmental Protection 1: 207-215 Woodbury, P.B., L.S .Heath and J.E. Smith. 2006.
Land use change effects on forest carbon cycling throughout the Southern United States. Journal of Environmental Quality 35: 1348-1363