International Journal of Industrial Engineering Research and Development (IJIERD), ISSN 0976 – 6979(Print), ISSN 0976 – 6987(Online) Volume 3, Issue 1, January - June (2012), © IAEME
13
LEAN IMPLEMENTATION IN MANUFACTURING INDUSTRY: A
CASE STUDY
S.K. Gupta1, Dr. R.V. Singh2, Dr. V.K. Mahna3, Rajender Kumar4 1
Research Scholar, Department of Mechanical Engineering, FET, Manav Rachna International University, Faridabad, India-121003
2
Head, Department of Mechanical Engineering, FET, Manav Rachna International University, Faridabad,
India-121003 3
Professor, Department of Mechanical Engineering, FET, Manav Rachna International University, Faridabad, India-121003
4
Asst. Prof., Department of Mechanical Engineering, FET, Manav Rachna International University, Faridabad, India-121003
E-Mail: [email protected], [email protected]
ABSTRACT
In the present business environment, overproduction refers to excess of production over demand of products being offered to the market. This leads to excessive inventory in terms of finished and semi finished goods. Excess production is only relative to a given demand, and insufficient demand is only relative to a given production and thus consider overproduction and under consumption equivalent. Overproduction is the root cause of imbalances, in production sections thereby; the men & machines are either unutilized or being used for over production. The principles of lean manufacturing are very loud in the subject matter and overproduction is the worst form of waste. In this present case, XYZ Company manufacturing automotive products of the same type but in wide variety was chosen for this comprehensive study. This company has problems in-hand regarding movement of material on shop floor, accumulation of material on shop floor, and waiting time in assembly line etc. The probable solution for above mentioned problems is to apply optimization approaches on production system.
Keywords: Overproduction, Lean Manufacturing, Inventory and Waste 1.0 INTRODUCTION
Often, key questions in examining manufacturing processes are: what are the value-added ratio of these supporting processes to the organization and the current plans of
INTERNATIONAL JOURNAL OF INDUSTRIAL
ENGINEERING RESEARCH AND DEVELOPMENT (IJIERD)
ISSN 0976 – 6979 (Print) ISSN 0976 – 6987 (Online)
Volume 3, Issue 1, January- June (2012), pp. 13-20 © IAEME: www.iaeme.com/ijierd.html
Journal Impact Factor (2011): 0.8927 (Calculated by GISI) www.jifactor.com
IJIERD
International Journal of Industrial Engineering Research and Development (IJIERD), ISSN 0976 – 6979(Print), ISSN 0976 – 6987(Online) Volume 3, Issue 1, January - June (2012), © IAEME
14
manufacturing. The plan of manufacturing may remain internal or extend i.e. outsourced. Principally the decision in this regard is of strategic nature therefore, the manufacturing has to be maintained inside the plant, except any change in volumes, may constraint to push the partial production outside and also the equipments, which have become redundant may not be replaced.
Waste is an activity that does not add value. Overproduction is the ability to produce far more products than can possibly be offered to the customer against the actual requirement. This leads to a struggle for sale of the undesired products and creating a situation wherein the marketing department need to apply all resources at their command to recover the invested money. Look around place of work and it can be noticed that there are excessive raw materials, excessive floor space unnecessarily occupied, excessive material handling, and accrued profits on downside. They are just the flags that there is a cause for these to be identified and addressed.
Therefore, symptoms and causes need to be identified and resolved. The normal symptoms are excessive raw material, extra inventory, unregulated material flow, excessive need of space for storage etc. This kills the efficiency and profitability of the organization. "A more liberal and extensive reciprocity in the production and sale of commodities is necessary, so that the overproduction of the companies can be satisfactorily disposed off to the market.”
The root causes of over production are unleveled scheduling, unbalanced capacity of each section, unreliable suppliers, unreliable process, misuse of automation, wide variety redundant inspection, unreliable tooling etc. Therefore answer is in usage of ‘5S’ and ‘5WHY’ as application of these tools is to help in identifying the problems related to over-production.
2.0 LITERATURE REVIEW
Successful lean implementation is approached from a strategic perspective and companies seek to reach certain goals with lean initiatives. As creating a lean workplace requires changing the corporate culture a robust change management strategy is needed (Parks, 2002). Such abrupt policy changes require a top-down approach to decision making (Kobayashi, 1995).
Mader (2005) emphasizes the need for strong top management leadership in the implementation process. Carefully selected Kaizen events should support the organization’s strategy and vision.
Only seeing lean as a quick fix, may give some employees the impression that Lean might not work in certain environments, i.e. in low volume operations. Spear (2004) says that at Toyota managers act as enablers and in that sense coach co-workers in solving problems instead of just fixing them.
International Journal of Industrial Engineering Research and Development (IJIERD), ISSN 0976 – 6979(Print), ISSN 0976 – 6987(Online) Volume 3, Issue 1, January - June (2012), © IAEME
15
competitive challenges. They have mentioned that lean initiatives can be taken up in the fields of automotive sector, aerospace, and consumer goods industries around the world. Moore has discussed various implementation tools of Lean Manufacturing, which can be incorporated in the industries.
Wheatley (2005) discussed five business factors for lean application. These factors are Operational Performance, Competitive advantage in Price and service, Profit Improvement, Shorter Lead-Times and reduction in prices. On analyzing these factors Wheatly concluded that Operational Performance can be improved up to 90%, Competitive advantage in Price and service up to 82%, Profit Improvement up to 80%, Shorter Lead-Times up to 75% and reduction in prices up to 62%.
3.0 CASE STUDY
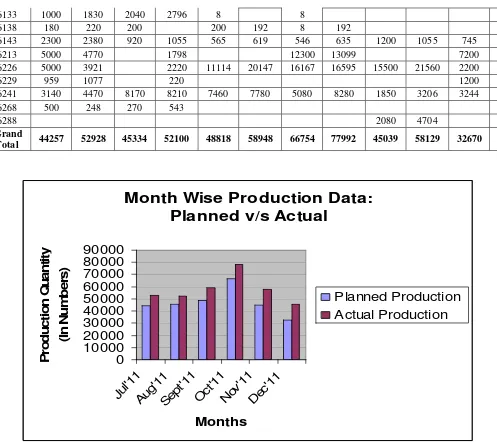
On the maiden visit to XYZ Company manufacturing automotive parts, there were many surprises, which were not affecting the operating management. The people walk day-in and day-out on the shop floor and are still unaware of the problems which remain hidden and are a cost to the company. The aisles were full of trolleys loaded with WIP and further every nook and corner was having no. of trays filled with WIP. Also, many of the trays didn’t carry the material identification including the quantities lying therein. This did represent the waste which was generated by the principle of inventory management like ‘First in last out’ i.e. inventory getting dumped one above the other. This type of planning attitude must provide for obsolescence and scrap. This further reveals that there was good amount of overproduction which is again type of waste that is producing more than the requirement. The principles of 5S have been used to identify, analyze and evaluate the existing manufacturing system. The fact regarding over production has been established as per production data: planned v/s actual. A total of 21 models were identified for overproduction and this is 10% of the existing models. The period under study is from Jul’2011 to Dec’2011 and model wise-month wise planned v/s actual production data of these 21 models is as per Table 1 and graphically presented in Figure 1.
Table 1 Production Data: Planned v/s Actual
Model No.
Jul'11 Aug'11 Sep'11 Oct'11 Nov'11 Dec’11
Plan Actual Plan Actual Plan Actual Plan Actual Plan Actual Plan Actual
3220 0 1560 1740 1296 84 0 84 236 0 0 3050 3360
3247 150 150 0 0 0 0 0 0 0 0 0 648
3289 4192 4872 2000 2769 4520 6334 0 0 0 0 1000 1152
3316 1100 680 0 0 150 0 650 528 6 0 0 948
3601 0 4050 200 975 0 3750 6250 7512 5800 5600 4200 4055
3711 6124 6286 7428 7650 8278 5198 9000 11402 8598 9740 1858 2824
3728 8820 7554 13266 14511 8795 9120 6675 7840 5680 7416 4714 5414
3900 4522 4160 5000 4416 7234 5328 9306 11481 4325 4848 2627 4018
4315 270 3780 1600 1331 270 420 0 0 0 0 0 552
4321 1000 920 2000 1950 0 0 600 0 0 0 500 1368
6124 0 0 200 144 56 0 56 192 0 0 48 192
International Journal of Industrial Engineering Research and Development (IJIERD), ISSN 0976 – 6979(Print), ISSN 0976 – 6987(Online) Volume 3, Issue 1, January - June (2012), © IAEME
16
Figure 1 Planned v/s Actual Production
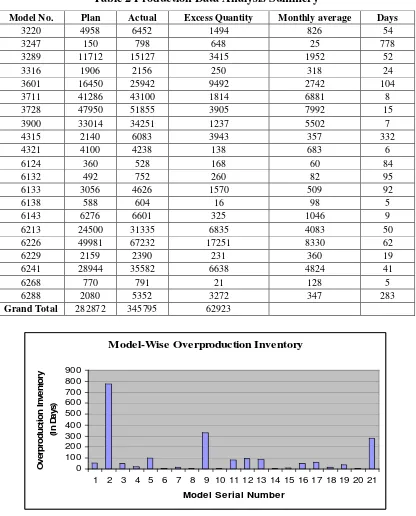
The compiled data in Table 1 has been analyzed and incorporated in Table 2 below. It is the application 5 Why’s which have led to establishing long setup times, unbalanced interdepartmental production, staying busy, unbalanced scheduling, larger plans, old machines and failure of implementation of preventive plans.
International Journal of Industrial Engineering Research and Development (IJIERD), ISSN 0976 – 6979(Print), ISSN 0976 – 6987(Online) Volume 3, Issue 1, January - June (2012), © IAEME
17
Table 2 Production Data Analysis Summery
Model No. Plan Actual Excess Quantity Monthly average Days
3220 4958 6452 1494 826 54
Grand Total 282872 345795 62923
International Journal of Industrial Engineering Research and Development (IJIERD), ISSN 0976 – 6979(Print), ISSN 0976 – 6987(Online) Volume 3, Issue 1, January - June (2012), © IAEME
18
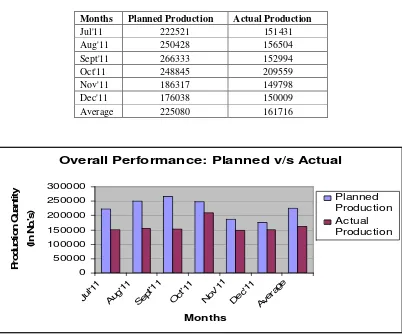
Table 3 confirms that, there is no relation between planned production and actual production. The data depicted in Table 3 is covering the entire range of monthly production of XYZ company manufacturing automotive parts. There is a wide gap between these two, this may be an indication of projecting consistently more, which can’t be produced and henceforth the desired objectives can’t be achieved.
Table 3 Gross average monthly production
Months Planned Production Actual Production
Jul'11 222521 151431
Aug'11 250428 156504
Sept'11 266333 152994
Oct'11 248845 209559
Nov'11 186317 149798
Dec'11 176038 150009
Average 225080 161716
Figure 3 Gross average monthly productions
International Journal of Industrial Engineering Research and Development (IJIERD), ISSN 0976 – 6979(Print), ISSN 0976 – 6987(Online) Volume 3, Issue 1, January - June (2012), © IAEME
19
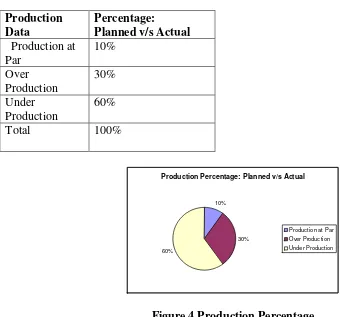
Table 4 Actual Performance: Planned v/s Actual
Production Data
Percentage: Planned v/s Actual
Production at Par
10%
Over Production
30%
Under Production
60%
Total 100%
Production Percentage: Planned v/s Actual
10%
30% 60%
Production at Par Over Production Under Production
Figure 4 Production Percentage
4.0 CONCLUSION
The strength of any business organization is related to availability of cash. Materials are the major constituent of the products and hence lot of engagement of funds, which need to be controlled for effective functioning. One of the biggest concerns of product manufacturers and company employees is eliminating Lean waste. It is very important to do away with this waste and reduced the cost of final product. The waiting time shall automatically get reduced creating a ‘Pull Production’ in place of ‘Push Production’. The processes, especially the tooling, need to be improved to facilitate easy and positive changeover. Such controls once put in positions will provide free flow of material including better utilization of available man power. The paper reveals the one of important issue in organizations that is Overproduction-Inventory. The contributions of overproduction items lead towards the excessive unutilized funds including un- narrated inefficiencies due to the wastes.
REFERENCES
1) Kobayashi, I. (1995). “20 keys to workplace improvement”, Productivity Inc., Revised edition, Portland, OR, USA.
International Journal of Industrial Engineering Research and Development (IJIERD), ISSN 0976 – 6979(Print), ISSN 0976 – 6987(Online) Volume 3, Issue 1, January - June (2012), © IAEME
20
3) Moore, R. (2006). “Selecting the right manufacturing improvement tools”, Elsevier Science
& Technology Books, ISBN: 0750679166.
4) Spear, S. J. (2004). “Learning to lead at Toyota”, Harvard Business Review, May 2004, pp.78 – 86.
5) Parks, C. M. (2002). “Instill lean thinking”, Industrial Management, Sept.– Oct. 2002, pp. 5 – 18.
6) Wheatley, M. (2005). “Think lean for the long term”, Manufacturing Business Technology, June 2005. pp. 36 – 38.
7) Womack, J.P., and Jones, D.T. (1998). “Lean thinking: Banish waste and create wealth in your corporation”, Free Simon & Schuster, New York.
8) Womack, J.P., and Jones, D.T. (2005). “Lean solutions: How companies and customers can create value and wealth together”, Free Press, New York.
AUTHORS BIBLIOGRAPHY
1
S.K.Gupta holds Bachelor in Production Engineering, Masters in Manufacturing and Automation and persuing PhD in Mechanical. Currently, he is working as an Assistant Professor in the Department of Mechanical Engineering at Manav Rachna International University, Faridabad, Haryana, India. His area of interest is Productivity Improvement, Man-Management, Lean and Green Manufacturing, and Six-Sigma etc.
2
Dr. R.V. Singh completed B.Sc. in Engg. (Mechanical) with distinction from MIT Mujhafarpur, Masters in Engg. (Production) with distinction from D.C.E., Delhi, PhD. from IIT Delhi. He is associated with FET, MRIU as a Professor and Head of Mechanical Engineering Department. He has more than 16 years experience in teaching and 15 research papers to his credit at National or International Level. His area of interest is Production Engineering, modeling and optimization, Precision Engineering. He has guided 9 M.Tech. Dissertations and currently he is supervising 6 research scholars. He is life member of IEI, India, ISTE, ISME, and MSI.
3
Dr. V.K. Mahana is doctorate from IIT Delhi. He is associated with FET, MRIU as a Professor in Mechanical Engineering Department at Manav Rachna International University, Faridabad, Haryana, India. He has more than 39 years experience in teaching. and 20 research papers to his credit at National or International Level. His area of interest is Design, modeling and optimization of Quality.
4
Rajender Kumar holds Diploma in Plastic and Railway Engineering, Bachelor in Mechanical Engineering, Masters in Mechanical Engineering. Currently, he is working as an Assistant Professor in the Department of Mechanical Engineering at Manav Rachna International University, Faridabad, Haryana, India. He has 15 research papers to his credit at National and International Level. His area of interest is Productivity Improvement, Quality Management, Lean and Green Manufacturing, and Six-Sigma etc. He is also associated member of IEI, India.