THE EFFECT OF BUILDING FAÇADE MODEL ON LIGHT
DISTRIBUTION
(CASE STUDY: MENARA PHINISI BUILDING OF UNM)
Nurul Jamala
Departement of Architecture, Faculty of Engineering, Hasanuddin University Email: [email protected]
ABSTRACT
Global warming issues influence the temperature of the earth surface. It is an impact on energy consumption, especially in buildings. Utilization of daylight is one of the factors that need to be considered, in order to minimize energy consumption as a source of artificial lighting. This study analyzed the distribution of light on the Menara Phinisi building of Makassar State University. Quantitative research method that is to describe the data of simulation in Autodesk Ecotect program. The research objective was to determine the effect of the building facade model on the value of illumination inside the building. Results of the study concluded that the decrease percentage of the distribution of light on the building facade using and not using the facade is 3,16% or 236 lux. Distribution of light in horizontal and diagonal facade models differ in the amount of 2,5%. Design analysis of the building serves as a guide for analyzing the influence of the building facade model so that it can create energy efficient buildings.
Keywords: Level illuminance; building façade; daylight.
INTRODUCTION
The architectural energy-saving concept is optimizing the lighting system taking into account the integration between daylight (sun) and artificial (lamp). The use of energy as a source of illumination will be reduced when daylight is used optimally by considering the negative effects such as glare, brightness and thermal. Utilization of daylight effect on the building envelope (facade), building orien-tation and wall wide openings.
Menara Phinisi of Makassar State University is a building for Academic Services Center (GPPA) in the form of podium consisting of three floors and part of the head in the form of a menara consisting of 12 floors which is a metaphor of the boat phinisi screen. Shape of the facade on the building, implemented a system which is a Paraboloid Hiperbolic as a facade futuristic sophistication of the application of science and technology.
Figure 1 shows the 17-storey Menara Phinisi building of UNM by building models shaped vertical (right and left) and diagonal (front and rear). The style of building facade beautify the shape of the building, but it is necessary to analyze how the percentage decrease in the level of light that can be penetrated into the building so that the use of energy as a source of artificial lighting can be minimized. It needs a study of daylight in the Menara Phinisi of Makassar State University.
LITERATUR STUDY
Energy consumption in office buildings is relatively large, but the use of energy as a source of artificial lighting is relatively small. Maximizing the use of sunlight as a source of daylight will reduce energy consumption as a source of artificial lighting, but worth noting negative effects that they may cause among others: glare, brightness and themal. This would reduce the comfort and productivity of the user's work space. This description, need special attention in terms of designing energy efficient buildings.
In order to improve the understanding of energy conservation in buildings, the National Standardiza-tion Agency (BSN) developed Energy ConservaStandardiza-tion in Lighting System that is SNI 03-6197-2000. This standard establishes guidelines for the provision of lighting in buildings. This is to obtain a lighting system with optimal operation so that energy can be efficiently consumed without reducing, changing functions of the building. Energy use in buildings is as a source of lighting, air conditioning, and other equipment. According Sugijanto (1998) that the distribution of energy consumption in buildings is 50-70% for air conditioning, lighting 10-25% and to 2-10% for Elevator.
recommended by SNI 03-6575-2001 on procedures for the design of artificial lighting systems in buildings is referring to the National Electric Code (NEC), Illuminating Engineering Society (IES), the International Electrotechnical Commission (IEC) and the Australian Standard. The level of illumination on the recommendation of ISO 2001 based on the function space for example for office buildings namely the director, work space, computer room recommended amount of 350 lux, conference room of 300 lux, the drawing room of 750 lux, warehouse archives of 150 lux and space active archive 300 lux.
Shading devices modify the intensity and distribution of daylight entering the space. Lighting design scheme and placement of control zones maybe affected. Facade on the building envelope influence the distribution of light (Nurul, 2016). Japanese authors Nakamura et al. (1985) have classified into three groups sky condition i.e. overcast, clear and intermediate trying to define the luminance distri-bution of the intermediate sky. Governor Regulation No. 38 (2012) explained that the building envelope is a building element that surrounds the building. They are transparent or not transparent walls or the roof. Karlen & James (2006) state that the skylight from the roof operates as lighting lamps that emit light directly with the direction of light down the hole while the light from the side using vertical openings to take advantage of daylight.
METHODOLOGY
Quantitative research method was using Autodesk Ecotect Analysis program 2011. This program is used to determine the level of illuminance at the measuring point in the building. This study analyzes the building facade to the lluminance level of daylight into the building and comparing the value of illuminance when using and not using the building facade on the building of Menara Phinisi of Makassar State University.
Program Autodesk Ecotect Analysis simulate Menara Phinisi building of UNM by designing the bearing window material single glazed aluminum frame and grid management. Calculated daylight level on CIE overcast sky. Simulation Conducted in Makassar with Climate Log-lat -5.10 and 119.50
(+8.0) in May at 12 o’clock.
RESULTS AND DISCUSSION
Autodesk Ecotect Analysis calculated results showed the level of lluminance in the Menara Phinisi Building of Makassar State University. Window
placement on the building envelope on the left, right, front and rear really varied so that the daylight coming into the building are different. Menara Phinisi Building consists of 17 floors, but the placement , area and shape resemble the façade is on each floor, so the analysis is only done on the 9th floor. Figure 2 below shows the vast differences, position and orientation the window as building envelope. This shows that
Analysis Of Daylight Distribution in Buildings by Using and Not Using Facade.
Building facade design can beautify the appearance of the building. But to be kept in mind about the daylight distribution when using and not using the building facade. Electrical energy consumption can be reduced if it can maximize the use of daylight.
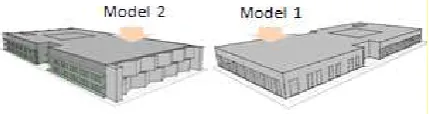
This study analyzes the light distribution when using and not using the hyperbolic paraboloid façade.
Fig. 3. Building Façade Design (Model 1 and 2)
Table 1 shows the daylight illuminance on the area of the building envelope. The average level of illuminance level outside the buildings is up to 7755 lux, and a minimum of 7264 lux. This value indicates that the level illuminance around the building are approximately equal in the amount of 7479 lux.
Then a simulation was performed to determine the value of iluminance inside the building. The measuring point was located at a distance of 1 meter from the building envelope, such as the table 2 and 3 below.
Table 2 shows level of illuminance in the building without building façade or model 1 and table 3 shows Level of illuminance in the building using hyperbolic paraboloid as building façade or model 2.
Based on the three tables above, it can be seen that the distribution of light into the building with values almost the same in all zone building envelope.
The distribution of light percentage on of the building without the facade (model 1) amounted to 13.63%, while use of the facade (model 2) amounted to 10.47%. Based on this description, it can be concluded that the distribution of light affect the building façade.
Figure 5 shows that the value oflevel of illumi-nance on the building using façade less than the not using façade. Differences in light distribution when using and not using the building facade is equal to 3.16% or 236.5 lux
Fig. 4. The Light Distribution of Daylight
Fig. 5. Distribution of Light on the Building using and not using the Building Façade
Table 1. The Simulation Results Show the Level of Illumination in the area Outside of the Building
Position of Measure Point Daylight Illuminance (lux) Mean (lux)
The rear of the building 8043 7251 7341 7340 7381 7253 7155 7259 7270 7981 7427 The front of the building 8230 7636 7610 7608 7559 7602 7620 7890 7635 8163 7755 The right side of the building 7981 6879 6921 6964 6913 7292 6940 7340 7242 8163 7264 The left side of the building 8043 7227 7224 7103 7240 7457 7438 7427 7305 8230 7469
Table 2. Level of Illuminance in the Buiding without Building Façade (Model 1)
Position of measure point Level of Illuminance / Model 1 (lux) Mean (Lux) The rear of building without
facade)/ Zone A 1304 1043 1294 1051 696 1150 1094 1240 920 1256 1105 The front of building without
facade)/ Zone B 670 1065 1088 1160 1082 978 1321 956 961 661 994 The right of building without
facade)/ Zone C 1256 1245 1345 1451 1346 123 562 937 606 661 953 The left of building without
facade)/ Zone D 1304 1522 1520 1460 1396 217 615 958 585 670 1025
Table 3. Level of Illuminance in the Building with Building Façade (Model 2)
Analysis of the Light Distribution of Model Facade
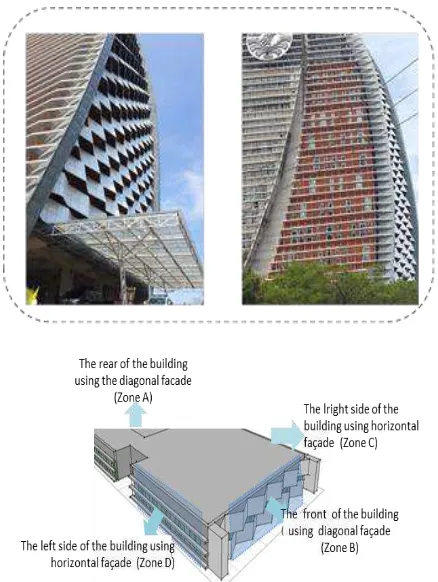
Furthermore, the model building facade will be analyzed. Facade model on Menara Phinisi building of UNM uses horizontal and diagonal. The rear of building using diagonal façade (Zone A), The front of building using diagonal façade (Zone B), The right side of building using horizontal façade (Zone C) and The left side of building using horizontal façade (Zone C). This study analyzes the differences in the distribution of light into the building, when using horizontal or diagonal façade.
The simulation results show the level illumi-nance in buildings by using diagonal facade (zone A and B) and horizontal façade (Zone C and D), such as Figure 7.
Fig.6. Facade Design of the rear, front. Left and right side of the buiding
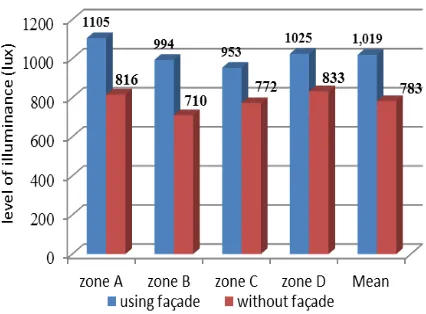
Fig. 7. The Simulation Result of Illuminance Level
Fig. 8. The Percentage Distribution of Daylight
Figure 7 shows the distribution of light by using a model of horizontal and diagonal facade. The average level of illuminance on a diagonal facade area amounted to 727 lux and 710 lux while the diagonal facade of 772 lux and 833 lux. This suggests that the the building facade models effect on distribution of light that enters the building. The absorption of level of illuminance is higher when using horizontal facade.
Figure 8 shows that in the zone A and B decreased by 4%, ie 11-15% and zone B (13% -9%) so it can be concluded that the decrease percentage is 4% when using diagonal facade. Further, zones C and D decreased by 1-2%, ie zone C of 12% -13% and zone D by 14% -12%. Average value of the difference of level of illuminance value between the model façade diagonal and horizontal is 2.5%. Based on this description, it can be concluded that the building facade model influences the distribution of daylight.
CONCLUSION
The study concluded that the level of illuminance effect on the building facade. Result of research shows that this value indicates that the level of illuminance of daylight on around the building are approximately equal in the amount of 7479 lux.
Light distribution in the Menara Phinisi building of UNM, when not using the facade has average value of 1019 lux or 13,63%. Whereas when using hyperbolic paraboloid facade generates a mean value of 783 lux or 10,47%. Based on this, it can be concluded that a decline of 3,16% or 237 lux when using the facade, but can be avoided from negative effects such as glare, brightness and heat.
while the shape of a horizontal façade produce a mean value of 1.5% percent. It can be concluded the differences of the decline of daylight distribution by using diagonal and horizontal form of 2.5%.
REFERENCES
Pritchar, D. C. (1986). Interior Lighting Design, 6th ed., The Lighting Industry Federation Ltd. and The Electricity Council, London Badan Standar-disasi Nasional (2001), Tata Cara Sistem Perancangan Sistem Pencahayaan Alami Pada Bangunan Gedung, SNI 03-2396-2001, Jakarta. Illuminating Engineering Society (1977). IES code
for Interioir Lighting, IES Lighting Handbook, London M. Wegmuller, J. P. von der Weid, P.
Oberson, and N. Gisin, “High resolution fiber
distributed measurements with coherent
OFDR,” in Proc. ECOC’00, 2000, 11(3-4),
pp. 109.
Illuminating Engineering Society of North America (1993). American national standard practice for office lighting. New York: Illuminating Engi-neering Society of North America.
Jamala, N. (2016). The Effect of Building on Natural Lighting (Case Study: Building of Phinisi Tower UNM), 7th International Conference on
Mecha-nical and Manufacturing Engineering “Sustaina
-ble Energy Toward Global Synergy, Univesiti Tun Hussein Onn Malaysia, Jogjakarta.
Lembaga Pendidikan Masalah Bangunan (2001). Tata Cara Perancangan Penerangan Alami Siang Hari Untuk Rumah dan Gedung, SNI 03-6575-2001, Jakarta.
Nakamura, H., Oki, M. & Hayashi, Y. (1985). Lumi-nance Distribution of intermediate sky. Journal of Light and Vis. Environment, 9(1), pp.n6-13 Soegijanto (1993). Standar Tata Cara Perancangan