10
N
2O Emissions from Rainfed Sugarcane Plantation
Emisi N
2O dari Pertanaman Tebu di Lahan Tadah Hujan
Anggri Hervani, Rina Kartikawati, Miranti Ariani, and Prihasto Setyanto
Balai Penelitian Lingkungan Pertanian
Jalan Raya Jakenan-Jaken km 05, Pati, Jawa Tengah E-mail: [email protected]
Submitted: 31 March 2016; revised: 16 December 2016; accepted: 9 April 2017
ABSTRACT
Expansion of sugarcane areal to support enhancement production and fulfilment target of self-sufficiency for national sugar should be conducted to see environment impact, particularly related to greenhouse gases emission. The objective of this study was to figure out N2O emission from conventional sugarcane plantation
by farmer in rainfed area. The observation of N2O gas was carried out in sugarcane plantation in Sidomukti
Village, Jaken District, Pati, Central Java. Sampling of N2O gas was conducted by close chamber method.
The study showed that maximum fluxes of sugarcane plantation before and after fertilizer application are 4.011 and 223 µg N2O m-2 day-1. Meanwhile, after fertilizer application the maximum and minimum fluxes of
N2O are 6.408 and 25 µg N2O m -2 day-1. N2O emission from sugarcane plantation recorded in rainfed area as
4.21 ± 2.53 kg N2O ha-1 year-1 with potential of global warming number as 1.31 ton CO2-e per hectar per
year.
Keywords: Emission, N2O, plantation, sugarcane
ABSTRAK
Perluasan areal tanam tebu untuk mendukung peningkatan produksi dan pemenuhan target swasembada gula nasional sudah dianggap perlu untuk melihat dampak lingkungan khususnya mengenai evaluasi emisi gas rumah kaca dari pertanaman tebu. Tujuan dari penelitian ini adalah untuk mengetahui emisi gas N2O
dari sistem pertanaman tebu secara konvensional petani di lahan tadah hujan. Pengamatan gas N2O
dilakukan pada lahan perkebunan tebu di Desa Sidomukti, Kecamatan Jaken, Kabupaten Pati,Jawa Tengah. Pengambilan sampel N2O menggunakan metode sungkup tertutup. Hasil penelitian menunjukkan bahwa
fluks maksimum pada pertanaman tebu sebelum pemupukan sebesar 4,011 µg N2O m-2 hari-1 dan fluks
minimum sebesar 223 µg N2O m-2 hari-1, sedangkan fluks maksimum setelah pemupukan sebesar 6,408 µg
N2O m-2 hari-1 dan fluks minimum sebesar 25 µg N2O m -2 hari-1. Emisi N2O pertanaman tebu sebesar 4.21 ±
2.53 kg N2O ha-1tahun-1 dengan nilai potensi pemanasan global sebesar 1.31 ton CO2-e per hektar per
tahun.
Kata kunci: Emisi, N2O, perkebunan, tanaman tebu
INTRODUCTION
hree major gases emission from agri-culture sector are CH4 around 67% from
the total emissions from agriculture sector, following by N2O (30%) and CO2 (3%). Total
emission from this sector in 2000
ap-proximately 75.419,73 Gg CO2-e. Between
2000 and 2005, emission from agriculture was increase as 6,3% (Ministry of Environment SNC 2009).
Dinitrogen oxide (N2O) emissions not
only contribute through GHG effect but also as a damage causes of statosfer ozon layers.
T
A Hervani et al.: N2O Emissions from Rainfed Sugarcane Plantation
11
Almost 90% global N2O emissions formed
during the nitrate (NO3-) and amoniac (NH4+)
microbe transformation in the soil and water. Globally, contribution from agriculture sector for N2O emissions is 65–80 percent from total
emissions, especially from nitrogen fertilizer in the soil management system, livestock, and manure. Agriculture contribution in Indonesian
N2O emissions estimated at 70 percent (SNC).
N2O emissions from soils comes from N
productive loses. Nitrogen input (synthetic fertilizer and biomass) and also nitrogen mineralization in the soils which is reach of organic materials contribute to N2O emissions.
The N2O emissions from rice fields depends on
nitrgen fertilizer rates. Global Warming Potential (GWP) from greenhuse gases to
carbondioxide as big as 21 times for CH4 and
310 for N2O reported in IPCC Second
Assesment Report National Standard of Indonesia/Standart Nasional Indonesia (SNI ISO 14064 2009).
In 2006–2012, the area of state
sugarcane plantation in Indonesia have been expanded from 213.900 ha to 247.800 ha that support increase in sugar production as 1.028.700 ton in 200 6 to 1.445.100 ton in 2012 (BPS 2015), while for private sugarcane plantation owned by big com-pany decreased from 396.400 ha to 194.900 ha. Because of those expansion, environ-mental issues such as Greenhouse Gas’s (GHG’s) emission from cultivation practices should be evaluated.
GHG’s emission from sugarcane plantation
correlated with land use change, fertilization, irrigation and residue management (including litter burning), and fossil fuel use (Figueiredo & La Scala Jr 2011; Lisboa et al. 2011). Study in Brazil showed that N fertilizer is main
contributor to GHG’s emission in sugarcane
plantation (Lisboa et al. 2011).
Studies on GHG’s emission in sugarcane
plantation, particularly in rainfed area are limited. Therefore we conducted a research
aimed to figure out N2O emission from
sugarcane plantation conventionally
conducted by the farmer in rainfed area.
MATERIALS AND METHOD
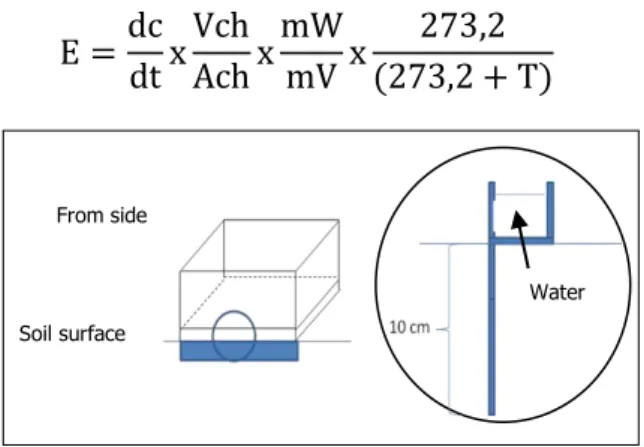
Observation was conducted in the state of sugarcane plantation in Sidomukti village, District of Jaken, Pati City, Central Java Province in 2014. Sampling was carried out in existing sugarcane plantation owned by farmer of those village that consist of three blocks distinguish by water pathways and four replication with “Bulu Lawang” cultivar. The plant was one month days after showing. Before sampling, base for chamber was set up in each point observation (Figure 1) for reduce gas leakage from cracked soil. N2O
was captured use 40 cm length x 20 cm width x 30 cm height close chamber, 6 times during observation (each of 3 times before and after fertilizer application). Chamber placement in sugarcane plantation was showed in Figure 2. Taking the gas sampling in erly morning at
06.00 AM with time interval for N2O sampling
was 10, 20, 30, 40, and 50 minute. The point of observation for N2O sampling was in row
and between crops. Sampling was conducted every month before fertilization and after second fertilizer application in 3, 7, and 15 days after fertilization (DAF). Gas samples were analyzed using Greenhouse Gas (GHG) Chromatography type Varian 450 equipped by
Electron Capture Detector (ECD) as N2O
detector with Argon (Ar), Hydrogen (H2),
Helium (He), and Nitrogen (N2) as the carrier
gas.
N2O emissions were calculated by using
equation below (Lantin et al. 1998):
Figure 1. Base for chambers observation
From side
Soil surface
12
Figure 2. Position of base and chambers observation in the sugarcane plantation
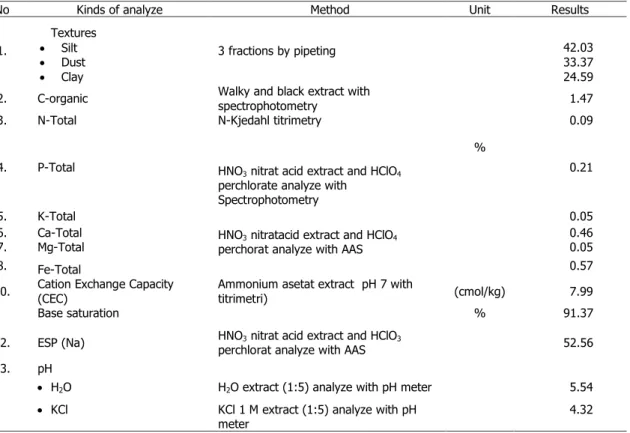
Table 1. The results of soil analyze from Sidomukti Village, Jaken District, Pati City 2014
No Kinds of analyze Method Unit Results
1. Textures 3 fractions by pipeting % Silt 42.03 Dust 33.37 Clay 24.59
2. C-organic Walky and black extract with
spectrophotometry 1.47
3. N-Total N-Kjedahl titrimetry 0.09
4. P-Total HNO3 nitrat acid extract and HClO4 perchlorate analyze with Spectrophotometry
0.21
5. K-Total
HNO3 nitratacid extract and HClO4 perchorat analyze with AAS
0.05
6. Ca-Total 0.46
7. Mg-Total 0.05
8. Fe-Total 0.57
10. Cation Exchange Capacity (CEC)
Ammonium asetat extract pH 7 with
titrimetri) (cmol/kg) 7.99
11. Base saturation % 91.37
12. ESP (Na) HNO3 nitrat acid extract and HClO3
perchlorat analyze with AAS 52.56 13. pH
H2O H2O extract (1:5) analyze with pH meter 5.54
KCl KCl 1 M extract (1:5) analyze with pH meter
4.32
Source: Integrated Laboratory of Indonesian Agricultural Environment Research Institute, 2014
Where, E is flux of greenhouse gas emission (mg/m/hour for CO2 and CH4, μg/m/hour for
N2O). δc/ δt is the change of gas
concentration (ppm); h is effective high of closed chamber head space (m); mW is molecule weigh of CO2 (44 gram/mol), CH4
(16 gram/mol), and N2O (44 gram/mol);
273oC is Standard tempe-rature; mV is volume
of molecule (22.41 x 10⁻³ m3); and T is temperature in close chamber (oC).
Applied fertilizer in sugarcane plantation were 600 kg ZA, 200 kg SP36 and 200 kg KCl per ha. The first fertilization was applied as base fertilizer (1/3 dose of ZA, all of SP36 and KCl). The 2/3 dose of ZA was applied in second fertilization when the sugarcane 1.5 month, in the early of rainy season.
A Hervani et al.: N2O Emissions from Rainfed Sugarcane Plantation
13
Application of fertilizer was conducted by spreading in the edge of plant.
RESULT AND DISCUSSION
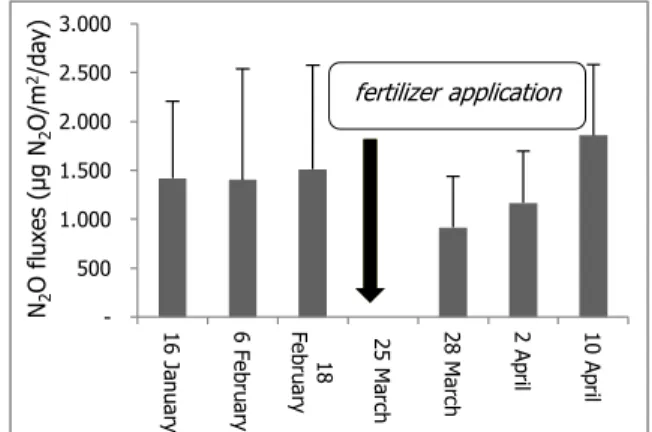
The result of N2O observation in
sugarcane plantation before and after
fertilization in 2014 is showed by Figure 3.
Figure 3. N2O fluxes before and after fertitilzer
application
N2O fluxes were varies during
obser-vation. According to Danevcic et al. (2009), it due to many factors influence to N2O emission
such as temperature, soil pH, availability of organic matter, aeration and fertilizer use. Elder & Lal (2008) was also find that N2O
fluxes positively correlated with soil
temperature in several depth, air temperature and CO2 fluxes and one of N loses from
plantation is N2O emission. Denmead et al.
(2010) mentioned that covering by canopy and high frequency of rainfal lead high humidity of soil that induce high production of N2O through nitrification and denitrification
process. In this study showed that N2O fluxes
increase after fertilizer application (in
observation date of March 28 and April 10). Daily average of N2O fluxes before and after
fertilizer application were 2,015 ± 236 and 2,858 ± 690 µg m-2 day-1. Total N2O emission
during observation in rainfed sugarcane plantation was 4.21 ± 2.53 kg N2O ha-1 year-1.
While the Global Warming Potential (GWP) was 1.31 ton CO2-e.
Several studies found that large
variation of N2O emission occur, particularly in
application of N fertilizer either through chemical or organic fertilizer (Dalal et al. 2003; Jantalia et al. 2008; Signor 2010 cit
Oliveira et al. 2013). Jantalia et al. (2008) recorded that N2O fluxes varies from 0 to 183
mg N2O-N m-2 day-1, while Signor (2010)
observed N2O fluxes from -10 to 2520 mg
N2O-N m-2 day-1 followed amount of different
N fertilizer applied in sugarcane plantation. They showed that variation in N2O fluxes
depend on application of N fertilizer, method of application, soil type, and soil water content.
Table 2. Maximum, minimum, and average of N2O fluxes in Jaken District, Pati 2014
Time application N2O Fluxes (µg N2O m-2 day-1) Maximum Minimum Average Before fertilizer 4.011 223 2.015 ± 236 After fertilizer 6.408 25 2.858 ± 690
Increasing of N availability in soil could
enhance N2O gas, however it depend on
interaction between soil type, climate and cultivation technique. The important factors
for forming and releasing N2O gas are
ammonia content and nitrate in soil, aeration status of soil and soil water content, easily degraded of organic matter, soil pH and
temperature (Bauwman 1994 cit.
Orbanus-Naharia 2002). According to Verge et al. (2007), application of organic and chemical fertilizer tend to increase N2O emission in soil,
N2O emission from soil increase 16% between
1999 and 2000 and N fertilizer contribute around 4%. Machefert et al. (2002) stated that the highest N2O emission produced by
agriculture followed by forest and grassland and the main factor which affect are availability of N mineral, soil temperature, water soil content and organic matter.
CONCLUSIONS
Maximum flux in the sugarcane
plantation before fertilization as 4.011 µg N2O 500 1.000 1.500 2.000 2.500 3.000 1 6 J a n u a ry 6 F e b ru a ry 18 F e b ru a ry 25 Ma rc h 2 8 Ma rc h 2 Ap ril 1 0 Ap ril fertilizer application N2 O f lu x es (µ g N2 O/m 2/day)
14
m-2day-1 and minimum flux as 223 µg N2O m -2
day-1. Meanwhile the maximum and minimum
flux after fertilization as 6.408 and 25 µg N2O
m-2day-1, respectively. N2O emission from
sugarcane plantation was recorded as 4.21 ± 2.53 kg N2O ha-1 year-1 with the GWP as 1.31
t CO2-e.
ACKNOWLEDGEMENT
Thank you very much Titi Sophiawati, Jumari, Susanto, Rakhmah Setianingrum, Sri Wahyuni, and Hilda Amelia Rakhmawati and technicians in research group of Emission and Absorption of GHG in Indonesian Agricultural Environment Research Institute for helping us in this study.
REFERENCES
Badan Pusat Statistik (BPS) 2016, Data Luas Areal Tebu, diakses pada 10 Februari 2015 (www.bps.go.id).
Dalal, RC, Wang, W, Robertson, GP, Parton, WJ 2003, Nitrous Oxide Emission From Australian Agricultureal Lands and Mitigartion Options: A Review, Australian Journal of Soil Research, 41:165–195.
Danevcic, T, Mandic-Mulec, I, Stres, B, Stopar, D & Hacin, J 2009, Emissions of CO2, CH4, and
N2O from Southern European Peatlands, Soil
Biology and Biochemistry, 42(9):1437–1446. Denmead, OT, Macdonald, BCT, Bryant, G, Naylor,
T, Wilson, S, Griffith, DWT, Wang, WJ, Salter, B, White, I & Moody, PW 2010, Emissions of methane and nitrous oxide from australian sugarcane soils, Agricultural and Forest Meteorology, 150:748–756.
Elder, JW & Lal, R 2008, Tillage effects on gaseous emissions from an intensively farmed organic soil in North Central Ohio, Soil & Tillage Research, 98:45–55.
Figueiredo, EB & La-Scala, N Jr 2011, Greenhouse gas balance due to the conversion of sugarcane areas from burned to green
harvest in Brazil, Agriculture, Ecosystems and Environment, 141:77–85.
Jantalia, CP, Santos, HP, Urquiaga, S, Boddey RM & Alves, BJR 2008, Fluxes of nitrous oxide from soil under different crop rotations and systems in the south of Brazil. Nutrient Cycling Agroecosystems, 82:161–173.
Lantin, RS, Wassmann, R, Neue, HU, Aduna, JB, Alberto, MC & Bueno, C 1998, Methane Emission from Ricefield, in IRRI-UNDP Final Workshop, Beijing & Hangzhou, 10–13 August 1998.
Lisboa, CC, Butterbach-Bahl, K, Mauder, M & Kiese, R 2011, Bioethanol production from sugarcane and emissions of greenhouses gases-known and unknowns, Global Change Biology Bioenergy, 3:277–292.
Machefert, SE, Disel, NB, Golding, KWT & Whitehead, PG 2002, Nitrous oxide emission from a range of land used across Europe,
Hydrology and Earth System Sciences, 6(3):325–337.
Ministry of Environment 2009, Summary for Policy Makers: Indonesia Second National Communication Under the United Nation Framework Convention on Climate Change (UNFCCC), Jakarta, November 2009.
Oliveira-de, BG, Carvalho, JLN, Cerri, CEP, Cerri, CC & Feigl, BJ 2013, Soil greenhouse gas fluxes from vinasse application in Brazilian Sugarcane Areas,Geoderma, 200–201:77–84. Orbanus-Naharia 2002, Teknologi pengairan dan
pengolahan tanah pada budidaya padi untuk pengurangan emisi metana dan N2O, Disertasi
Program Pascasarjana Institut Pertanian Bogor.
Signor, D 2010, Carbon and nitrogen stagnation and greenhouse gas emissions in sugar-cane areas in Piracicaba, 119 p., Dissertation (Mastery in Soils and Plant Nutrition)-Luiz de Queiroz Agricultural School, University of Sao Paulo, Piracicaba.
SNI, ISO 14064 2009, downloaded 4 December 2016 (www.ssni.bsn.go.id).
Verge, XPC, Kimpe CD & Desjardins, R.L 2007, Agricultural production, greenhouse gas emissions and mitigation potential, Agricultural and Forest Meteorology, 142:255–269.