Faculty of Science
PhD Study of Biophysics
Doctoral thesis
Design and testing of Adepantins – functional
artificial antibiotics
Nada Ilić
Sveučilište u Splitu
Prirodoslovno-matematički fakultet Doktorski rad
DIZAJN I TESTIRANJE ADEPANTINA – NOVIH PEPTIDNIH ANTIBIOTIKA Nada Ilić
Rad je izrađen na:
Prirodoslovno – matematičkom fakultetu Sveučilišta u Splitu i na Odjelu za znanost o životu Sveučilišta u Trstu
Sažetak
Kao važan dio urođenog imunološkog sustava svih živih bića, antimikrobni peptidi, smatraju se možebitnim riješenjem u brobi protiv bakterija otpornih na standardne antibiotike. Važna osobina dobrog kandidata za budući lijek njegova je selektivnost, koja se određuje kao omjer koncentracije pri kojoj se opaža 50%-tna hemolitična aktivnost prema eritrocitima i minimalne inhibitorne koncentracije pri kojoj se opaža 100%-tna inhibicija rasta bakterijeEscherichije coli. Algoritmom „Designer“ dizajnirani su adepantini – veoma selektivni umjetni peptidi u konformacijiuzvojnice, bogati glicinom i lizinom, a sličnost njihovih sekvenci s poznatim antimikrobnim peptidima manja je od 50%. Algoritam je koristio našu bazu podataka antimikrobnih peptida iz anura s poznatim indeksom selektivnosti.
Eksperimentalnim i računalnim metodama istražene su strukture i aktivnosti monomera, dimera i fluorescentno označenih oblika adepantina. Eksperimentalna istraživanja provedena na različitim sojevima bakterija pokazala su visoku selektivnost adepantina prema Gram-negativnim bakterijama (MIC = 0.5 - 4
µM), naročito premaE. coli. U mjerenju propusnosti membrana rabljeni su različiti modeli membrana, a pokazalo se da adepantini vrlo brzo povećavaju propusnost obje membraneE. coli. Time je dobiven uvid u mehanizme djelovanja adepantina. Svi monomeri adepantina imaju izrazito malu hemolitičnost prema eritrocitima, dok su dimeri pokazali određenu toksičnost prema ljudskim stanicama. Dokazano je da se adepantini vežu na staničnu površinu ljudskih stanica bez popratnog oštećenja membrane. Prikupljeni rezultati potvrdili su adepantine kao jako selektivne umjetne peptidne antibiotike.
Broj stranica: 145 Broj slika: 36 Broj tablica: 20
Broj literaturnih navoda: 97 + 15 Broj priloga: 8
Jezik izvornika: Engleski
Rad je pohranjen u: Nacionalnoj sveučilišnoj knjižnici u Zagrebu, Sveučilišnoj knjižnici u Splitu, Knjižnici Prirodoslovno – matematičkog fakulteta (PMF) Sveučilišta u Splitu.
Ključne riječi: antimikrobni peptidi, računalni dizajn, indeks selektivnosti, adepantini, peptidi u strukturi
uzvojnice,Escherichia coli,permeabilizacija membrane, niska toksičnost, anura. Mentori: prof.dr.sc. Davor Juretić, redoviti profesor, PMF, Sveučilište u Splitu
prof.dr.sc. Alessandro Tossi, izvanredni professor, University of Trieste Ocjenjivači: prof.dr.sc. Jasna Puizina, izvanredni profesor, PMF, Sveučilište u Splitu
dr.sc. Bono Lučić, viši znanstveni suradnik, Institut Ruđer Bošković, Zagreb dr.sc. Stjepan Orhanović, docent, PMF, Sveučilište u Splitu
University of Split
Faculty of Science Ph.D. thesis
DESIGN AND TESTING OF ADEPANTINS – FUNCTIONAL ARTIFICIAL ANTIBIOTICS Nada Ilić
Thesis performed at: Faculty of Science, University of Split Department of life sciences, University of Trieste
Abstract
As an important part of the innate immune system of all organisms, antimicrobial peptides, are considered as a possible solution for fighting bacteria resistant to standard antibiotics. Crucial characteristic of peptide antibiotic, as drug candidate is its high selectivity, parameterized as the ratio of concentration causing 50% haemolysis (HC50) against erythrocytes and the minimal inhibitory
concentration (MIC) against the reference bacterium Escherichia coli. Using the “Designer” algorithm adepantins were designed - highly selective artificial glycine and lysine rich peptides in predominant
helical conformation, having less than 50% homology of primary sequence to any known sequence of antimicrobial peptides. The algoritham used our database of anuran antimicrobial peptides with known selectivity index.
Structure and activity of adepantins were experimentally and computationally tested in their monomeric, dimeric and fluorescently labelled form. Experimental investigations performed on different bacteria strains showed high selectivity of adepantins for Gram-negative bacteria (MIC = 0.5 - 4 µM), especially E. coli. In membrane permeabilization measurements, different membrane models were used and adepantins showed rapid permeabilization of both membranes ofE. coli. These tests provided insight in their mode of action. All monomeric adepantins have exceptionally low haemolytic activity, while dimers expressed certain toxicity against host cells. It is proven that adepantins bind efficiently to the cell surface of the host cell membranes without subsequent membrane damage. Gathered results confirmed that adepantins are indeed highly selective artificial peptide antibiotics.
Number of pages: 145 Number of figures: 36 Number of tables: 20
Number of references: 97 + 15 Number of appendices: 8 Original in: English
Thesis deposited at The National and University Library in Zagreb, Croatia, University Library in Split, Croatia, Library of Faculty of Science of the University of Split, Croatia.
Keywords: antimicrobial peptides,computational design, selectivity index, adepantins, helical peptides,
Escherichia coli, membrane permeabilization, low toxicity, anuran
Supervisors: Prof.Dr. Davor Juretić, full profesor, Faculty of Science, University of Split, Croatia Prof.Dr. Alessandro Tossi, associate professor, University of Trieste, Italy
Reviewers: Prof.Dr. Jasna Puizina, associate professor, Faculty of Science, University of Split, Croatia Dr. Bono Lučić, higher research associate, Ruđer Bošković Institute, Zagreb, Croatia
Doc.Dr. Stjepan Orhanović, assistant profesor, Faculty of Science, University of Split, Croatia Thesis accepted: 12. 06. 2013.
Odjel za fiziku, Poslijediplomski sveučilišni doktorski studij Biofizika
“Dizajn i testiranje adepantina – novih peptidnih antibiotika”
Doktorski rad autorice Nade Ilić kao dio obaveza potrebnih da se dobije doktorat znanosti _______________________ godine.
Dobiveni akademski naziv i stupanj: doktorica prirodnih znanosti iz polja kemije. Povjerenstvo u sastavu:
1. prof.dr.sc Jasna Puizina, predsjednik 2. prof.dr.sc. Davor juretić, mentor 3. prof.dr.sc. Alessandro Tossi, komentor 4. dr.sc. Bono Lučić, član
5. doc.dr.sc. Stjepan Orhanović, član
prihvatilo je izrađeni doktorski rad dana ____________________________.
Obrana disertacije održati će se ____________________________.
Predsjednik povjerenstva: ________________________ prof.dr.sc Jasna Puizina Voditelja studija: ________________________ prof.dr.sc. Davor Juretić Predsjednik vijeća studija: ________________________ prof.dr.sc. Vlasta Bonačić-Koutecky
Odjel za fiziku, Poslijediplomski sveučilišni doktorski studij Biofizika Povjerenstvo za obranu doktorskog rada u sastavu:
1. prof.dr.sc Jasna Puizina, predsjednik ______________________________
2. prof.dr.sc. Davor juretić, mentor ______________________________
3. prof.dr.sc. Alessandro Tossi, komentor ______________________________
4. dr.sc. Bono Lučić, član ______________________________
5. doc.dr.sc. Stjepan Orhanović, član ______________________________
Potvrđuje da je disertacija obranjena dana 12. srpnja 2013. godine.
Dekan _____________________ prof.dr.sc Marko Rosić
Table of Contents ...I List of Figures...III List of Tables... VII List of appendices... IX List of abbreviations ... X List of bacteria used ... XI
1. Introduction...1
1.1. Antimicrobial peptides – basic information ... 1
1.1.1. Hydrophobicity and hydrophobic moment... 3
1.1.2. AMP mode of action... 4
1.2. New approaches in AMP research – databases and algorithms construction... 6
1.3. About the thesis ... 8
1.4. Hypothesis and goals of the thesis... 8
2. Materials and methods ...11
2.1. Construction of an AMP activity database (AMPad) and relevant algorithms ... 11
2.1.1. The AMPad database... 11
2.1.2. Sets of peptides from the AMPad database... 11
2.1.3. „PredictorSelector“ algorithm... 12
2.1.4. „Designer“ algorithm... 14
2.2. SPPS (solid phase peptide synthesis) of designed peptides... 15
2.2.1. Selection of peptides for synthesis... 15
2.2.2. Synthesis difficulty prediction ... 16
2.2.3. Solid phase synthesis... 16
2.2.4. Cleavage and workup ... 18
2.3. Peptide characterization and purification... 19
2.3.1. ESI-MS (electro spray ionization mass spectrometry)... 20
2.3.2. RP - HPLC ... 22
2.3.3. Peptide modification (acetamidation, dimerization, bodipylation)... 22
2.3.3.1. Blocking of cysteine by iodoacetamidation... 22
2.3.3.2. Covalent dimerization ... 24
2.3.3.3. Bodipylation - Fluorescent labelling with BODIPY maleimide... 25
2.4.1. CD spectroscopy in different solvents... 30
2.4.2. Preparation and use of liposomes... 31
2.5. Antimicrobial activity assays ... 33
2.5.1. MIC assays ... 33
2.5.2. MBC assays... 35
2.5.3. Effect of AMPs on bacterial growth kinetics and IC50... 36
2.5.4. Barrier effect of outer membrane – permeabilization kinetics ... 37
2.6. Bacterial membrane permeabilization assays... 38
2.6.1. Spectroscopic analysis of permeabilization to chromogenic substrates ... 39
2.6.2. Flow cytometric analysis of permeabilization to PI... 40
2.7. Interaction of peptides with host cells... 41
2.7.1. Haemolysis assay... 41
2.7.2. Flow cytometric analysis of cellular AMP uptake... 43
3. Results ...45
3.1. Peptide sets derived from the AMPad database... 45
3.2. From designed to synthesized peptides... 54
3.3. High yields and purity of the adepantins and modified analogues... 57
3.4. Confirmed secondary structure... 62
3.5. Effects of adepantins on bacterial cells... 67
3.6. Effects of adepantins on host cells... 75
4. Discussion...81
5. Conclusion ...85
6. References (alphabetical order)...87
6.1. Web link references (in order of appearance) ... 95
CV and list of publications...97
Abstracts ...99
Acknowledgements...101
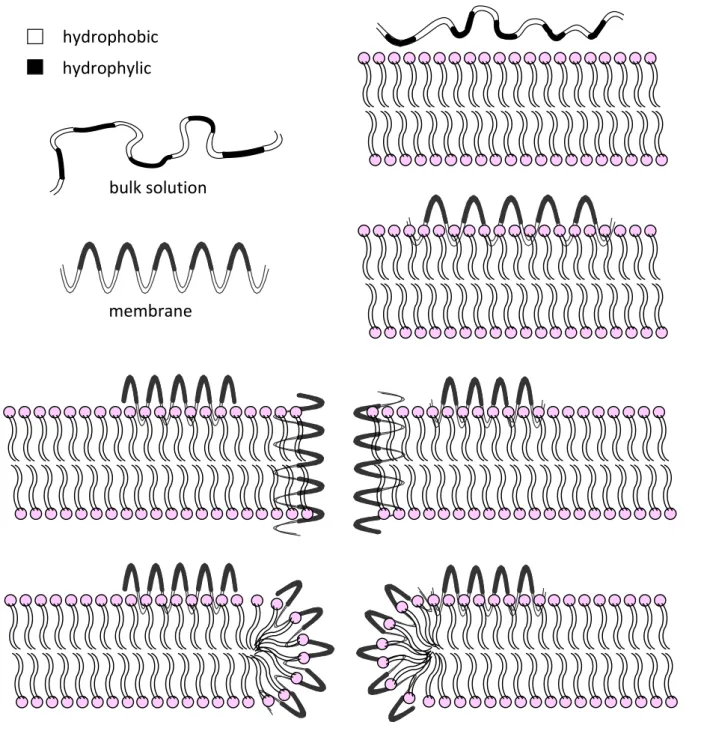
Figure 1. Helical AMP interaction with biological membranes; in bulk solution peptides are random coil, while in the presence of membrane they structure as amphipathic
helices; the peptides’ subsequent insertion into the membrane is then more
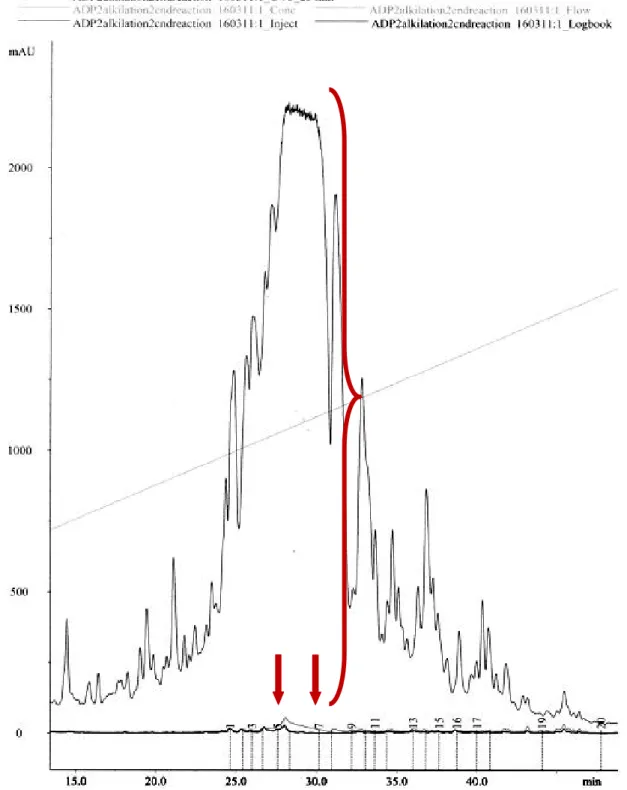
likely to result in toroidal pore formation than in a classical barrel-stave pore...5 Figure 2. Example preparative HPLC chromatogram for ADP2(AM) peak showing fractions
expected to contain pure targeted peptide, in this case fractions 5 - 7; X axes – time in minutes, Y axes – absorbance inmAU(milli absorbance units). ...21 Figure 3. Adepantins 2 and 3 in amidated form; cysteine on C-terminus is blocked. AA
coloured in red represent difference from the ADP1 sequence. Note that by amidating the C-terminus, a negative charge is removed, so that the overall charge increases by +1. ...23 Figure 4. Adepantins 2 and 3 in dimerised form, connections achieved with disulphide
bridge between cysteines on C-terminus. AA coloured in red represent difference from the ADP1 sequence...25 Figure 5. Adepantins 2 and 3 labelled with BODIPY maleimide on cysteines at the
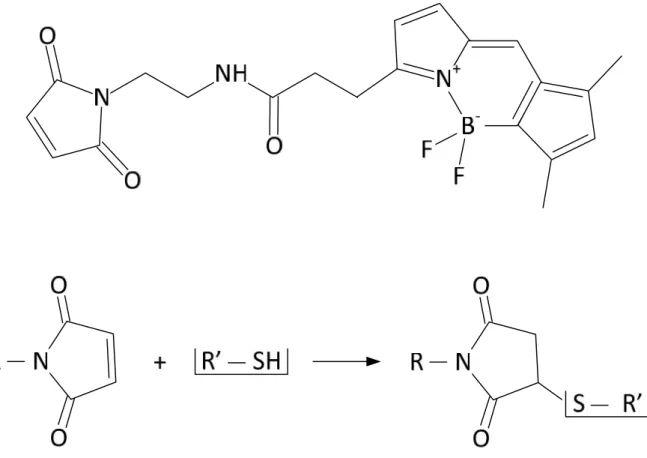
C-terminus. AA coloured in red represent difference from the ADP1 sequence...26 Figure 6. BODIPY molecule and its reaction with SH group in the Cysteine side chain. ...27 Figure 7. Scheme for vesicles in different sizes; MLV = multi lamellar vesicles are large
“onion-like” structures, SUV = small unilamellar vesicle, 15-30nm in diameter, unstable and tending to fuse spontaneously at temperatures below phase transition temperature; LUV = large unilamellar vesicles, 100-200nmor larger in diameter, stable on storage. ...31 Figure 8. Scheme of mini-extruder (Avanti Polar Lipids, Alabaster, AL) (as in Web link [13]) ...33 Figure 9. Lipopolysaccharide (LPS) structure inE. coliwith genes involved in its synthesis; *
predicted activity of thewaaPgene product (as in Yethon and Whitfield, 2001)...38 Figure 10. Propidium iodide (IP) molecule (as in Web link [14])...40 Figure 11. Relationship between peptide length and number of peptide entries in the whole
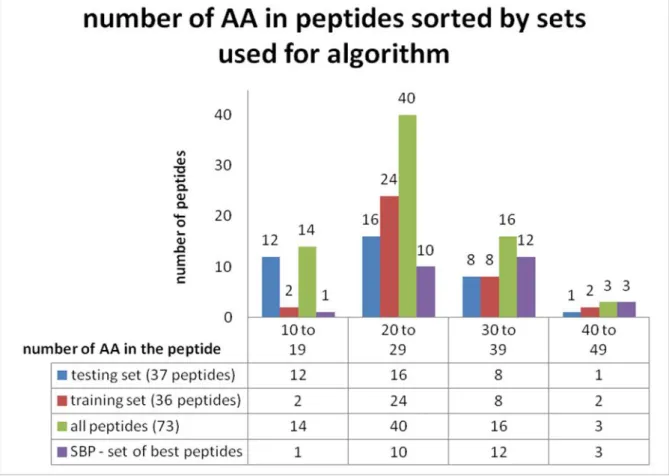
AMPad database, “training” and “testing” sets and “set of the best peptides” (SBP). ...47 Figure 12. Distribution of the peptides in the AMPad database divided in three sets
considering peptide length by number of AA and experimental TI value; SBP („set of the best peptides“) constructed from peptides included in both sets that have TI greater than 20...48 Figure 13. Example of the results given by Virginia university helical wheel application (Web
link [1]) and HydroMCalc tool (Web link [8]); Aschapin1 was used for experimental testing, as very selective antimicrobial peptide. Separation between hydrophilic and hydrophobic AA is clearly visible...52
Janin’s (Janin 1979) scale and blue for Guy’s (Guy 1985) scale; sum of the small vectors result in sequence moments presented by the large vectors; angle between sequence moments is used to calculate D-descriptor as the cosine of
that angle...53
Figure 15. Cladogram tree from Clustal W tool showing sequence alignment of 7 resulting peptides from the „Designer“ algorithm; Seq4 was later called adepantin 2 and is most similar to adepantin 1; Seq1 later called adepantin 3 and is most different from adepantin 1...55
Figure 16. Prediction of the synthesis difficulty for ADP1 by Peptide companion tool. Most AA are between upper two lines indicating difficult synthesis...56
Figure 17. ESI-MS analysis of adepantins, A) ADP2, B) ADP3...58
Figure 18. ESI-MS molecular weight analysis of A) ADP2(AM) and B) ADP3(AM) ...59
Figure 19. ESI-MS molecular weight analysis of A) [ADP2]2and B) [ADP3]2...60
Figure 20. ESI-MS molecular weight analysis of A) ADP2(BY) and B) ADP3(BY). Graphs contain two peaks where lower peek represents correct one for bodipylated peptide while higher one is a “shadow peak” that can often be noticed during MS analysis of fluorescently labelled peptides possibly due to loss of one fluorine under ESI conditions...61
Figure 21. CD spectra of ADPs (20 M of peptide) measured in A) H2O and B) sodium phosphate buffered (SPB, 10 mM); ADP1(); ADP2(AM) ( ); [ADP2]2 (); ADP2(BY) (---); ADP3(AM) ( - - -); [ADP3]2(); ADP3(BY) ()...63
Figure 22. CD spectra of ADPs (20Mof peptide chain) measured in A) phosphate buffered saline (PBS, pH7.4), B) 50% trifluoroethanol (TFE) and C) 50% isopropanol (iPrOH); ADP1(); ADP2(AM) ( ); [ADP2]2 (); ADP3(AM) ( - - -); [ADP3]2()...63
Figure 23. Helix % with increasing TFE; ADP1 ; ADP2(AM) ; [ADP2]2 : ADP3(AM); [ADP3]2. ...65
Figure 24. CD spectra of ADPs (20 M of peptide chain) measured in A) 1:1 phosphatidylglicerol/ diphosphatidtylglicerol LUVs in PBS (PG/dPG) and B) 2:2:1 phosphatidylcholine/ sphingomyelin/cholesterol LUVs in PBS (PC/SM/Ch); ADP1(); ADP2(AM) ( ); [ADP2]2 (); ADP3(AM) ( - - -); [ADP3]2 ()...67
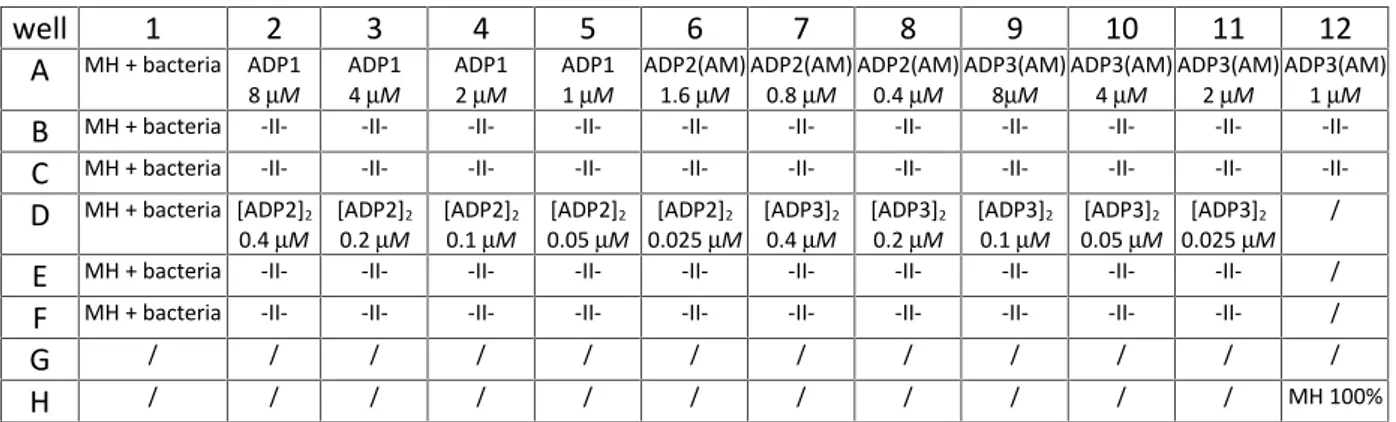
Figure 25. Example of MIC results for E. coli all ADPs; rows: ADP1, ADP2(AM), [ADP2]2, ADP2(BY), ADP3(AM), [ADP3]2, ADP3(BY), empty; columns: 1st– 11th peptide + bacteria + MH starting with concentration 128µM and decreasing by two-fold dilution method, 12th negative control = bacteria + MH; white dots on the bottom of the well is grown bacteria...68 Figure 26. Example of MIC results for S. aureusall ADPs; rows: ADP1, ADP2(AM), [ADP2]2,
bottom of the well is grown bacteria...69 Figure 27. A) Curves from data collected after growth kinetics for E. coli monomers at
concentration 1 M and dimers at concentration 0.5 M; B) inhibition percentage at 210 min extracted from growth curves; Bacteria control (); adepantins ADP1 (, ); ADP2(AM) ( , ); ADP3(AM) (- - -,
); [ADP2]2(,); [ADP3]2(,)...70
Figure 28. Effect of A) ADP2(AM) and B) [ADP2]2 on growth kinetics of E. coli (1), P. aeruginosa (2), K. pneumoniae (3) and S. typhimurium (4), experiments were done three times in triplicates. ...71 Figure 29. Effect of ASC1, PSEU2 and ADP1 on growth kinetics of E. coli; PSEU2 ;
ASC1; ADP1; mean of two experiments performed in triplicates (Juretić et al., 2009)...72 Figure 30. Growth kinetics of A) E. coliBW 25113 strain and B)E. coliBW 25113 waaP
strain affected by adepantins (ADP1; ADP2(AM); [ADP2]2;
ADP3(AM); [ADP3]2). ...73
Figure 31. Permeabilization of the inner and outer membrane ofE. coliML-35 pYC by ADPs determined by following the hydrolysis of the impermeant chromogenic substrate A) Gal-ONp by a cytoplasmic -galactosidase and B) CENTA® by the
periplasmic enzyme-lactamase respectively (no peptide; ADP1; ADP2(AM); [ADP2]2; ADP3(AM); [ADP3]2)...74
Figure 32. Permeabilization ofE. coliATCC 25922 (106cells/ml) inner membrane caused by
ADPs (0.25 M) and determined by % of PI-positive bacterial cells by flow cytometric analyses; (ADP1 ; ADP2(AM) ; [ADP2]2 ;
ADP2(BY); ADP3(AM); [ADP3]2; ADP3(BY)). ...75 Figure 33. Adepantin-induced haemolysis on 0.5% RBC; ADP1 ; ADP2(AM);
[ADP2]2 ; ADP3(AM) ; [ADP3]2 ; Results are from four
experiments carried out in triplicate...76 Figure 34. Pseudin and ascaphin-induced haemolysis on 0.5% RBC; PSEU2 ; PSEU2
A9 ; ASC1; ASC1 I2; Results are from two experiments carried out in triplicate...78 Figure 35. ADPs interaction with U937 cells, as measured by flow cytometry, presented on
monoparametric histograms; A) ADP2(BY) and B) ADP3(BY) demonstrates the effect after 5 minutes where the black line is control, the green line is peptide at concentration 0.1M and the red line is peptide at concentration 1M; C) ADP2(BY) and D) ADP3(BY) where empty curve is for U937 cells in the absence and filled curve in presence of ADPs (1M) while dashed line represents U937 cells with ADPs and the impermeant, extracellular quencher Trypan blue added...79 Figure 36. Fluorescence dot plots expressing results of monitoring fluorescence at 525 nm
Table 1. Resulting sequences (seq) of the „Designer“ algorithm with original restrictions; sequences are ordered as „Designer“ algorithm offered; adepantin 1 (ADP1), adepantin 2 (ADP2), adepantin 3 (ADP3); red letters represent amino acid (AA) residues that are different considering adepantin 1; the complete result with calculated parameters is presented in Table 9, on page 53...7 Table 2. Peptides and their variations used to test an early version of the „Mutator“
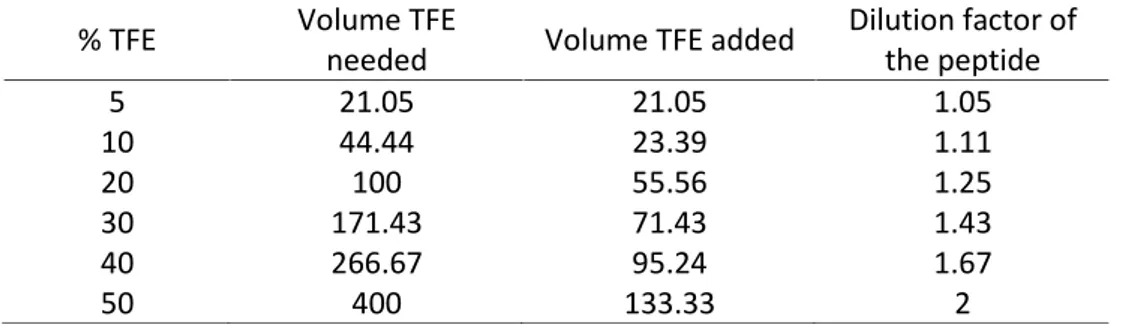
algorithm as well as to be referent peptides to the study of adepantins...8 Table 3. Cleavage mixtures for different types of peptides (Web link [11])...17 Table 4. Calculation for the volume of TFE to be added to the peptide in order to
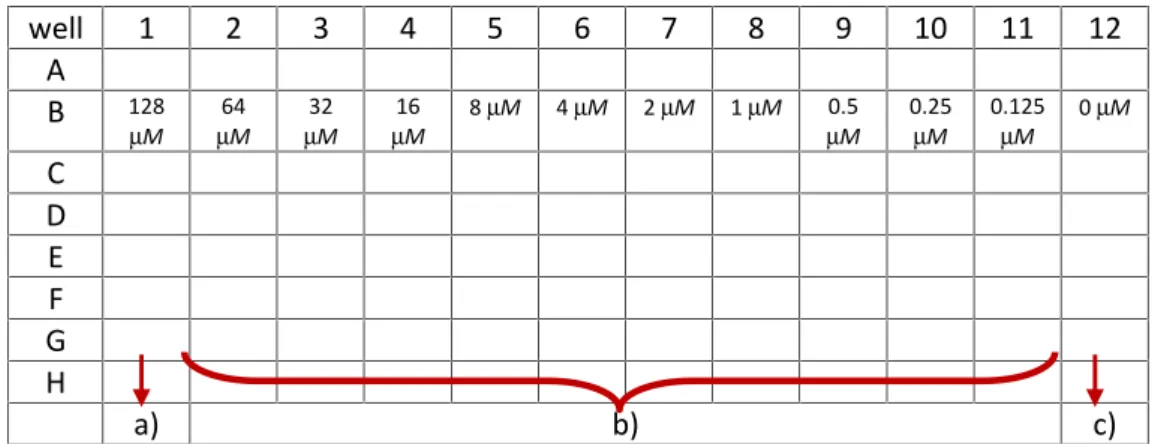
calculate percentage ofhelix. ...31 Table 5. Example of microtiter plate preparation for MIC assay; a) 100 l MH – xlof
peptide; b) 50lof MH where peptide was later added; c) 50lof MH without peptide that serves as a bacterial growth control; concentrations in B row represents final peptide concentration in those wells achieved by serial two-fold dilution. ...35 Table 6. Example of microtiter plate preparation for bacterial growth kinetic; First column
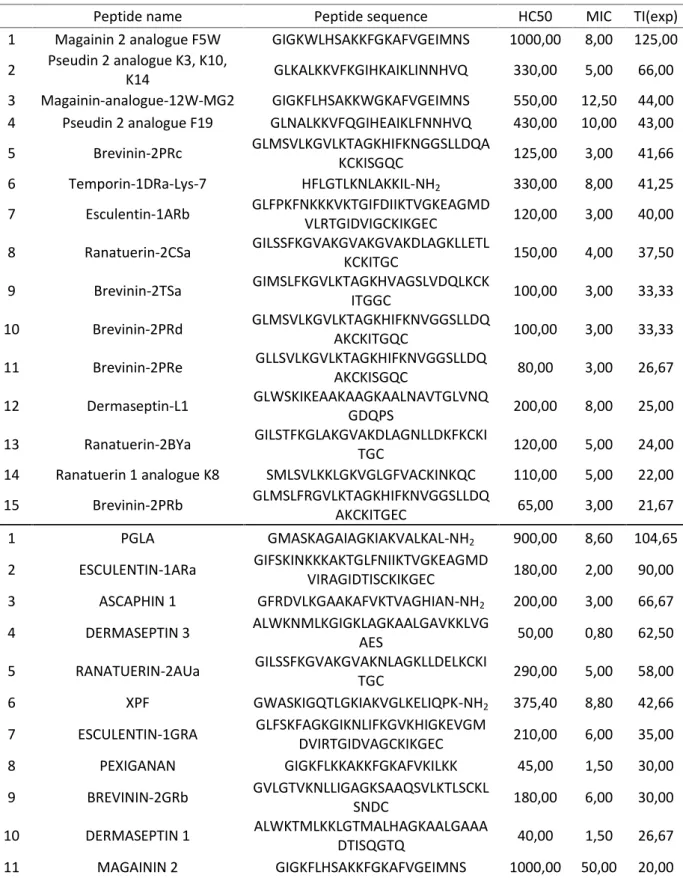
is negative control containing bacteria with medium without peptide; each peptide has 3-5 concentrations in triplicates; well 12H contains only 200l100 % MH as a blank to avoid any possible background noise...37 Table 7. “Set of the best peptides” (SBP) where the first 15 peptides are from the
“testing” set and the last 11 peptides from the “training” set, in both cases ordered by descending value of TI. ...46 Table 8. Three descriptors with the highest correlation found by „PredictorSelector“.
Although D-descriptor (in the second row) has slightly lower correlation than the first one, it was chosen because it is much simpler than the first one. For codes of the used scales see Appendix 5. Correlation is among descriptor values and experimentally determined TI values for peptides in the “training” set. ...50 Table 9. Output adepantin sequences from the „Designer“ algorithm...54 Table 10. Theoretical and measured yields of ADP2 and ADP3 with and without resin. ...57 Table 11. Theoretical and measured MW and yields of ADP1, unmodified ADP2 and ADP3,
ASC1 and ASC1 I2, PSEU2 and Pseu2 A9. ...58 Table 12. ADP2 and ADP3 modifications with its theoretical versus measured MW and
their yields; for ADP2(AM) and [ADP2]2 modification reaction was performed
twice, therefore, the yields are higher...59 Table 13. Mass concentration of peptides tested in the first set of tests. ...62 Table 14. Results of methods used for determining concentration of adepantins. ...62 Table 15. % helicity of ADPs in different environments according to the method of Reed
Dimerization was taken into account by normalising ellipticity per residue.(1)No
corrections for the presence of the BODIPY chromophore were made (% helicity shown in parentheses). ...66 Table 16. MIC values for adepantins, pseudins and ascaphins;(1)assays were carried out in
100% (v/v) MH broth using 5x10⁵cells/ml bacteria in the logarithmic phase; each
value is the mean of at least 3 independent determinations carried out in duplicate...68 Table 17. MBC (minimal bactericidal concentration), (1) Concentration resulting in no
bacterial growth, 2 independent determinations carried out in duplicate. ...70 Table 18. IC50 value of peptides; (1) Concentration resulting in 50% growth inhibition of
bacteria, calculated from data in figure (Figure 27)...71 Table 19. IC50value of ADP2(AM) and [ADP2]2measured for the following bacteria:E. coli,
P. aeruginosa,K. pneumoniaeandS. typhimurium;(1)Concentration resulting in a
50% growth inhibition of bacteria, calculated from data in figure (Figure 28)...72 Table 20. Haemolytic, MIC and TI values for tested peptides; Haemolytic activity tested for
peptides, expressed as HC50 value;(1)determined from Figure 33 and Figure 34;
MIC values from Table 16; TI value calculated from experimental data (TI calculated) and predicted one (TI predicted);(2)For ADP1, the first value is from
second set of tests together with other ADPs, while the second value is from the first set of tests when only ADP1 was tested along with PSEU2 and ASC1. (3)
Appendix 1. “Set of AMPad peptides” (SAP) that forms AMPad database...105
Appendix 2. Contribution to the sequent moment of each AA for Janin and Guy scale - ADP1...107
Appendix 3. Contribution to the sequent moment of each AA for Janin and Guy scale - ADP2...108
Appendix 4. Contribution to the sequent moment of each AA for Janin and Guy scale - ADP3...109
Appendix 5. Table of amino acid scales from Split 3.5 algorithm [7] used for finding D-descriptor ...110
Appendix 6. Preparative RP-HPLC spectra for ADP2(AC) (both synthesis), [ADP2]2 (both synthesis), ADP2(BY), ADP3(AC), [ADP3]2, ADP3(BY) ...115
Appendix 7. Analytical RP-HPLC for ADP1 (first testing name was DESC1) ADP2(AC), [ADP2]2, ADP2(BY), ADP3(AC), [ADP3]2, ADP3(BY), all graphs overlapped for comparison...123
Appendix 8. ESI - MS and Analytical RP-HPLC for ADP1 (first testing name was DESC1), PSEU2 (first testing name was PSEU2B), PSEU2 A9 (first testing name was PSEU2A), ASC1 (first testing name was ASC1B), ASC1 I2 (first testing name was ASC1A)...131
AA(s) – amino acid(s) ADP(s) – adepantin(s)
AMP(s) – antimicrobial peptide(s) Cfu – colony forming units /ml
Conc. or c. - concentration
HC50– concentration that causes 50% haemolysis of RBC MilliQH2O - ultrapure laboratory grade water
HPD(s) – host defence peptide(s)
IC50– half maximal inhibitory concentration (for bacterial growth)
LPS - Lipopolysaccharides
MLV - multi lamellar vesicles, large “onion-like” structures LUV - large, unilamellar vesicles
M – Mol (mM– milli mol;M– micro mol) MIC – minimal inhibitory concentration MW – molecular weight
OD – optical density
PG/dPG – Phosphatidylglicerol/Diphosphatidylglicerol PC/SM/Ch – Phosphatidylcholine/Sphingomyelin/Cholesterol Pbf – 2,2,4,6,7-pentamethyldihydrobenzofuran-5-sulfonyl RBC – red blood cells, erythrocytes
SPPS - solid phase peptide synthesis
SUV - small, unilamellar vesicles or sonicated, unilamellar vesicles TI - therapeutic index
Escherichia coli ATCC25922 BW2553 Waap-BW2553 ML-35pYC Staphylococcus aureus ATCC25923 Pseudomonas aeruginosa ATCC27853 Salmonella typhimurium ATCC14082 Klebsiella pneumoniae clinical isolate
1. Introduction
In the never ending battle against microbes, only recently has the ancient weapon been rediscovered. Antimicrobial peptides (AMPs) have existed in nature for millions of years and are still very functional in defending their producers against bacteria, fungi and viruses (Bullet et al., 2004; Yeaman and Yount, 2007). Natural antimicrobials are produced by unicellular and multicellular organisms to act directly on microbes or to profoundly modulate innate immune system response. In the case of direct action, the suggested term for this agents is “antimicrobial peptide”, while in the case of modulating or enhancing the host immune response to infectious agents, the term “host defence peptide” has been suggested (Fjell et al., 2012). Antibiotics in current use present a negative side effect: the explosion of the resistant bacteria that do not respond to any kind of antimicrobial treatment (Taubes, 2008; McKenna, 2011). Therefore, a new kind of antibiotics is desired. Antimicrobial peptides present one of the possible solutions showing promising results. Natural AMPs are however not sufficiently selective for direct use on humans. To improve this, most AMP alterations have been made according to experts’ experience or just plain guessing. Even so, the increase in antibacterial activity, measured as a reduction in MIC (minimal inhibitory concentration), has in most instances increased toxicity as well measured as an increase in HC50 (peptide concentration that causes 50% haemolysis of erythrocytes). This effect has discouraged the pharmaceutical industry, where the requirement for good drugs with low side effects and toxicity is of the utmost importance.
AMPs are interesting research material due to low probability for bacteria to gain resistance to them; they tend to be fairly selective in killing bacteria cells. They mantain this ability also against pathogens, multidrug resistant to conventional antibiotics, having a predominantly nonstereospecific mechanism of action against bacterial membranes (Hancock and Lehrer 1998; Glukhov et al., 2005; Marr et al., 2006). Due to these advantages of AMPs, many laboratories have engaged in AMP research over the past decades (Hancock and Sahl 2006; Bommarius and Kalman 2009; Zhang and Falla 2010). The growing amount of data available on several interesting characteristics of AMPs, has led to the necessity for constructing databases and computational tools for predicting novel and improving existing AMPs (Juretić et al., 2009; Juretić et al., 2011; Aoki et al., 2012; Hammami and Fliss 2010; Novković et al., 2012).
1.1.
Antimicrobial peptides – basic information
Our body uses several ways to defend itself against pathogens that are constantly attacking its integrity. An interesting and very efficient way of the body to protect itself is by using AMPs (antimicrobial peptides) and HDPs (host defence peptides). Both have extraordinary molecular diversity, differing in length from 12 to hundreds of AA residues and belonging to several structural classes.
HDPs are natural and endogenous, gene-encoded polypeptides and are widely distributed among all known kingdoms: animal, plant and bacteria. The fact that they are gene encoded connects their evolution with that of their microbial targets. This, and the fact that they are evolutionary very ancient components of the innate immune system of many species (Zasloff, 2002), has resulted in such molecular diversity. Some HDPs are active against eukaryotic micro- and macro-predators as well.
Unlike HDP notation, which is reserved for endogenous molecules of host defence, the term AMP is used to describe both natural and synthetic peptides showing antimicrobial activity. They therefore have even greater variety in their structure (Yeaman and Yount, 2003) but generally tend to be shorter in length than HDPs, consisting of 10 to approximately 46 AA. HDPs and natural ADPs not only differ widely in their primary structure within and among the different producer organism, but there is also a great diversity in their secondary structure. Those found so far are forming helices, sheets, hairpins, random coil or combine more than one of the mentioned structures. The most abundant and widespread in nature are probably those with a linear helical structure that appears to be particularly successful in defending their producing organism. These AMPs are invariably positively charged (+2 to +9), with the possibility to spatially organise cationic and hydrophobic amino acids (AA) on the opposite faces of the helix, a hydrophobic side and a polar side. This effect is nicely visible in an Edmundson or “helical wheel” projection (Schiffer and Edmundson 1967) (Web link [1]). This results in a transversal amphipathicity, and enables peptides to interact with both water and biological membranes. Change in the amphipathicity influences change in antimicrobial activity, but can increase toxicity towards mammalian cells with neutral membranes (Dathe and Wieprecht 1999). All those characteristics have placed
helical AMPs amongst the most studied antimicrobial peptides.
Possible modes of action AMPs use to defend the host organism are:
Disruption of the microbial membranes, which are negatively charged and selectively attract positively charged AMPs (primary antimicrobial mechanism).
Interaction with secondary targets in the cells by interrupting vital metabolic processes, when translocated in the cell.
Interference with external molecular targets on the microbial envelope and causing severe damage. Targets can be lipids involved in cell-wall synthesis and autolytic enzymes required for cellular division.
Creating pores in the cytoplasmic membrane without disrupting it, but provoking a decrease in the membrane potential, electrical field and proton-motive force, which in turn blocks the ATP synthesis.
Outside the membrane, in aqueous bulk solution, many AMPs are in random coil or extended conformation (Figure 1), while in the presence of phospholipid membrane or membrane mimetic solvent they tend to assume more regular structures. As AMPs are active when folded in their final secondary structure (Tam et al., 2001; Unger et al., 2001), the mode of action is also defined by the membrane that peptides interact with. Cells, depending on which organism they belong to, have differences in their membrane composition, but peptides interact with all of them on the basis of electrostatic interactions. AMPs selectivity is based on the difference between bacterial and mammalian cell membranes (Aoki et al., 2012). Bacterial cells have anionic character, depending on membrane components, and therefore attract cationic AMPs (Glukhov et al., 2005; Umeyama et al., 2006). Along with membrane phospholipids, in Gram-negative bacteria, important negative components of the surface are phosphate groups of membrane
lipopolysaccharides in the outer membrane, while in Gram-positive bacteria negative charges are contributed by lipoteichoic acids of the peptidoglycan. In mammalian cells negative charge of the membrane is not strongly expressed, and the membrane is additionally stabilized with an abundance of cholesterol reducing its susceptibility to AMPs (Matsuzaki et al., 1995). Negatively charged phospholipids are much more abundant at the external side of cytoplasmic membrane in bacteria than in human cells. This is one of the main reasons why peptides act differently on various membranes, and is also the fact researchers are trying to use in adjusting peptides for medical use.
The membrane electrochemical gradient is the result of unequal distribution of ions inside and outside the cell membrane. Unequal ion distribution creates transmembrane potential. Potential measured in bacterial cells is -130 to -150mV, while in mammalian cells it is -90 to -110 mV. This more highly negative transmembrane potential of bacterial membrane can drive cationic peptide in the cell through the membrane, reducing their concentration on the surface. The difference in membrane electrochemistry can contribute to selective toxicity of AMPs targeting microbial and avoiding human cells, which would be the perfect case. Considering differences of the membranes, it can be noticed that AMPs can be selective for bacterial with respect to eukaryotic cells, as well as selective for Gram-negative with respect to Gram-positive bacteria. Those variations can make AMPs potential drugs with specific targets in possible future medical use.
1.1.1. Hydrophobicity and hydrophobic moment
Beside conformation and charge, other functionally important AMP properties are hydrophobicity and hydrophobic moment.
Hydrophobicity (H) is the numerical value quantifying a dislike for water for each amino acid side-chain. There are more than 100 hydrophobicity scales in the literature differing in these values. Examples of the scales are Eisenberg consensus scale (Eissenberg at al. 1984), Tossi CCS scale (Tossi at al. 2002), Janin (Janin 1979) and Guy (Guy 1985) scale. The mean hydrophobicity (H) of the peptide is defined as the sum of hydrophobicity values of each AA averaged over the total length of the peptide. Percentage of hydrophobic AA in the peptide can also be defined as peptide hydrophobicity. For most AMPs approximately 50% are hydrophobic AA that makes them moderately hydrophobic but quite amphipathic and optimized against the membranes of the microbes (Yeaman and Yount 2003). A change in the percentage of hydrophobicity can lead to a change in their specificity, as well as a change in membrane permeabilization. The effect was tested on magainin2 and its analogues with slight changes in hydrophobicity (Wieprecht et al., 1997).
Hydrophobic moment (H) is a quantitative measure of amphipathicity (Eisenberg 1984). It is defined for each AA residue as a vector, starting from the symmetry axis of the helix and pointing towards C atom of the given AA residue, with the value of scalar hydrophobicity parameter of the same residue. Mean hydrophobic moment of the peptide is, then, the vectorial sum of the individual AA hydrophobicities, averaged over the helix length. In some cases, it can be normalized to an ideal, perfectly amphipathichelix.
1.1.2. AMP mode of action
Helical AMPs are likely to be membrane active if: they have about 50% hydrophobic AA residues in the primary structure, if they have a net positive charge deriving from at least 20% of charged AA in the sequence, and if they are amphipathic. Those characteristics enable peptides to come into initial contact with the targeted membrane. Once bound to the membrane, different AMPs have different modes of actions, but all are based on membrane permeabilization and passage through the membrane. To activate any of the processes, peptides need to reach threshold concentrations of the peptide, accumulated on the outer leaflet of the membrane that enables peptides to damage the membrane itself, following a conformational transition, and/or peptide aggregation. Peptide aggregation can lead to formation of the pores in the membrane, enabling molecular transfer in the damaged cell. Many AMPs act in this manner, as described by the Shai-Matsuzaki-Huang (SHM) model (Zasloff 2002).
In the pores, the hydrophobic part of the peptide faces and inserts itself into the membrane. The hydrophilic part initially faces the extracellular medium. After the pore is formed, it faces the centre of the pore. There are many models of peptide permeabilization through the membrane. This is the result of peptide diversity which leads to diversity in their mode of action (Epand and Vogel 1999). Until now there is no consensus on the exact mechanism, although three of them are most commonly used (Yeaman and Yount 2003, Shai 1999, Brogden 2005): barrel-stave, toroidal pore and carpet mechanism (Figure 1, carpet mechanism is not shown). The name of each mechanism is derived from the shape of the pore or type of lesion formed in the membrane.
Barrel-stave is formed when peptides (Oren and Shai 1998),helical orsheet, with threshold concentration, bridge the membrane perpendicularly in the form of the barrel like ring, while they are parallel among themselves. Toroidal pore or wormhole mechanism is the most accepted one. Peptides are interlaced with phospholipids in the form of a toroid through the whole pore (Figure 1), while the pores are slightly bigger than those of barrel-stave. In the carpet mechanism, peptides act as detergents while “carpeting” the outer membrane (Shai 1999, Epand and Vogel 1999, Brogden 2005). A particularity of this model is that peptides cover the membrane like a carpet, whether locally by self-association or by covering the whole membrane with monomers. Permeabilization starts with the threshold concentration of the peptide reached, disrupting membrane to peptide covered micelles.
bulk solution
membrane hydrophobic hydrophylic
Figure 1. Helical AMP interaction with biological membranes; in bulk solution peptides are random coil, while in the presence of membrane they structure as amphipathic helices; the peptides’ subsequent insertion into the membrane is then more likely to result in toroidal pore formation than in a classical barrel-stave pore.
Membrane penetration is not the only way AMPs can affect bacteria. There are several other mechanisms. One of the mechanisms is targeting intercellular components, similar to some classical antibiotics. Most of those mechanisms are based on inhibition, such as inhibition of: enzymatic activity, cell wall synthesis, nucleic acids or protein synthesis, but they also affect protein folding, key cellular processes, metabolic turnover (Nguyen et al., 2011).
1.2.
New approaches in AMP research – databases and algorithms
construction
The field studying AMPs is relatively new and constantly developing. In order to render peptide research easier and reduce the cost of further laboratory work it is convenient to develop databases and computational tools as knowledge-based methods. As every tool development in bioinformatics and data-mining, research starts with an extensive data collection. In fact, several databases have been created collecting thousands of AMP sequences, listed along with their characteristics (Hammami and Fliss 2010). Each database has a different number of peptides depending on what it was collected for. AMPad database (Juretić et al., 2009), has 73 AMPs of amphibian origin, withhelical structure, while DADP database (Web link [2]) created later has 2571 amphibian AMPs (Novković at al. 2012). On the other hand, AMSDb database (Web link [3]) has 895 eukaryotic antimicrobial peptides (Tossi and Sandri 2002). There are several other databases such as: CAMP (Thomas et al., 2010), APD (Wang et al., 2009) (Web link [4]), AMPer (Fjell et al., 2007), that all cover diverse origin AMP sequences. Most sequences represent common biophysical parameters such as molecular size, cationicity and amphipathicity, which can be essential for AMPs activities (Hammami and Fliss 2010). Those databases are later used for all types of research, including creation of computational tools for AMP design, prediction or predicting certain parameters relevant for peptides activity, like TI. So far, several algorithms have been developed from the AMPad database: “PredictorSelector”, „Designer“ (Juretić at al. 2009) and „Mutator“ (Kamech et al., 2012).
Peptides, which are the main subject of this thesis, are artificial AMPs proposed by „Designer“ algorithm, named adepantins (ADPs) from Automatically Designed Peptide
AntibioticNumber 1, 2 and 3. The algorithm was created using a collected set of 73 peptides (described in 2.1 and 3.1) effective against Escherichia coli, extracted from anurans (mainly frogs) and that have preference for helix conformation in hydrophobic environment. The constructed database was named AMPad (Juretić et al., 2009) and it lists peptide name, sequence, MIC and HC50 value expressed in M, and therapeutic index (TI) value for each peptide. The TI is a ratio of HC50and MIC, and it represents the measure of selectivity of the peptide.
TI= HC50/MIC (1)
where TI is therapeutic index representing selectivity, HC50 is peptide concentration causing 50% of haemolysis of red blood cells, and MIC is minimal inhibitory concentration.
From the AMPad database, three sets were formed: the „training“ set, the „testing“ set and the „set of the best peptides“ (SBP) (described in 2.1 and 3.1). The „training“ set consists of 36 non-homologous peptides with less than 70% pairwise identity, „testing“ set consists of the remaining 37 peptides, while SBP contains all peptides from AMPad database with TI > 20. Non-homologous peptides were chosen for the „training“ set with the intention of using data-mining procedures for extracting general rules for highly selective AMPs with measured TI. The concept of sequence moments (constructed by Prof. Davor Juretić) facilitated the data-mining-procedure and the selection of optimal parameters for TI prediction by using the „PredictorSelector“ algorithm (constructed by Prof. Damir Vukičević).
Sequence moments were presented as vector summation of chosen set of amino acid attributes for a peptide sequence bent into right angle arc of 90° (Juretić et al., 2009.). The cosine of the angle between sequence moments is called D-descriptor and it leads to the predicted TI value by using linear one-parameter model expressed with the equation TI = 50.126 – 44.803D. Hydrophobicity values used to calculate sequence moments are associated with the scales of Guy (Guy 1985) and Janin (Janin 1979) (see Figure 14, str. 53, Appendix 2, Appendix 3, Appendix 4). The maximal predicted TI value in this model is 95, while the measured value for the same peptide can be significantly higher. When constructed, the „Designer“ algorithm contained certain restrictions. By selecting a certain range of mean physicochemical parameters, a peptide length of 23 AA, net positive charge of 4 or 5 and TI > 85, such restrictions were enforced to reduce the number of proposed peptides. The algorithm then proposed 7 peptides (Table 1) (see in 2.1.4, 3.2).
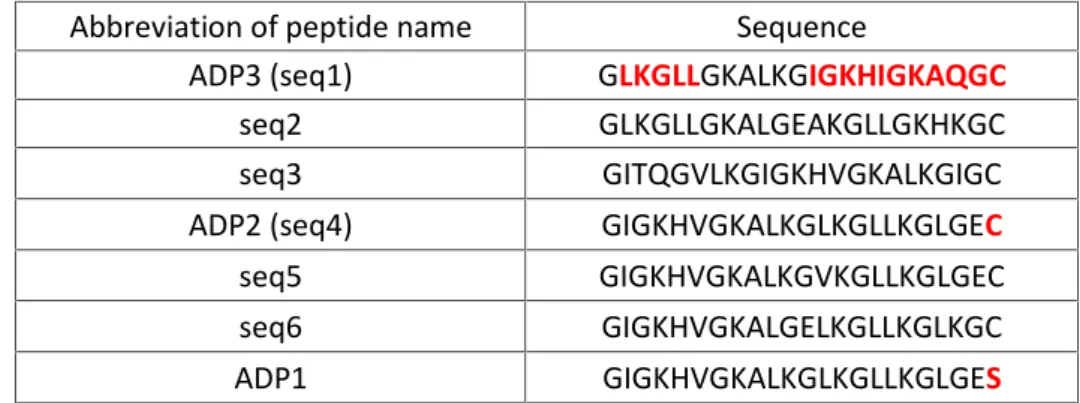
Table 1. Resulting sequences (seq) of the „Designer“ algorithm with original restrictions; sequences are ordered as „Designer“ algorithm offered; adepantin 1 (ADP1), adepantin 2 (ADP2), adepantin 3 (ADP3); red letters represent amino acid (AA) residues that are different considering adepantin 1; the complete result with calculated parameters is presented in Table 9, on page 54.
Abbreviation of peptide name Sequence
ADP3 (seq1) GLKGLLGKALKGIGKHIGKAQGC
seq2 GLKGLLGKALGEAKGLLGKHKGC
seq3 GITQGVLKGIGKHVGKALKGIGC
ADP2 (seq4) GIGKHVGKALKGLKGLLKGLGEC
seq5 GIGKHVGKALKGVKGLLKGLGEC
seq6 GIGKHVGKALGELKGLLKGLKGC
ADP1 GIGKHVGKALKGLKGLLKGLGES
Adepantin 1 was the first AMP from this group of 7 to be tested (see 2.2.1 and 3.1). It is the only AMP from the proposed group that ends with S (Serine) at the C-terminus. All others end with C (Cysteine) AA which has a reactive sulphydryl group. That reactivity, in the following experimental tests, was used to label the peptides with fluorescent label and to construct adepantin dimers. In the case of adepantin monomers with C-terminal Cys the cysteine was blocked by iodoacetamidation. From the same series of ADPs two additional peptides, the most similar one (ADP2) and one with highest molecular diversity to ADP 1 (ADP3), were chosen to undergo further testing.
The „Mutator“ algorithm is a bioinformatical tool, designed by prof. Damir Vukičević with the help of Prof. Davor Juretić, to improve AMPs by suggesting possible point mutations one by one, with constant increase of the peptides’ TI value. Recently, it was improved and tested (Kamech et al., 2012). Its construction began in the same time as development of the „Designer“ and the „Predictor“ algorithm. Preliminary laboratory experiments on two peptides were done to prove the results in the early stage of the algorithm development. Since this algorithm was still under construction, the chosen peptides were not only supposed to test early „Mutator“ algorithm but, more importantly, to serve as referent peptides in the adepantin testing study. In the end, one good and one mediocre antimicrobial peptide, considering their TI values, were selected. They were synthesized along with their versions with one point mutations proposed by the preliminary version of the „Mutator“ algorithm (Table 2).
Table 2. Peptides and their variations used to test an early version of the „Mutator“ algorithm as well as to be referent peptides to the study of adepantins.
Peptide name abbreviation sequence
Ascaphin 1 ASC1 GFRDVLKGAAKAFVKTVAGHIAN
Ascaphin 1 I2 ASC1 I2 GIRDVLKGAAKAFVKTVAGHIAN
Pseudin 2 PSEU2 GLNALKKVFQGIHEAIKLINNHVQ
Pseudin 2 A9 PSEU2 A9 GLNALKKVAQGIHEAIKLINNHVQ
The results gathered in the first tests of the „Mutator“ algorithm confirmed improvements in peptides TI. However, improvements were not significant enough to exclude human error while performing tests. Therefore, „Mutator“ algorithm was left for further development. The results were recently published in (Kamech et al., 2012), and the algorithm can be tested at corresponding Web address (Web link [5]). Acsaphin 1 and pseudin 2 were left as referent peptides in the first sets of experiments on adepantins, more precisely, by testing of adepantin 1 (Juretić et al., 2009).
1.3.
About the thesis
In the methods and results of the thesis the whole process will be described, from data gathering to the collecting of the results after adepantins are tested. The description will follow all steps of the process, although some parts of it were not done by me. Firstly, the database construction will be described, which is the part I participated in. The next step is its division into desired sets of peptides adapted for further managing (also mainly my part of the work), and will be described as the next step of the work. This will be followed by the algorithms construction process, which was the part of the work performed by Prof. Davor Juretić and Prof. Damir Vukičević, and will be described as the relevant part of the process on how adepantins were constructed. In the following paragraph, there will be a presentation of why we chose adepantin 1, 2 and 3 for the testing, as well as what peptides we took as referent ones and why. At this point, I must point out that laboratory testing of the peptides were performed in two set of assays, one where ADP1 and referent peptides were used, and the second where ADP1 was the referent peptide while ADP2 and 3 were under testing. In subsequent paragraphs, all laboratory experiments carried out by me during this process will follow a logical order, starting from synthesis, purification, modification and characterization, through quantification and structural analysis. Antimicrobial activity and bacterial membrane permeabilization assays will show how ADPs react when in contact with bacterial strains of interest. To be able to determine selectivity of ADPs, their interaction with host cells was tested. In the discussion part of the thesis results will be discussed and some future prospective will be given. Thesis will end with the conclusion.
1.4.
Hypothesis and goals of the thesis
The lack of sophisticated methods capable of improving natural and known AMPs initiated the idea for constructing algorithms that could assist laboratory work by performing in-silico peptide design. One of the algorithms constructed was named “Designer”, a software created by prof. Damir Vukičević with the sequence moment concept at its core, which suggests the primary structures of novel AMPs. „Designer“ algorithm proposed AMPs
named adepantins (ADP) (Automatically Designed Peptide Antibiotic Number 1, 2 and 3). Their subsequent experimental testing was the main objective of this thesis.
The main hypothesis of the thesis was that adepantins should be highly selective for Gram-negative bacteria and have very low haemolytic activity. This was substantially proved, except for modifications (dimerization) that resulted in an interesting increase in toxicity (a sort of exception that proves the rule).
In order to confirm this hypothesis several more specific factors were addressed:
ADPs are predicted to be alpha helical peptides (proved).
ADPs were designed to have high selectivity against Escherichia coli, against which „Designer“ parameters are trained, but not necessarily against other Gram-negative bacteria or the Gram-positiveStaphylococcus aureus(proved).
ADPs are expected to have high HC50 values (50% haemolysis of erythrocytes), resulting in low haemolytic activity (proved).
ADPs should permeabilize both the inner and outer membrane ofE. coli(proved).
Dimerization might improve ADPs antimicrobial activity due to double alpha helix and therefore improve selectivity (proved to be true for antimicrobial activity but not for selectivity).
Fluorescently labelled ADPs should help reveal the mode of action (partly proved). To confirm the hypothesis made, two kinds of methods were used. The first set was mainly theoretical, required in constructing the algorithm, while the second set of methods represents the major part of the thesis, and was mainly experimental.
The goals of the work described in the thesis were thus:
Construction of a new database consisting of antimicrobial peptides with certain characteristics addressing data collected for AMPs againstE. coli(participating in the process of collecting, verifying and sorting data).
Dividing the gathered database in „training“ and „testing“ sets, and an additional “set of the best peptides” (SBP), consisting of the peptides with TI > 20 from both sets.
Prediction of at least one peptide with the required characteristics that was later called adepantin 1 (ADP1) (participating in the process).
Testing hypothesis about ADPs presented above.
Collected data that can later be included into another database for possible construction of additional bioinformatical tools.
The accomplishment of the first and the second goal enabled the construction of three new bioinformatical tools named “PredictorSelector”, „Designer” and “Predictor”. The
main contribution in creating these tools came from Prof. Dr. Davor Juretić and Prof. Dr. Damir Vukičević. The tools were later used to accomplish the third and the fourth goal.
2. Materials and methods
2.1.
Construction of an AMP activity database (AMPad) and relevant
algorithms
2.1.1. The AMPad database
To be able to create any software for AMP construction, the crucial step was to create a proper and representative database of natural AMPs with the data we considered useful at that time. The data were values for the minimal inhibitory concentration (MIC) and for 50% haemolysis of human red blood cells (HC50). The values have been chosen as those which represent AMP selectivity through the Therapeutic index (TI). In a recent article (Ilić et al., 2013), the TI index was renamed selectivity index (SI) as the same group of scientists suggested in their earlier works (Juretić et al., 2009; Juretić et al., 2011). The TI index is given by expression (1).
The search for required data throughout the literature consisted mostly of scanning the PubMed application (Web link [6]) using their search tool. The keywords applied to the search tool were: antimicrobial, peptides, AMP, peptide antibiotics, MIC, HC50, selectivity, amphibian, anuran, frog, TI or therapeutic index, α helix, helical, and different combinations of these. At that time, the PubMed search tool proposed a limited number of articles containing required data. Research results on AMPs, aldough abundant, were not published with the type and amount of data we required for forming a big AMP database with data of interest. Later, our group constructed a large database named DADP: the database of anuran defence peptides (Novković et al., 2012).
Peptides considered for the entry into the AMPad database were of amphibian origin and had propensity to form α helix in membrane mimetic solvent (predicted and/or experimentally verified propensity). Furthermore, only data representing MIC and HC50 values, expressed in µM, measured by performing the same type of assay with the same concentrations of the target cells, were extracted and listed in the database. MIC values used had to be determined by the serial dilution method. Furthermore, if values for several E. colistrains were present, the value for the most sensitive strain was selected. A criterium for selecting HC50 values was that they had to be measured with fresh human blood from healthy donors. Also, articles not containing all the required data for the same peptide were omitted, as well as articles containing data for peptides for which the same data were measured later. Artificial peptides or peptides with more than two point mutations were also excluded from the database.
2.1.2. Sets of peptides from the AMPad database
To be able to construct any kind of bioinformatical tool we needed a minimum of two sets of peptides with certain characteristics. AMPad database is a relatively small database with only 73 AMPs, which was divided into „training“ and „testing“ sets. For that purpose, bioinformatical multiple alignment tool Clustal V (version used in 2008) was used. Database was divided by the rule that the „training“ set must consist of nonhomologous peptides with less than 70% pairwise identity. This was a necessary criterium for extracting rules as general as possible. All other peptides formed the „testing“ set. The „training“ set than was
subjected to various analyses in order to extract rules and logic needed for software construction. (Appendix 1; Juretić et al., 2009).
An additional set of peptides was required for algorithm construction. In order to construct an algorithm able to offer good and selective antibiotics, a set of the best AMPs from the AMPad database needed to be extracted. For that purpose, all peptides in the AMPad database were sorted by decreasing TI value, and then all peptides with TI values greater than 20 were extracted to form a set called the „set of best peptides“ (SPB). TI value 20 was chosen to be the threshold, because in literature AMPs with TI ≥ 20 are still considered to be good antibiotics as well as selective ones (Juretić et al., 2009).
AMPs not listed as α helical in the original article were examined by using SPLIT algorithm version 3.5 (Juretić et al., 1998) (Web link [7]). For all peptides also the distribution of the polar/hydrophilic and nonpolar/hydrophobic amino acids (AA) was observed either by using the Virginia university helical wheel application (Web link [1]) or HydroMCalc tool (Web link [8]).
2.1.3. „PredictorSelector“ algorithm
Peptides, in the primary structure, are represented as a sequence of AA. Each of those AA has certain characteristics expressed as position-dependent attributes, presented mostly as smoothed values. All AA attributes are presented as two-dimensional plots for sequence profiles. Such a profile is for example the Kyte-Doolittle hydrophobicity profile (Kyte and Doolitle 1982). For the „Designer“ algorithm construction, the whole sequence profile for the chosen set of AA attributes is converted into one vector with two components, named sequence moment. That was possible by summation of all vectors representing AA attributes in chosen sequence, when the sequence was bent into right angle arc. The „PredictorSelector“ found the best descriptors when sequence was bent in the first quadrant of coordinate system. N-terminal of the peptide is located then at the positive y-axes, while the C-terminal is located on positive x-axes (Figure 14, page 53). AA attributes vectors are defined in length and orientation by direct or smoothed attribute value. The results showed that smoothed attribute values with omitted attribute of a central residue in a sliding window (used for smoothing) produced the best descriptors. In this case too, the criterion for choosing descriptors was the correlation with measured TI values of the „training“ data set peptides. The inclination of resulting vector, named the sequence moment vector, is given with respect to the x-axis. The sequence moment vector is therefore an indicator of the lengthwise asymmetry of the peptide for the chosen attribute profile, and is not associated with secondary structure of the peptide. Lengthwise asymmetry is different from sidewise asymmetry or amphipathicity. Sidewise asymmetry is associated with secondary structure of the peptide, and measured by Eissenberg’s hydrophobic moment (Eissenberg et al., 1982). Lengthwise asymmetry of the peptides is additionally emphasized with the observation that AAs closer to the N-terminus are more relevant for AMP activity (Tossi et al., 1997; Tossi et al., 2000), and that is included in calculation of the sequence moments as optimized weighting factor (Juretić at al. 2009). To be more specific, for the job of converting sequence profiles of AA attributes into sequence moments the following was necessary:
144 different scales of AA attributes obtained from studies describing protein folding and integral membrane proteins (Juretić at al. 1998 (b), Gromiha 2005, Yuan et al., 2006)
Finding sequence profiles from AA attributes by considering three simple methods: direct usage, smoothing with central AA in a sliding window (mean values), smoothing with central AA in sliding window but not taking into account the attribute for the central AA itself (sequence environment values).
Determining peptide bending angle between 15 possible ones from /15,/14... to.
Determining weighting values among 0, 1, 1/2, 1/3, 1/4.
These characteristics were applied at the „training“ set of 36 nonhomologous peptides, to obtain sequence moments, for all pairs of sequence profiles corresponding to the same angle and weighting value. In practice, this means that „PredictorSelector“ algorithm examined all pairs of AA attributes (all pairs of AA scales), all weighting values, all bending angles and each of the three methods for creating sequence profiles to find the best descriptors.
Finding frequent motives of the best peptide antibiotic was also of great interest. For this purpose, the „set of the best peptides“ (SBP) extracted from AMPad database was used and two indices were introduced: AA selectivity index and motif regularity index. Incorporation of the motives, found in the peptides of SBP, in new designed peptides is estimated by means of a motif regularity index (Juretić et al., 2009; Juretić et al., 2011). The lower the motif regularity index value is, the greater regularity associated with the new peptide is. The statistical analysis behind motif regularity index combines:
definition of the AA selectivity index scale,
definition of the succeeding AA for each AA residue extracted from the SBP set in a manner that it is one of the five most common successors of required AA,
definition of the AA placed in the i + 4 position with respect to any AA, which is the AA spatially close in an helical conformation, also extracted from the SBP set in the manner that it is one of the five most common successors in that position.
AA selectivity index selects AA with high frequency among most effective frog-derived antibiotics (Juretić et al., 2009; Juretić et al., 2011). It must be noticed that selectivity index scale reflects selectivity but not necessarily the antimicrobial potency. Fifth possible most common successor in both groups was chosen among glutamic acid (E), aspartic acid (D), glutamine (Q) and histidine (H), in that way additionally favouring AA most significant for selective frog-like peptide antibiotics.
A hydrophobicity index scale CCS was used for global hydrophobicity and amphipathicity calculation for each synthesized peptide sequence (Tossi et al., 2000; Tossi at al. 2002). Hydrophobicity index scale was derived from the normalized and filtered
consensus of 163 published scales with values that arbitrarily ranges between +10 for phenylalanine (F) and -10 for arginine (R). Hydrophobicity of the peptide was calculated as the mean value by dividing sum of hydrophobicity indices for AA in the given peptide, with length of the peptide, while mean hydrophobic moment was calculated as described in Eisenberg et al., 1982. A perfectly amphipathic, 18 residue peptide, consists of only two AA, most hydrophilic Arg and most hydrophobic Phe, with maximum hydrophobic moment of 6.4 when CCS scale is used as the reference scale. For each predicted peptide relative amphipathicity was determined with respect to already mentioned perfect amphipathic peptide.
2.1.4. „Designer“ algorithm
All the above mentioned characteristics of the peptides were used in the „PredictorSelector“ algorithm that led to choosing the D-descriptor, as the simplest descriptor extracted from position dependent physicochemical properties. The D-descriptor is defined as a cosine of the angle between sequence moments vectors (see Section 3.1, page 45, for the D-descriptor definition too). A linear one-descriptor fit for predicted TI was then obtained: TI = 50.126 – 44.803D, such that correlation between predicted and measured TI was r2 = 0.83. The second goal of this process was the creation of the “Designer“ algorithm. D-descriptor was a good base but it has its limitations, for example the range of predicted TI is limited to 5 < TI < 95, while that of measured ones ranges from less than 0.5 to well over 100. The intent was to create an algorithm that distinguishes between good and mediocre peptides when considering TI, but not to predict the exact TI itself. Furthermore, for designing peptides an algorithm has to be taken into account, apart from the high predicted TI value:
appropriate net positive charge
hydrophobic moment
hydrophobicity
the peptide length
all of which are relevant to its antimicrobial potency.
If these characteristics were applied to a peptide with approximately 20 AA, the algorithm could not work, because the number of possibilities needed to be checked would be extremely large. Therefore additional physicochemical and rational data mining derived restrictions were applied along with a recursive algorithm, all based on the structural and chemical characteristics of the peptides from the SBP set. The peptide length chosen for the initial peptide design was 23 AA. The following restrictions were applied following the most frequently found characteristics in natural AMPs, especially in SBP (Juretić et al., 2009):
1. TI > 85 predicted (for D-descriptor model maximal TI = 95),
2. 4 or 5 for net positive charge, counting Lys and Arg as +1, Glu and Asp as -1, His as neutral and not taking the N- or C-termini into account,
3. 0.0 to – 1.2 for mean hydrophobicity using CCS scale (Tossi et al., 2002), 4. separation of polar (E, D, Q, N, G, K, R) from nonpolar (A, L, M, V, I, F, W) AA
residues in helical wheel projection (design was limited to helix-forming amphipathic peptides, where Gly residues are part of polar helix face, and Hys are not),
5. limits to two neighbouring identical AA,
6. three C-terminal AA residues as in at least one good natural peptide antibiotic, 7. Gly for the first AA residue,
8. Leu or Ile on the second position,
9. minimum of nine residues E, D, Q, H, G, having high AA selectivity index, must be present in a designed paptide,
10. motif regularity index lower than 2.5 (Juretić et al., 2011).
These precise rules for peptide design were such to result in an algorithm executable in reasonable time and a workable load of suggested AMPs expected to have high TI value as well as good antimicrobial activity against Escherichia coli. Recursive algorithm eliminated partial peptide sequences as soon as they violated one of the proposed restrictions.
All files connected to „Designer“ algorithm including AMPad database, are available at (Web link [9]). TI values can be calculated for any query sequence using the tool “Predictor” available at Web link [10], with full name “Therapeutic index estimator for frog-derived helical antimicrobial peptides”. The “Predictor” is incorporated in the “Designer” algorithm.
2.2.
SPPS (solid phase peptide synthesis) of designed peptides
An easy and rapid way to produce peptides needed for testing is solid phase synthesis. Adepantins were synthesised on the CEM Liberty synthesizer.
2.2.1. Selection of peptides for synthesis
Restrictions implemented in the algorithm were strict enough to predict a small number of peptides, only 7 of them. Among them, the only peptide in the group ending with S (Ser; Serine) at the C terminus was chosen to be tested first. It was called adepantin 1 (ADP1). The remaining peptides from the group end with C (Cys; Cysteine). For additional testing, two more peptides from the same group were selected: having the most and the least similar primary sequence to adepantin 1, later called adepantin 2 (ADP2) and adepantin 3 (ADP3) respectively. Sequences were aligned and compared using bioinformatical tool Clustal V (version used in 2008). As the Cys at the C terminus has a reactive sulphydryl group, its reactivity was exploited in for experimental testing, such as for labelling the peptides with a fluorescent molecule, constructing dimers, or just blocking the Cys by iodoacetamidation. Another two peptides of natural origin were used as reference peptides in the first sets of
experiments: ascaphin 1 (ASC1) (Conlon et al., 2004) and pseudin 2 (PSEU2) (Olson et al., 2001). These had also been used for the first tests of the „Mutator“ algorithm, ASC1 as an example of a “good” antimicrobial peptide, with high TI, and PSEU2 as a mediocre one.
2.2.2. Synthesis difficulty prediction
The first step in the laboratory testing was preparing for the synthesis, using a software connected to the Liberty peptide synthesizer to calculate AA weights as well as those for other necessary reagents, solvent volumes etc. The Liberty PepDriver software controls all aspects of the synthesis automatically. A separate software, PeptideCompanion from CoshiSoft can be used to predict difficult coupling sequences in the peptide and help decide whether it is necessary to apply longer coupling cycles, double coupling and/or increased deprotection cycles. For adepantins, most of the couplings were predicted to be difficult so double-coupling reactions were carried out at most positions.
2.2.3. Solid phase synthesis
There are two techniques for synthesizing peptides in the laboratory. The classical approach is the liquid phase peptide synthesis which is mostly replaced by widely accepted solid phase peptide synthesis (SPPS) (Merrifield, 1963; Kent, 1988). The liquid phase peptide synthesis is a classical method still used for industrial purposes in large scale production. SPPS was pioneered by Merrifield, and is used for producing peptides:
that are natural but cannot be obtained recombinantly from bacteria,
that have unnatural AA,
that have altered backbone characteristics,
for synthesizing peptides and proteins from D-amino acids (D-AA).
The solid support must be treated with a linker to allow “hosting” the growing peptide chain during its construction, so that the peptide is not washed away when other reagents are removed during washing in synthesis cycles. Using SPPS result in good yields at each coupling cycle, and consequently also of the final product. For this purpose, each incoming AA is added in a large excess (at least 4x), and in combination with appropriate activating agents. While ribosomic peptide synthesis starts from the N-terminus and proceeds towards the C-terminus, SPPS creates peptide from C to N- terminus. There are widely used chemistries, Fmoc and Boc. The t-Boc (tert-butyloxycarbonyl) chemistry was the originaly proposed version by Merrifield, in 1963, where t-Boc is the -amino protecting group and it is removed from the growing peptide using neat trifluoroacetic acid (TFA), while side chain protecting groups and cleavage from the resin at the end of synthesis requires hydrofluoric acid, and is dangerous. In Fmoc (9-Fluorenylmethoxycarbonyl) SPPS, basic conditions are required to remove the -amino protecting group (20% piperidine in DMF), while side chain deprotection and resin cleavage require TFA. For adepantins synthesis we used the Fmoc group.
Two groups of compounds are normally used for activations: triazoles and carbodiimides (very reactive with high probability for causing AA racemisation). Triazoles most commonly used are:
HOBt (1-hydroxy-benzotriazole), an organic compound used both as coupling reagent and racemisation suppressor, that can improve peptide yields in synthesis,
PyBOP (Benzotriazo
![Figure 8. Scheme of mini-extruder (Avanti Polar Lipids, Alabaster, AL) (as in Web link [13])](https://thumb-ap.123doks.com/thumbv2/123dok/1696312.2603503/55.892.113.778.112.377/figure-scheme-mini-extruder-avanti-polar-lipids-alabaster.webp)