PIRITA HÄRKISAARI
WEAR AND FRICTION EFFECTS ON ENERGY CONSUMPTION
IN THE MINING INDUSTRY
Master of Science Thesis
Examiners: Professor Veli-Tapani Kuokkala and Project Manager Kati Valtonen. Examiners and topic ap-proved by the Faculty Council of the Faculty of Engineering Sciences on January 14th 2015.
ABSTRACT
PIRITA HÄRKISAARI: Wear and Friction Effects on Energy Consumption in the Mining Industry
Tampere University of Technology
Master of Science Thesis, 77 pages, 14 Appendix pages April 2015
Master’s Degree Program in Material Science Major: Personal Studies in Materials Science
Examiners: Professor Veli-Tapani Kuokkala, Project Manager Kati Valtonen Keywords: Mining, energy consumption, wear, friction
Mining is very important globally. The total amount of mines worldwide is estimated to be 100,000–150,000 [1]–[3]. Mining’s share of global energy consumption is ~5% [4]– [6]. Previous studies made on vehicles [7], [8] and paper machines [9] indicate that even 20–30% of total energy is lost due to friction. Similar studies on the energy losses due to wear have not been made.
This thesis is divided into two parts. In the first part, the global mining industry, energy consumption in mining, and wear and friction in mining are examined. In the second part, case studies of highly energy consuming devices, a haul truck, a jaw crusher, and a grinding mill, are made.
From all mines, 70–80% are surface mines and 20–30% are underground or mixed mines. The largest mining countries are China, USA, Australia, India, and Russia [1]. The mining process can roughly be divided into three operational stages: extraction, haulage, and processing. In addition to these three, there is the group of supporting ac-tivities. When the energy consumption distribution in surface and underground opera-tions was studied it was discovered that most of the energy goes to processing and sup-porting activities.
In the case studies the energy losses due to friction are examined by making energy dis-tribution models. Previous studies and literature on this field was used as a frame of reference in this work. The effect of wear is evaluated by calculating the costs caused by replacement parts and wear-related maintenance.
The obtained results indicate that friction losses in the rigid frame haul truck are 24%, in the jaw crusher 30%, and in the grinding mill 50% of the total energy consumption. The annual costs of wear are in the haul truck 40,000€, in the jaw crusher 100,000€, and in the grinding mill 825,000€. The total annual costs of wear and friction compared with the purchase price of a new device are 28% in a haul truck, 13% in a jaw crusher, and 34% in a grinding mill. Energy savings can be obtained with improving energy efficien-cy, planning the mining operations and maintenance, and with material selections.
TIIVISTELMÄ
PIRITA HÄRKISAARI: Kulumisen ja kitkan vaikutus energiankulutukseen kaivosteollisuudessa
Tampereen teknillinen yliopisto Diplomityö, 77 sivua, 14 liitesivua Huhtikuu 2015
Materiaalitekniikan diplomi-insinöörin tutkinto-ohjelma Pääaine: Materiaalitekniikan henkilökohtaiset aineopinnot
Tarkastajat: professori Veli-Tapani Kuokkala, projektipäällikkö Kati Valtonen Avainsanat: kaivosteollisuus, kuluminen, kitka, energiankulutus
Kaivosteollisuus on maailmanlaajuisesti merkittävä teollisuudenala. Maailman kaivos-ten kokonaismäärä on arviolta noin 100 000–150 000 [1]–[3]. Kaivosteollisuus vastaa noin viittä prosenttia globaalista energiankulutuksesta [4]–[6]. Kitkan osuutta kokonais-energiankulutuksesta on tutkittu aikaisemmin ajoneuvoille [7], [8] ja paperikoneille [9] ja todettu, että jopa 20–30 prosenttia kokonaisenergiasta kuluu moottorin ja vaihteiston kitkahäviöihin. Vastaavaa tutkimusta kulumisen aiheuttamista häviöistä ei ole tehty. Tämä diplomityö on jaettu kahteen osaan. Ensimmäinen osa käsittelee kaivosteollisuut-ta yleisellä kaivosteollisuut-tasolla sekä energiankulutuskaivosteollisuut-ta, kitkaa ja kulumiskaivosteollisuut-ta kaivosteollisuudessa. Toinen osa koostuu paljon energiaa kuluttavien laitteiden case-tutkimuksista. Tutkitta-viksi laitteiksi on valittu dumpperi, leukamurskain sekä jauhinmylly.
Maailman kaivoksista 70–80 prosenttia on avolouhoksia ja 20–30 prosenttia maanalai-sia kaivokmaanalai-sia tai sekakaivokmaanalai-sia. Suurimpia kaivosmaita ovat Kiina, USA, Australia, In-tia. Kaivosprosessi voidaan karkeasti jakaa kolmeen osaan, louhintaan, kuljetukseen ja prosessointiin sekä niiden tukitoimintoihin. Avolouhoksissa sekä maanalaisissa kaivok-sissa suurimpia energiankuluttajia ovat prosessointi ja tukitoiminnot.
Kitkan aiheuttamia energiahäviöitä tutkitaan tässä työssä energianjakautumismallien avulla. Lähteenä malleihin käytetään kirjallisuutta ja aikaisempia tutkimuksia aiheesta. Kulumisen vaikutuksia arvioidaan laskemalla uusien kulutusosien hankinnan sekä ku-lumisen aiheuttaman kunnossapidon kustannuksia.
Kitkahäviöt suhteessa kokonaisenergiankulutukseen ovat dumpperilla 24, leukamurs-kaimella 30 ja jauhinmyllyllä 50 prosenttia. Kulumisen aiheuttamat kokonaiskustannuk-set ovat arviolta dumpperilla 40 000 €, leukamurskaimella 100 000 € ja jauhinmyllyllä 825 000 € vuodessa. Jos vuosittaisia kitkan ja kulumisen yhteiskustannuksia verrataan uuden laitteen hankintahintaan, ovat vastaavat luvut dumpperille 28, murskaimelle 13 ja jauhinmyllylle 34 prosenttia. Energiasäästöjä voidaan saavuttaa parantamalla energia-tehokkuutta, prosessien ja kunnossapidon suunnittelulla sekä materiaalivalinnoilla.
PREFACE
This Master’s thesis has been done within the FIMECC BSA (Breakthrough Steels and Applications) programme. I gratefully acknowledge the financial support from the Finn-ish Funding Agency for Innovation (Tekes) and the participating companies. The thesis is written at Tampere University of Technology.
This thesis has been a true learning process in many dimensions. It has been very inter-esting to learn about the mining industry, to see the actual mining processes, and to find many new possibilities for my future career.
I want to thank my supervisors Kati and Kenneth for your help and support. Thank you, Veli-Tapani for taking the time to examine my work from the other side of the Atlantic Ocean. A special thank you goes to our associates in VTT, Metso, Outotec, SSAB, Py-häsalmi mine and Kiruna mine as well as maintenance specialist Seppo Tolonen. With-out the expertise from in field in question this thesis would be in a totally different form. My journey to become a Master of Science has been a memorable one. I am happy that I have had the opportunity to see so many sides of teekkari life and the credit from that goes to all You people I met in my guild, in the student union as well as teekkari choir and NääsPeksi, in my Erasmus studies in Spain, or maybe just somewhere else on the way! A special thank you goes to the GGGG girls Laura, Tanja and Elli. It just never would have been the same without you.
Thank you, Ville for your continuous support and for bearing with me in this somewhat stressful thesis-time. But most importantly, thank you to my family Anita, Jorma, and Kaisa for always believing in me and encouraging and supporting me. I did it, finally.
Tampere 7. 4. 2015
CONTENTS
1. INTRODUCTION ... 1
2. GENERAL VIEW TO THE MINING INDUSTRY ... 3
2.1 Global division of mines and mine sites ... 3
2.1.1 Total number of mines in the world ... 5
2.2 Mining sectors ... 6
2.3 Average mine ... 7
2.3.1 Global production of coal ... 7
2.3.2 Global production of metals ... 10
2.3.3 Global production of industrial minerals ... 12
2.3.4 Summary of the average mines ... 13
2.3.5 Operational lifetime of a mine ... 13
2.4 The main operational categories in mining ... 16
2.4.1 Extraction ... 16
2.4.2 Haulage ... 18
2.4.3 Processing ... 19
2.5 Energy consumption in the mining industry ... 22
2.5.1 Energy consumption of some large mining companies ... 22
2.5.2 Energy distribution in surface mining operations ... 24
2.5.3 Energy distribution of underground mining operations ... 24
2.5.4 Energy distribution of a global mine... 26
2.6 Wear and friction in the mining industry ... 27
2.7 Maintenance and utilization rate ... 30
3. METHODOLOGY OF THE CASE STUDIES ... 32
4. OFF-HIGHWAY HAUL TRUCK CASE ... 34
4.1 Energy consumption of a haul truck ... 35
4.2 Wear of haul truck components ... 37
4.2.1 Truck frame ... 37
4.2.2 Engine ... 39
4.2.3 Tires ... 40
4.2.4 Maintenance and wear parts costs of a haul truck ... 42
4.3 Summary of the haul truck case ... 44
5. JAW CRUSHER CASE ... 45
5.1 Energy consumption of a jaw crusher ... 46
5.2 Wear in a jaw crusher ... 47
5.2.1 Feeder ... 48
5.2.2 Engine ... 49
5.2.3 Conveyor ... 49
5.2.6 Maintenance and wear part costs of a jaw crusher ... 53
5.2.7 Summary of the jaw crusher case ... 54
6. GRINDING MILL CASE ... 55
6.1 Energy used for grinding ... 56
6.2 Wear in a grinding mill ... 57
6.2.1 Feeder ... 57
6.2.2 Shell ... 58
6.2.3 Motor ... 59
6.2.4 Maintenance and wear part costs of a grinding mill ... 60
6.3 Summary of the grinding mill case ... 61
7. SUMMARY OF THE CASE STUDIES ... 62
8. SUMMARY AND CONCLUSIONS ... 64
APPENDIX A: CONVERSION FACTORS APPENDIX B: LIST OF GLOBAL MINE SITES
LIST OF FIGURES AND TABLES
Figure 1. Mines and mine sites in the world [22]. Blue and green points demonstrate exploration sites and red points producing mines. Orange points indicate drilling sites (excluded from this
investigation). ... 4
Figure 2. World production of minerals in 2012 [1, pp. 38–39] (natural gas and petroleum excluded). ... 6
Figure 3. Estimated market value of the mining sectors: World production numbers are from 2012 [1] and the price estimations from June 2014 [28] (natural gas and petroleum excluded). ... 7
Figure 4. Annual production of selected coal mines in 2013 [17, p. 48][35, p. 18][36, p. 212][37, p. 251]. ... 9
Figure 5. Annual production of selected iron mines in 2013 [17, p. 48], [26, p. 25], [36, p. 213], [37, p. 251], [42, p. 96] ... 11
Figure 6. The estimated lifetime of selected mines [17, pp. 26–45], [26, pp. 60– 68]. The mines marked with yellow are iron mines black ones produce coal, brown phosphate and blue other metals such as copper or nickel. ... 15
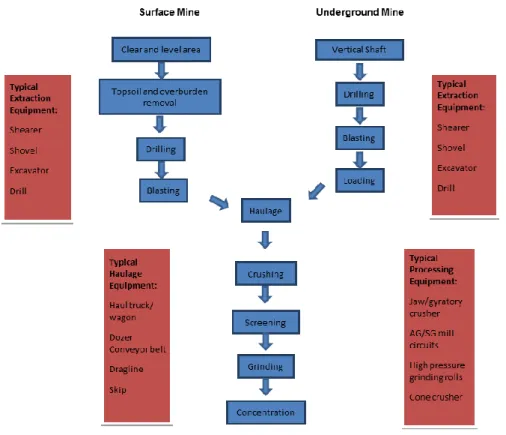
Figure 7. Underground and surface mining processes of iron and typical equipment used in different operational categories, modified from [24, p. 9],[39, p. 7]. ... 17
Figure 8. Distribution of energy consumption in surface mining, modified from [58]. ... 25
Figure 9. Distribution of energy consumption in underground mining, modified from [59]. ... 26
Figure 10. Factors influencing the wear lifetime, modified from [55, p. 4]. ... 29
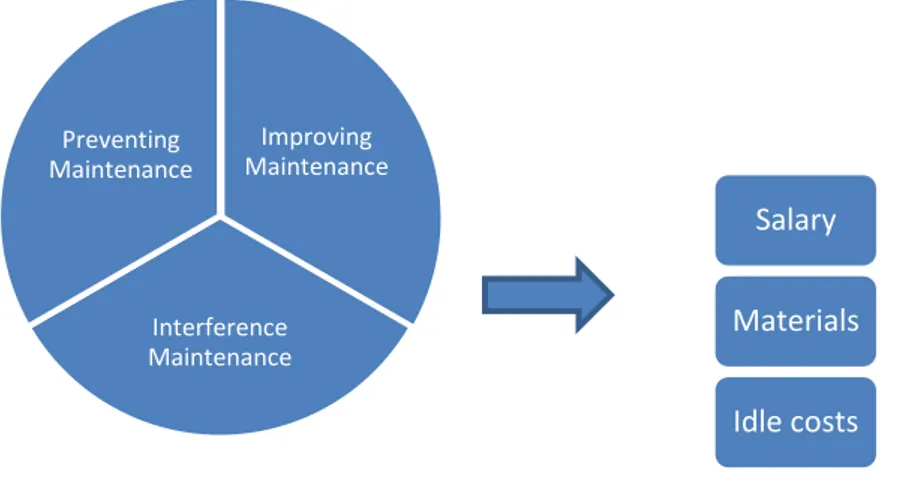
Figure 11. Maintenance operations and the costs they cause. ... 31
Figure 12. Energy breakdown of a device. ... 33
Figure 13. Costs caused by wear. ... 33
Figure 14. A Rigid-frame haul truck CAT-777 [90]. ... 34
Figure 15. Estimation of the energy distribution of a heavy-duty vehicle. ... 37
Figure 16. Rubber liner after 5200 operational hours [102]. ... 39
Figure 17. Wear in a truck tire [116]. ... 42
Figure 18. Crushing process of Lokotrack LT140 jaw crusher[128]. ... 45
Figure 19. Estimation of the energy distribution of a jaw crusher. ... 47
Figure 20. Main components of a conveying system[136, p. 9]. ... 49
Figure 21. Main components of a track system [144]. ... 51
Figure 22. An AG grinding mill [152] ... 55
Table 1. The 20 largest mining countries in the world [1, pp. 191–261] (plus
Finland and Sweden). ... 4
Table 2. Summary of average sizes of different mine types. ... 13
Table 3. Unit operations for the stages of comminution, modified from [60, p. 1462] f presents the percentage of the feed of the material in a given size. ... 20
Table 4. Energy consumption and GHG emissions of large mining companies [17], [26], [36], [37, pp. 251–253], [46, p. 13], [64, p. 79], [65, p. 25], [70, p. 70], [71, p. 17], [72, pp. 14–20], [73]. ... 23
Table 5. Summary of the energy distribution in surface and underground mines[58], [59]. ... 27
Table 6. Technical data of the haul truck CAT-777 [90]. ... 34
Table 7. An example of a haulage cycle. ... 35
Table 8. The fuel consumption of a haul truck [94] ... 36
Table 9. Wear and estimated operational life of the haul truck body components [99], [100], [102], [104], [105]. ... 38
Table 10. Wear and estimated operational life of the haul truck diesel engine components [99], [110]–[112]. ... 40
Table 11. Technical data of haul truck EROCK tires [113]. ... 40
Table 12. Wear in a haul truck tire [94]. ... 41
Table 13. Wear and estimated operational life of the haul truck tire components [99]. ... 42
Table 14. Maintenance operations of a haul truck [110]. ... 43
Table 15. Annual costs for the common spare and wear parts of a haul truck [120]–[124]. ... 44
Table 16. Technical data of the Lokotrack LT140 mobile jaw crusher [128]. ... 45
Table 17. Crushing energy and affecting parameters. ... 46
Table 18. Wear and estimated operational life of the jaw crusher feeder components. ... 48
Table 19. Wear and estimated operational life of the jaw crusher conveyor belt components [137]–[140]... 50
Table 20. Wear and estimated operational life of the jaw crusher jaw components [99], [104], [105], [148], [149]. ... 53
Table 21. Maintenance operations of a jaw crusher [99], [150] ... 53
Table 22. Estimated annual cost of jaw crusher wear parts [99]. ... 54
Table 23. Technical data of the AG grinding mill [63], [151]. ... 55
Table 24. Energy consumption of the grinding process. ... 56
Table 25. Wear and estimated operational life of the grinding mill feeder components [63], [97], [108]. ... 58
Table 26. Wear and estimated operational life of the grinding mill shell
components [63], [139]... 59
Table 27. Planned maintenance of a grinding mill [63], [99], [159]. ... 60
Table 28. Annual costs of grinding mill wear parts [63], [99], [123], [124]. ... 61
Table 29. Summary of annual friction losses. ... 63
Table 30. Summary of annual wear losses. ... 63
LIST OF SYMBOLS AND ABBREVIATIONS
Al Aluminum
Au Gold
CO2-eq Carbon dioxide equivalent
Cu Copper
ct Carat
Di Diamond
E Energy
f Top size of feed material
Fcl Climbing resistance
Fm Main resistance
Fs Secondary resistance
Fsp Special resistance
Ftot Total resistance
Fe Iron
Mtoe Million tons of oil equivalent
N Required power
Ni Nickel
oz Ounce
p Top size of product material
Ph Phosphate
t Tonne (metric ton)
v Speed of the conveyor
Vkm Vehicle kilometer
Wi Work index
Zn Zinc
η Mechanical efficiency
AG/SAG Autogenous/ Semi-Autogenous (grinding mills)
AU Australia BR Brazil CA Canada CN China CO Colombia CV Calorific Value
GDP Gross Domestic Product
GHH Greenhouse Gas
HV Vickers hardness
HPGR High pressure grinding roll IBRAM Brazilian Minerals Institute
ID Indonesia
MZ Mozambique
ROM Run-of-mine
SE Sweden
US Unites States of America
1. INTRODUCTION
The global energy demand increases continuously. In the last 40 years, the world’s en-ergy demand has doubled [10, p. 28]. A review made by the oil company BP [11] indi-cates that in the year 2013 the global energy consumption increased by 2.3% from the previous year, especially in the developing countries. Even though the development of renewable energy sources is rapid, more than 80% of the total energy is produced with oil, coal and natural gas [10]. In 2012, the energy related CO2 emissions increased by 1.4% from the year 2011 [12].
The industry, on average, is responsible for 30% of the total energy consumption [10]. In 2011 in the USA from all the industry sections mining was in charge of 2–3% of the energy consumption [6], which corresponds to approximately 1% of the total energy use. In South Africa mining used 8% of the total energy [4] of the country in 2010. The corresponding number in Canada in 2009 [5] was 12%. The world’s largest individual energy consumer is China, which also produces 40% of the world’s minerals [1]. Not all energy is used for mechanical work, but a large portion of it is lost due to cool-ing, exhaust, friction and wear. For the first time the relation between wear and friction and the costs they cause on the gross domestic product was researched by the Great Britain Ministry of Technology in 1964. The so-called Jost Report [13] proposed the total part of wear in the GDP to be 2%. Many studies on this topic have been made, and later figures presented in the ASM Tribology Congress in 2013 [14] suggest that the wear costs are annually even 9% of the GDP. The potential savings with the correct use of tribology are estimated to be up to 1.6 % of the GDP [15]. In the European Union this would correspond to 250 billion euros, which is almost the double of the European Union budget for 2014 [16].
Recent studies made on vehicles [12], [13] propose that one third of the energy fed to passenger cars or trucks goes to overcome friction in the engine, transmission, brakes and tires. In paper machines the equivalent number is 15–25% [9]. The circumstances in mining are more demanding than for example in the paper industry; instead of a con-trolled industrial environment the conditions in a mine can differ from the dry and hot deserts of Atacama Copper mine [17, p. 279] in Gobi desert to the cold icy Norilsk Nickel mine sites [18, p. 28] in Siberia, Northern Russia, and everything in between. Understanding and controlling wear and friction therefore plays an extremely important role in the total energy consumption in the mining industry.
In the first part of this study, the global mining industry is mapped; how many mines are there globally, what an average mine would be like, and how is the energy consumption divided in the mining industry. Mining for construction as well as oil and natural gas drilling are excluded from this investigation. In the second part of the thesis, three ener-gy consuming devices are more closely examined: a haul truck, a jaw crusher, and a grinding mill. The energy losses due to friction and the costs caused by wear are exam-ined in each case.
2. GENERAL VIEW TO THE MINING INDUSTRY
In earlier times, a mine was built wherever ore was found. Nowadays, however, the mining business has developed to an entity where the actual mining process is just one of the many factors to be considered. When building up a mine it is rational to debate whether the mineral is really worth excavating, are the resources adequate to make the mine profitable, and what are the best methods for mining [19, pp. 4–6]. The current trends are towards carefully optimized operational units, where extraction is done even deeper and from lower grades of ore [20, pp. 8–9]. In addition to the actual extraction and minerals processing the environmental and political factors such as conservation or permits [19, pp. 4–6] and social license for mining [21, pp. 23–24] must be considered. In the following chapter, an overview of the global mining industry, the mining process, and the energy consumption in mining is made. In the end of the chapter, the phenome-na of wear and friction as well as maintephenome-nance in mining are discussed.
2.1 Global division of mines and mine sites
Geographically most mines are found in Asia (58.4%) and North America (14.4%) [1, p. 24,27]. When investigating the development status of the mining countries, over half (60.1%) of mining is done in developed countries, a quarter (26.1 %) in undeveloped countries, and the rest (13.8 %) in transition countries. The trend is towards developing countries. Figure 1 presents the geographical division of mines by InfoMine website [22]. Blue and green points demonstrate exploration sites and red points producing mines. Orange points indicate drilling sites (excluded from this investigation).
In Table 1 are listed the largest mining countries in the world, when oil and mineral fuels are excluded from the examination. The majority of world’s mines are situated in China, United States of America, and Australia, of which the first two cover over half of the world’s production [1, pp. 191–261].
If oil and mineral fuels were included in the research, the top two countries would stay the same, but Russia becomes the third before Australia. Saudi-Arabia, which is not found in Table 1, would be number seven in the world chart because of its abundant oil and natural gas resources [1, p. 30].
Figure 1. Mines and mine sites in the world [22]. Blue and green points demonstrate exploration sites and red points producing mines. Orange points indicate drilling sites
(excluded from this investigation).
Table 1. The 20 largest mining countries in the world [1, pp. 191–261] (plus Finland and Sweden).
Country Percentage of the world production (2012) 1. China 40.96 2. USA 10.27 3. Australia 8.20 4. India 7.22 5. Russia 4.71 6. Indonesia 4.43
7. The Republic of South Africa 3.08
8. Brazil 2.85 9. Georgia 2.21 10. Kazakhstan 1.53 11. Poland 1.47 12. Canada 1.21 13. Ukraine 1.15 14. Turkey 1.03 15. Colombia 0.66 16. Greece 0.66
17. The Czech Republic 0.57
18. Mexico 0.50
19. Vietnam 0.45
20. Iran 0.43
31. Sweden 0.17
2.1.1 Total number of mines in the world
Finding the exact number of mines in the world is complicated. Canadian American Handbook 2007–2008 [23] reports the total number of mines to be about 500–750, while Mining Journal 2014 [2] proposes the total number to be 125,000. This large dif-ference must be due to difdif-ferences in the classification; in one case all small quarries are seen as individual operations while in the other cases only large industrial mines are accounted for. Precise numbers where obtained from two mining countries: Brazil and USA. According to the Brazilian Minerals Institute IBRAM [3] in Brazil, where there are 2.85 percent of mines of the world, the total number of mines is 7,054. In the United States the corresponding numbers were 10.27 percent and 13,904 mines [24] (numbers from 2000). Using these numbers as a basis, the total number of mines in the world would be 135,384~247,509 mines. An educated guess is somewhere around 100,000– 150,000 mines.
Not all mines have their own mineral processing units at the site. Especially in situa-tions where there are many small mines quite close to each other, it is smart to concen-trate the mineral processing to only one location. The amount of mineral processing plants is half or less of the total amount of mines.
2.1.1.1 Underground vs. surface mine
With similar conditions, a surface mine is usually preferred to an underground mine due to lower development costs, quicker start-up time, and lower accident rates [25, pp. 341–42]. Factors that influence the decision between these two mine types are dimen-sions of the deposit and ore recoveries and revenues. Nowadays environmental and so-cial issues also have a strong influence on the site permissions of a mine. Due to envi-ronmental effects, obtaining a permit for an open pit mine may be complicated. Quite a common procedure is also that a mine is built up as an open pit and later developed to an underground operation.
The larger portion of mines worldwide are surface mines. When examining the under-ground metal and coal production in the USA during the years 2003–2007 [25, pp. 341– 342], it can be noted that in 2007 less than 10% of the mines were underground mines. With coal mines the tendency for underground extraction is higher (30.68%) than with metals (1.27%) and non-metals (3.61%). Global numbers are very similar. For example, one of the world’s largest mining companies, Vale [26, pp. 27,34,47–50], has 43 mine sites of iron, copper, coal and phosphate, of which 83% are surface operations. From the mines located in Brazil [3], 99% are surface mines. Coal India [27, p. 36], a company producing only coal, has more underground mines; from 429 mines 55% are under-ground or mixed operations and the remaining 45% are surface mines. A rough estimate is that 70–80% of all mines are surface operations, and 20–30% mixed or underground mines. In the future mines the ore must be recovered deeper [18, p. 6], and therefore it
2.2 Mining sectors
One way to classify the mining sectors is the division into iron and ferroalloy metals, non-ferrous materials, precious metals, industrial minerals, and mineral fuels. Figure 2 presents the world production of minerals in different mining sectors in 2012 (natural gas and petroleum excluded). The largest portion of world’s minerals production is in mineral fuels (77%), and the highest production of metals is in iron and ferroalloy met-als (15%). The third most produced mineral is industrial minermet-als (7%). Non-ferrous and precious metals together cover only one percent of the world production [1, pp. 38– 39].
Figure 2. World production of minerals in 2012 [1, pp. 38–39] (natural gas and petro-leum excluded).
Figure 3 shows the same mining sectors when inspecting their market value from statis-tics provided by Index Mundi [28] in June 2014. To simplify the framework, from each sector a highly produced material according to Reichl et al. [1] is chosen; for ferrous metals the price of iron is examined, for non-ferrous metals the prices of aluminum and copper (an average of the two), for precious metals gold, for industrial minerals phos-phate, and for mineral fuels coal. Industrial minerals and iron have quite similar figures in both graphs. The largest difference is with mineral fuels and non-ferrous and precious metals. The market value of mineral fuels is clearly smaller than their production value. On the other side there are non-ferrous metals and precious metals, which have a high market price compared to the production rate.
15%
1% 0.0003% 7%
77%
Iron, Ferroalloy Met. Non-Ferrous Metals Precious Metals Industrial Minerals Mineral Fuels
Figure 3. Estimated market value of the mining sectors: World production numbers are from 2012 [1] and the price estimations from June 2014 [28] (natural gas and
petrole-um excluded).
2.3 Average mine
There are hundreds of different minerals in the world with different properties; easily mined soft minerals as sand and gravel or harder minerals like metal ores. In addition, the environment and grade of the same mineral can vary, from underground extraction to the surface, and from abundant to a very low grade [29, p. 933].
As a framework for defining the average size of a mine, the production numbers of some of the largest mining companies in the world [30], and additionally some other mine sites, are used. A separate inspection is done to all five mining sectors presented in Chapter 2.2. A detailed Table of mine sites is found in Appendix B. The production numbers are presented in the scale which is common for the mineral in question; indus-trial minerals, iron and mineral fuels are in mega tonnes, precious metals are given in ounces, diamonds are given in carats and the production of other metals than iron are presented in kilo tonnes. A higher emphasis is given to coal and iron. Iron mining is also more carefully examined in the case studies of this thesis.
2.3.1 Global production of coal
Mineral fuels are the largest group in mining, even when oil and natural gas are exclud-ed from the investigation. The mineral fuels group includes coal in different forms (steam coal, hard coal, coking coal, and lignite) and uranium. The percentage of
urani-11%
36%
0.004% 7%
46%
Iron, Ferroalloy Met. Non-Ferrous Metals Precious Metals Industrial Minerals Mineral Fuels
Calculations have been made using the world price in June 2012. The following prices where used:
Non-ferrous metals: Aluminum and copper
Precious Metals: Gold Industrial Minerals: Phosphate Mineral Fuels: Coal
world’s largest coal producing countries are China, USA, India, Australia and South Africa [1, pp. 45, 175–177].
Coal is mined by both surface and underground methods. The choice of method de-pends mainly on the geology of the coal deposit. For example in Australia, the amount of surface mines is large (80%) while in USA it is a little bit smaller (67%) [31]. The grade of the coal is measured with its ability to create energy, also known as the Calorif-ic value (CV) [32]. Different coals are mainly used in power generation, steel manufac-turing, and industrial uses [33].
The world’s largest coal mine is found in Wyoming, USA [34]. North Antelope Ro-chelle mine had the annual production of 108 million tonnes in 2012. Other large coal mines are found in China, Mozambique, Australia, Russia and Colombia [34]. Figure 4 lists the annual production in the year 2013 for 50 coal mines. The mines are owned by large mining companies, Vale [26, p. 34], Shenshua Energy [35, p. 18], Rio Tinto [36, p. 212], BHP Billinton [17, p. 48] and Anglo American [37, p. 251]. After the mine’s name the country of location is presented by using the country codes provided by stand-ard ISO 3166 [38]. CN stands for China, AU for Australia, US for USA, MZ for Mozambique, ZA South America, ID Indonesia and CO for Columbia. More detailed information about the selected mines can be found in Appendix B. The annual produc-tion of an average coal mine in this list is 10.3 Mt, and the median is 8.2 Mt. Under the line of average are listed 32 mines and above 28 mines. Since the deviation from the average is quite large, (standard deviation 8.4 Mt), it can be assumed that the median provides a better view.
When the total production of these 50 mines is compared to the global total, [1, p. 177], it can be noticed that they cover only seven percent of the world’s production. Especial-ly in the developing countries there are still many small mine sites. The emphasis is, however, towards efficient mass production. All the large mines in this inspection are Chinese mines. It can be assumed that there are many more very large mine sites in China as well as in other large coal mining countries. There is no data available of the third largest coal producer, India, but the annual report of India’s largest coal producer Coal India (80% of India’s coal production) states that their annual coal production is 462.4 Mt, and the total amount of mines is 429 [27, p. 36]. These numbers indicate that an average Indian coal mine has an annual production of only 1.1 Mt.
Figure 4. Annual production of selected coal mines in 2013 [17, p. 48][35, p. 18][36, p. 212][37, p. 251]. 1.0 1.1 1.6 2.0 2.0 2.4 2.6 3.1 3.4 3.7 3.8 3.9 4.0 4.2 4.4 4.5 5.0 5.4 6.5 6.7 6.9 7.0 7.5 7.9 8.2 8.2 8.3 8.3 9.0 9.1 10.0 10.6 10.3 10.9 11.0 11.8 12.4 13.6 14.7 14.8 16.3 16.4 17.1 18.0 18.8 27.1 30.5 30.8 31.4 34.7 Daunia, AU Chaijiangou Mining, CN Benga,MZ EMM Indonesia, ID Isaac Plains, AU Integra Coal, AU Kestrel Coal, AU Carborough Downs, AU Poitrel, AU Drayton, AU Moatize, MZ Liuta Mine, CN Dawson, AU Mount Thorley, AU Cuncaota No 2 mine, CN Cuncaota No 1 mine, CN Gregory, Joint… South Walker Creek, AU
Navajo, US San Juan, US Saraji, AU Hail Creek Coal, Met, AU Wulanmulun, CN Illawarra Coal, AU Median Bengalla, AU Wakworth, AU Baotou Energy… Baode, CN Peak Downs, AU Cerrejón, CO Khutala, ZA Average Wanli No.1 mine, CN Shigetai, CN Clermont, AU Goonyella Riverside, AU Hunter Valley, AU Shangwan, CN Halagou, CN Middleburg, ZA Bu'ertai, CN Yujialiang, CN Mt Arthur, AU Beidian Shengli… Bulianta, CN Ha'erwusu Branch, CN Heidaigou, CN Shenbao Energy , CN Daliuta-Huojitu, CN 0.0 10.0 20.0 30.0 40.0 Annual production, Mt Average: 10.3 Mt/year Standard Deviation: 8.41 Mt Median: 8.23 Mt/year
2.3.2 Global production of metals
As Figure 2 illustrated, metals cover less than one fifth of the total minerals production. The global importance of metals is, however, larger industrially and in everyday life. In this Chapter, the global production of each metal group is studied: iron and ferroalloy metals, non-ferrous metals, and precious metals.
2.3.2.1 Iron and ferroalloy metals
Iron and ferroalloy metals are clearly the most highly produced metals in the world. The majority in this group are iron mines, but other significant ferroalloy minerals are for example chromium, manganese, nickel and titanium [1, p. 43]. Iron is usually found in iron oxide ores [39, p. 1]. The most significant iron containing minerals are magnetite, hematite, goethite and limonite. Iron can be found almost in every country in the world, but places where mining is economically profitable are not so many. For iron to be cost-effectively mined, the grade should be 60% iron. However, in China and Russia ore with a grade as low as 30% is mined [40, p. 2]. Most iron deposits are surface mines, but there are also underground iron mines [39, pp. 1–2]. The largest iron producing countries are China, Australia and Brazil, which together produce 70% of the world’s iron ore [1, pp. 95–96]. The world’s four largest iron mines are all situated in Brazil [41].
Figure 5 displays the annual production of the year 2013 for 36 iron mines, whose pro-duction together exceed 50% of the world’s iron propro-duction [1, p. 53]. As in the inspec-tion for coal mines (Chapter 2.3.1), the locainspec-tion of the mine is presented after the name with the international country code [38]. In addition to the previously presented codes, BR stands for Brazil, SE for Sweden and CA for Canada. The listed iron mines are owned by BHP [17, p. 48], Vale [26, p. 27], Rio Tinto [36, p. 213], Anglo American [37, p. 251], and LKAB [42, p. 96]. From the figure it can be noted that as with coal mines, the sizes of iron mines vary quite a lot from small production (less than one mil-lion tonnes annually) to very large (over 60 milmil-lion tonnes a year). When from these mines the average sized mine is calculated, the annual production would be 18.1 Mt and the median 13.9 Mt. The standard deviation of the iron mine sizes is 14.8 Mt. There are ten quite small mines with an annual production less than 10 Mt and four extremely large mines with an annual production of over 50 Mt a year. Due to the lack of infor-mation, mine sites in the largest iron producer country, China, are excluded from this examination. Considering the decreasing trend in iron prices [43] and the fact that ore in China has a lower grade than in other iron producing countries [44], it can be assumed that the size of iron mines in China is large rather than small.
Figure 5. Annual production of selected iron mines in 2013 [17, p. 48], [26, p. 25], [36, p. 213], [37, p. 251], [42, p. 96] 0.0 10.0 20.0 30.0 40.0 50.0 60.0 70.0 Thabazimbi, ZA Mt Goldsworthy Yarry, AU Urucum, BR Mar Azul, BR Agua Limpa, BR Corumbá, BR Gonco Soco, BR Abóboras, BR Córreco do Feiao, BR Tamanduá, BR Jangada, BR Capao Xavier, BR Fazendao, BR Capitao do mato, BR Hamersley, Eastern Range, AU Kolomela, ZA Hamersley Channar, AU Segredo, BR Fábrica Nova, BR Median Iron Ore Company, CA
Alegria, BR Caue, BR Hope Down, AU Conceicäo, BR Average Sapacado, BR N4E, BR Robe River, AU Samarco, BR Hamersley Iron, Nammuldi, BR Kiruna, SE Brucutu, BR Sishen, ZA N4W, BR Mt. Goldswothy Area C, AU N5, BR Newman, AU 0.6 1.3 2 4.2 4.4 4.5 4.7 5.4 5.8 6.7 6.9 9.2 9.3 9.9 10.1 10.8 11.0 12 12.5 13.9 15.4 15.8 15.9 16.9 18.1 18.4 19 19.9 20.8 21.8 22.2 25.3 28.7 30.9 31.3 52.6 53.6 62.4 Annual Production Kt Average Production 18.4 Kt/year Standard Deviation 14.81 Median: 13.9
2.3.2.2 Non-ferrous and precious metals
The most abundantly mined non-ferrous metals are aluminum, copper, zinc, and lead. The most common precious metals are silver and gold [1, pp. 43–44]. The mine sites of non-ferrous and precious metals are globally spread to all continents, and both surface and underground operations occur. Underground operations require more investments, but especially with precious metals if the size of the recovery is reasonable, there is a high probability for a profitable operation. Many metal mines do not produce only one metal but on the side a few or many ores are mined. It is quite common that as by-products of copper mines, gold and silver are mined, and likewise. Pyhäsalmi mine, producing copper, zinc, and sulfur [45], is an example of a diversified mine operation. For defining the average non-ferrous metal mine, the production in the year 2013 for 50 mine sites around the world is studied. For precious metals the production in 2013 for 25 gold mines is examined. Information about the mines is provided by mining compa-nies BHP [17, p. 47,49], Norilsk Nickel [18, pp. 34–35], Vale [26, pp. 47–49], Rio Tin-to [36, pp. 212–213], Anglo American [37, pp. 252–253], Glencore Xtrata [46, pp. 56– 57], First Quantum Minerals [47, p. 11,12,16], Barrick [48, pp. 39–46], Newmont [49, p. 27], Teck [50, p. 43], and Goldcorp [51]. From the 50 non-ferrous metal mines exam-ined, the type of 43 is known: 26 were surface mines, 10 underground operations, and 7 seven mixed mines. With precious metals the corresponding numbers are 20, 3 and 2. In the non-ferrous metals group, mines that mainly produce copper, nickel, aluminum, and zinc are included. An average non-ferrous mine produces 2123 kt annually. The median is 105 kt and the standard deviation 4996 kt. Mines and sites in this group have the most variation; large mines have the annual production of over 25,000 kilo tonnes, when small mines have an annual production of only a few kilo tonnes. The largest mines mainly produce bauxite and the small mines nickel or copper.
For defining the size of an average precious metal mine, gold mines located in Austral-ia, North- and South America and Africa are studied. The annual production of precious metals is commonly announced in ounces. Similarly with non-ferrous metals, the devia-tion in size is large. The standard deviadevia-tion is 318 kilo ounces (9.0t) and the average production is 283 thousand ounces (8.0 t). The median of the examined gold mines is 155 thousand ounces (4.4 t).
2.3.3 Global production of industrial minerals
Industrial minerals are minerals that are mostly used as feedstock for other industries [52, p. 1]. The most common or valuable industrial minerals are industrial salt, gypsum, sulphur, and diamonds [1, p. 44].
For defining an average industrial mineral mine, the annual productions from 2013 or 2012 (OCP) from some potash, phosphate, salt, and diamond mines owned by Vale [26, pp. 49–50], Rio Tinto[36, p. 213], PotashCorp[53, p. 62] and OCP[54, p. 16] are exam-ined. Industrial mineral producers do not give out as much information about separate mines in English as the other mineral producers do, so the amount of mines studied is smaller than in the other sections. From the batch of 22 mines, similarities to earlier inspections can be noted. The size of the mines varies a lot from very small to very large. Since the price of industrial minerals is not that high, the annual production rates of even the smallest mines are higher than for example for precious metals. Due to this reason it can also be assumed that the trend in mine size is increasing. An average in-dustrial mineral mine has an annual production of approximately 2.9 Mt. The median is 1.9 Mt and the standard deviation 4.0 Mt. With diamond mines the production numbers are a lot smaller than with other industrial minerals. Since annual productions are meas-ured in carats (ct), it is rational to inspect diamonds separately. Seven diamond mines were examined. The average annual production is 6200 ct, the median being 3345 ct, and the standard deviation 7702 ct.
2.3.4 Summary of the average mines
Table 2 summarizes the average productions, medians and standard deviations of all six mine types examined in this Chapter. The results indicate that defining one global aver-age mine is not advisable. However, the inspection of the magnitude of an averaver-age mine for each mine type can be made, even with such a restricted sampling. Common to all inspections is a large deviation in mine sizes. Coal mines, iron mines and industrial mineral mines (excluding diamonds) are generally large mines, whereas other metal mines or diamond mines are significantly smaller. In all mine types there are also very small operations. In addition, as concerns the really large numbers, there is a possibility, that in the annual reports the production of many mine sites together are announced.
Table 2. Summary of average sizes of different mine types.
Mine type Average production ( year) Standard deviation Median Coal mines 10.3 Mt 8.4 Mt 8.23 Mt Iron mines 18.4 Mt 14.8 Mt 13.9 Mt Non-ferrous metals 2123 kt 4996 kt 105 kt Precious metals 8.0 t 9.0 t 4.4 t Industrial minerals 3.0 Mt 4.0 Mt 1.9 Mt Diamonds 6200 ct 7702 ct 3345 ct
must be thought of when planning a mine operation. In this thesis the concentration is merely on the mine’s operation stage.
The operational, also known as the production, stage can vary from a few years to hun-dreds of years. Generally it is not profitable to build up a mine in a location where the resources are poor, but exceptions occur [19, p. 14]. If a really small mine operates in the surroundings of a large mine it can profit from the infrastructure of this mine and be profitable even if not very productive. The lifetime of the mine does not only depend on the production rate and grade of ore, but also the politics and environmental issues have an important role [19, p. 14]. A mine might run out of operational permits before pro-duction would end, or the world price of the product may change in a way that it is not profitable to produce anymore In some sites, for example in Australia, it is common that smaller mines are only operating in an uptrend period and in the downtrend they are closed [56].
Figure 6 presents the estimated operational lifetime of some mines, whose production was earlier under inspection. The annual reports of BHP [17, pp. 26–45] and Vale [26, pp. 60–68] provided information of when the operation was started and when is it esti-mated to end. From these figures the estiesti-mated operational lifetime of a mine was calcu-lated. After the mine’s name, also the main product is listed. The mines marked with yellow are iron mines (Fe), black ones produce coal (Coal), brown phosphate (Ph) and blue other metals such as copper (Cu) or nickel (Ni).
As with the production rate, the deviation between mine lifetimes is quite large, varying from seven years to 154 years of production. The average lifetime of a mine is 45 years, having a standard deviation of 47 years. The median is 39 years. There are not many mines with a really low life expectancy. Normally production for less than 10 years is not very profitable to set up. On the other hand, mines with the life expectancy of over 100 years are not so numerous, either. The mine sites found in the 21st century have lower life expectancy than the ones found in the 20th century. It is reasonable to believe that such deposits, which would produce for over 100 years are not very easily found anymore. The operational lifetime of future mines is most likely between 20 and 40 years.
Figure 6. The estimated lifetime of selected mines [17, pp. 26–45], [26, pp. 60–68]. The mines marked with yellow are iron mines black ones produce coal, brown phosphate
and blue other metals such as copper or nickel.
7 11 14 16 17 20 20 21 25 29 31 32 33 35 35 37 38 38 39 40 43 44 44 45 45 46 46 53 60 61 65 65 68 68 72 72 105 154 0 50 100 150 200 Jangada, Fe Isaac Plains, coal Capao Xavier, Fe Agua Limpa, Fe Voisey Bay, Cu Sossego, Cu Red Dog, Zn Mt. Keith, Ni Urucum, Fe Brucutu, Fe Moatize, Coal VNC, Ni Alegria, Fe Fábrica Nova, Fe Bayóvar, Ph N5, Fe N4W, Fe Araxá, Ph Median Integra Coal, coal Leinster, Ni Segredo, Fe N4E, Fe Average Tamanduá, Fe Abóboras, Fe Caue, Fe Salobo, Cu Cerro Matoso, Ni Capitao do Mato, Fe Cataláo, Ph Cajati, Ph Conceicäo, Fe Sapacado, Fe Thompson, Cu Fazendao, Fe Samarco, Fe Sudbury, Cu
Estimated lifetime of the mine, years Iron Mines
Coal Mines
Phosphate Mines Other Metals
Average & Median
Average 45 years Median 39 years Standard deviation 47 years
2.4 The main operational categories in mining
The mining process from extraction of ore to a processed mineral is different depending on the geography of the mine site, the material mined, the level of the grade, etc. The basic route, however, is similar in all mining operations. The mining process can rough-ly be divided into three different stages: extraction, haulage and processing [24], [39]. The functions in extraction are drilling and blasting and depending on the mine type, topsoil and overburden removal (surface mines) or underground crushing and loading (underground mines). Haulage means the forms of transportation with equipment like trucks, skips and conveyors. Processing differs a lot depending on the material mined. Coal or industrial minerals are hardly processed, while for example copper goes through many processing stages [57]. All operations require supporting activities, which are for example dewatering and road maintenance [58, p. 9]. Underground mining operations also require for example ventilation and backfilling [59, p. 13]. In this study extraction in surface and underground mines is examined separately, and haulage and processing together for both mine types. Figure 7 presents the route of iron from ore to the product in both surface and underground operations [39, p. 7]. Next to each operation, the com-mon equipment used is listed [24, p. 9].
2.4.1 Extraction
The basic functions of extraction are drilling, blasting and digging, and as supporting operations pumping and dewatering [24, p. 9]. Significant factors in choosing the most suitable mining method are the hardness and rate of production of the ore [25, p. 357]. Ores that cannot be mined by mechanical mining machines are called hard rock ores. Most metals are in this group. Soft rocks are, for example, coal, oil shale, salt, and pot-ash [23, p.377]. In this Chapter, some of the most common surface and underground mining methods are briefly introduced.
2.4.1.1 Surface mining methods
The two most common surface mining methods are open cut mining and strip mining [25, pp. 362–365]. In open cut mining the ore body is removed in slices with large rope shovels, hydraulic shovels or excavators. For soft rocks, continuous excavation without drilling and blasting can also be used. In strip mining, the overburden is removed in long strips so that the ore body can be revealed. The strips are moved straight into a previously mined void. This method requires the ore to be close to the surface, as often is for example with coal.
Figure 7. Underground and surface mining processes of iron and typical equipment used in different operational categories, modified from [24, p. 9],[39, p. 7].
2.4.1.2 Underground mining methods
Underground mining methods can be divided into three main groups: caving, stoping, and other methods [25, pp. 366–367, 381]. The caving methods are based on controlled collapse of the rock mass due to gravity, while in stoping the extraction requires stable tunneling. Caving methods are block caving, sub-level caving, and longwall mining. In block caving large low-grade ore bodies can be removed practically as complete blocks. In sublevel caving ore is partly drilled and blasted and just the overburden is caved by gravity. Longwall mining is a technique where the material is excavated in slices with shearers and then conveyed to the surface. In stoping methods a stable void is excavat-ed, which is then filled with material such as tailings or overburden. The most common stoping method is the room and pillar method. As the name implies, only pillars in a regular pattern are left in the cave, while the rest of the ‘room’ is mined. The ore is then excavated laterally so that no drilling and blasting is required. Other underground min-ing methods are new methods or innovative combinations of the previous ones devel-oped to match the unique requirements of some mine sites. An example of such meth-ods is coal seam methane drainage, which utilizes the physical properties of coal.
2.4.2 Haulage
Haulage is required in each step of mining; the ore or overburden is transported from one stage to another, ore is lifted to the surface, etc. [60, p. 1457].The most adequate hauling technique depends on the mining method, distances and geographies in the mine site as well as the abundance of ore resources. Commonly used haulage equipment, are haul trucks, conveyor belts, and hoists, such as draglines or skips. Haulage also includes rail road and marine transport of the processed mineral. In this thesis only the haulage inside the mine site is considered.
2.4.2.1 Haul trucks
The amount of material hauled with loaders and truck haulers is more than with all other extraction systems combined. The size of haulage equipment has increased drastically in the last decades. In 2008 an average truck in an open pit mine had the capacity of 160 tonnes [19, p. 15].The type and size of the hauler depend on the haulage distance and the quantity of the material. With short distances from a few to 120 meters, it is advisa-ble to use a truck dozer, which only pushes the material to the following site, or load and carry equipment such as wheel loaders or hydraulic shovels and mining shovels [29, pp. 912–913,919]. With distances over 120 meters, scrapers or articulated and rear-dump trucks are used. Articulated and rear rear-dump trucks have both on-highway and off-highway applications, of which the on-off-highway is not commonly used in mines due to lower productivity. The off-highway rigid-frame trucks are the primary hauling ma-chines used in mining, with the capacity of 80–325 tonnes. For haulage distances of over ten kilometers haulage wagons are usually used [29, pp. 919–921].
Similar haul trucks are used in both underground and surface mining. In underground mining, however, the circumstances create some limitations. For underground haulage, adapted applications of rear-dump and articulated rear-dump trucks are most commonly used. In underground applications, more than in surface mines the proper ventilation, road maintenance and the optimum cycle must be considered so that the productivity is high and there is no unnecessary traffic in the often narrow roads [29, p. 1149].
The haulers move either with chains or with tires. Tires have a better mobility than chains, but on the other hand, the tires are very liable to wear. A haul truck experiences resistance to motion due to friction, which is called rolling resistance. The main con-tributors to this resistance are the road conditions, the wheel load, and less significantly tire flexing and internal friction [29, p. 914].
2.4.2.2 Conveyor belts
The use of conveyor belts in mining haulage has increased in the last decades. The capi-tal costs between haul trucks and conveyor belts depend a lot on the application, but in
use the conveyor belts are more cost efficient and require less labor and energy. When the production exceeds 1,000,000 t/year, the haulage distances are more than 5 km, the vertical lift is more than 250 meters, and the operation can be expected to continue for at least 7-8 years, it is advisable to build a conveyor belt system. The standard style conveyor belts are sheet belts supported with idler rolls. In applications where there are tighter curves, pipe conveyors or a sandwich belt consisting of two separate belts or a pocket lift application can be used [29, pp. 982–984]. The length of a conveying system can vary from some meters to over 20 kilometers [61].
2.4.2.3 Draglines and skips
Draglines are used in sites of flat geology for transporting load, usually overburden, to a dump point. They are productive, have a life expectancy of over 30 years, and have low operating costs and requirements for labor. The possible scale of work of the dragline is 50 meters over and 65 meters under the working level, and the buckets have a capacity of 125 m3. The efficiency of the dragline depends on the ore’s material composition and production variability. As an average efficiency factor, 70% of the loaders full capacity is used [29, pp. 903–904,910].
A similar hoisting system can be used also in underground applications. For example the LKAB Kiruna Iron mine [62, pp. 4–5] and First Quantum Minerals Pyhäsalmi cop-per mine [45, p. 60] use skips to carry the primary crushed rock to the surface. In Py-häsalmi, one hoist can carry 20 tonnes and in Kiruna 40 tonnes. The skip is powered by an electric motor.
2.4.3 Processing
Minerals processing means upgrading and recovering metals or minerals from ores and transforming them to their purest form. Processing includes many different kinds of fields of science and engineering, which makes it a complicated stage in mining also from the point of view of wear. The stage of processing depends a lot on the mineral; coal or industrial minerals are not processed much, while for example precious metals require several stages of processing. The efficiency of a metallurgical process is de-scribed with two concepts, recovery and grade. Recovery means the amount of valuable material achieved in the concentrate, and grade is the purity of the material. It is im-portant to obtain an optimum balance between these two. High recovery with low grade is not desired [60, p. 1455]. The operational efficiency of the processing units is com-monly very high, reaching 85-90% [56],[63]. Processing can roughly be divided into two phases; comminution and concentration. The Mining Engineering Handbook [60, p. 1457] further classifies processing operations to size reduction, size separation, con-centration, dewatering and aqueous dissolution.
2.4.3.1 Comminution
Size reduction and separation, crushing and grinding the ore are also known as commi-nution. This process has three reasons: to liberate valuable minerals from the ore matrix, to increase the surface area for higher reactivity, and to facilitate the transport of the ore particles between operations. Depending on the material, the comminution circuit has from a few to several stages which, depending on the source, are named as crushing or milling. Most commonly the comminution circuit has at least two stages. Table 3 pre-sents the most common unit operations for different milling stages and the average size of feed material in each operation [15, p. 1461-62]. The percentage of the indicated size is presented in the suffix. For example, f80 means that 80% of the feed material must be of the given size.
Table 3. Unit operations for the stages of comminution, modified from [60, p. 1462] f presents the percentage of the feed of the material in a given size.
Milling stage Typical top size (mm)
Common unit operations
ROM f100=10000 Primary crusher(gyratory/jaw)
Secondary pre-crush
Primary f100=250
f80=50-100
AG/SAG/pebble crusher circuit 2nd/3rd/4th crushing circuits Crusher/ HPCG- circuits
Secondary f100=13 Ball mills
Pebble mills
Tertiary Nominally 0.2 Ball Mill HPGR
Vertical shaft mills Horizontal shaft mills
Primary crushing
The aim of primary crushing is to reduce the size of the run-of-mine (ROM) material for further haulage and processing. In underground operations primary crushing is usually done below the surface in order to minimize the energy consumption in haulage [20, p. 11]. The diameter of the material fed to the crusher is usually between 100 and 1,000 millimeters. For primary crushing, jaw crushers and gyratory crushers are the most commonly used, of which the gyratory crusher is used when feed material input is 1,000 t/h or higher. The jaw crushers are used with lover material input. The crushers can be permanently located, semi-mobile or mobile. Factors affecting the choice of a crusher are: the cost of truck haulage against the cost of the mobility of the station, feeding the crusher, and conveying the crushing product. When crushers are fed with direct truck dumping, the method is simple but might contain long waiting times, which decrease the crusher’s utilization rate. With an apron feeder the crusher can be partially discon-nected from truck dumping, which decreases truck queues and increases the utilization
rate. However, more equipment creates capital and maintenance costs in the mine [60, pp. 1461–1463].
Secondary crushing/ primary milling
When the top size reduces, a different kind of comminution method is used. The autog-enous/semi-autogenous mills (AG/SAG mill) are widely used for grinding due to their ability to comminute the widest range of size (from a diameter of over 100 to 0.1 mm). The comminution is done through impact, attrition, and abrasion breakage of the ore serving as media. In autogenous mills the grinding is done by the ore, while in semi-autogenous mills particles are added to aid the comminution [60, pp. 1471–72]. The commonly used grinding media are forged steel balls. Together with the AG/SAG mill a pebble crusher is often used instead of directly recycling the oversized material. Pebble crusher increases the costs and complexity of the circuit, but on the other hand, it can be used for bypassing the crusher(s) during maintenance. The aim in all comminution pro-cesses is to maintain the stockpile size reasonable, which means that the possible maintenance as well as the load and haul of the material must be thought of in the cir-cuit planning [60, pp. 1466–68].
Tertiary and quaternary crushing/ secondary and tertiary milling
After secondary crushing and grinding, high pressure grinding rolls (HPGR), cone crushers, ball mills or pebble mills are commonly used. The HPGR are used especially with hard minerals. They require more energy than for example cone crusher units (5 MW compared to 750 kW), but the final product is finer than in other milling applica-tions, and the increased efficiency of the whole plant decreases the number of required material handling units [60, p. 1469].
2.4.3.2 Concentration
In concentration the physiochemical properties of the minerals are exploited to separate the ore. Different methods of concentration are flotation, gravity concentration, and magnetic and electrostatic concentration [60, p. 1457].
Flotation
In flotation, air bubbles which collect hydrophobic particles are generated on the surface of the aqueous slurry formed of oil water and minerals. Flotation is a very common pro-cessing method, especially for metals. The hydrophobic effect is created with polariza-tion, and the effect can be increased with addition of chemicals. The particles that re-main completely wetted stay in the solution [60, p. 1517].
Gravity concentration
In gravity concentration the different densities of minerals are utilized, i.e., heavy min-erals are separated from the lighter gangue. Separation can be done either with relative or absolute gravity separation. In relative gravity separation a large difference in the densities is required, while in absolute gravity separation a gravity intermediate is used so that the difference in densities does not need to be so large. In magnetic and electro-static concentration, the electrical conductivity and magnetic susceptibility of the min-erals are utilized [60, p. 1457,1507].
Dewatering and aqueous dissolution
Many of the minerals processing operations are conducted in aqueous solutions. With the help of thickeners and filters, water can be separated from minerals. Metals can also be separated from the ore by dissolving them [60, p. 1457].
2.5 Energy consumption in the mining industry
In this Chapter, the energy consumption in the global mining industry is examined. First, the energy consumption and emissions of large mining companies are studied and estimated how much energy is used in producing one tonne of ore. Second, the energy distribution between operations of surface and underground mining is reviewed. From the energy distribution between surface and underground mines, a summary is made and compared to the global framework. As in earlier studies, the operations are divided into extraction, haulage and processing. In addition to these three operations, the group of supporting activities is examined.
2.5.1 Energy consumption of some large mining companies
The total energy consumption in the world in 2013 was 8979 Mtoe [10]. The share of mining in the total consumption is approximately 5% globally[4]–[6], which corre-sponds to 450 Mtoe or 18,840 PJ. Of the total global energy consumption, 65% is from burning fossil fuels [10], the use of which is very common also in the mining industry. In mining company Vale’s [60 p.80 ] production, the portion of fossil fuels was 70%, and in BHP Billinton’s production [65, p. 25] 55% of the total energy use. The use of fossil fuels is relatively higher in the developing industrial countries [10] such as China and India.
In addition to the energy consumption, the mining sector is a large emitter of green-house gases (GHG). The main sources for GHG emissions are combustion of diesel fuels during mining activities and electricity generation [66][65, p. 26]. Norgate et al. [67] suggest that even 50% of the GHG emissions in mining are due to the loading and hauling operations. The emissions can be divided into direct and indirect emissions,
from which direct emissions are straight consequences of activities. These emissions can also be divided into three different areas known as scopes: scope one includes all indirect emissions, scope two indirect emissions from consumption of purchased ener-gy, and scope three all other indirect emissions [68]. The GHG emissions are measured with a carbon equivalent (CO2e), which evaluates the emissions according to their glob-al warming potentiglob-al [69].
Table 4 lists the annual energy consumption and greenhouse gas emissions of some mining companies in 2013: BHP Billiton [17][65, p. 25], Vale [26][64, p. 79], Rio Tinto (RT) [36] [70, p. 45], Anglo American (AA) [37, pp. 251–253][71, p. 17], Glencore Xtrata (GX) [46, p. 13] and Freeport McMoran (FM) [72][73, pp. 14–20]. As additional information, the geographical location as well as the main operations and main products mined are reported. The GHG emissions are emissions of scope 1 and 2. The energy consumption and GHG emissions are divided by the annual production in order to ob-tain the corresponding number per produced tonne (pt).
Table 4. Energy consumption and GHG emissions of large mining companies [17], [26], [36], [37, pp. 251–253], [46, p. 13], [64, p. 79], [65, p. 25], [70, p. 70], [71, p. 17], [72, pp. 14–20], [73]. Company Location of main opera-tions Main products Produc-tion Energy consumption GHG emissions (CO2e)
Mt/year PJ/year MJ/pt Mt/year Mt/pt
BHP AU, ZA Fe, Cu (oil) 296 325 1097 22 0.16 Vale BR, AU Fe, 370 0.15 0.0004 14 0.04 RT CA, EU, AU Al, Cu, Fe Di 301 483 1605 83 0.27 AA ZA, AU, MZ Fe, Cu, Coal 131 63 477 9 0.07 GX EU, US, CA Cu, Ni, Coal 250 285 1139 26 0.16 FM US, CA Cu Au (oil) 296 98 1097 6 0.16
Table 4 indicates that both energy consumption and emissions of larger companies are high. The total annual energy consumption of BHP Billiton and Rio Tinto corresponds to 25–30% of the total annual energy consumption in Finland in 2013 [74]. When inves-tigating the estimated energy consumptions/produced tonne it is noticed that the energy consumption is very case dependent. For example, metals which require many stages of processing (copper, precious metals, aluminum), also require more energy, while coal operations cope with less. Also fewer large operations are more efficient than many small. This is one of the reasons for the low numbers of Vale. Other reasons might be
lot of its own energy and the annual report reports only the bought energy. If Vale is excluded from the study, the energy consumption/produced tonne varies from 477–1605 MJ/pt. Coal company Shenhua [35, p. 18][75, pp. 93–94] and gold company Barrick [76] presented their energy consumption/produced tonne directly in their annual re-ports. The number for Shenhua is only 1.38 MJ/pt while for Barrick it is 274 MJ/tonne produced. In the American Bandwidth Study [24] the total energy consumption in min-ing was reported to be approximately 2460 MJ/tonne of ore produced (2713 tons). The greenhouse gas emissions of the mining companies vary from 6 to 83 Mt annually. As a comparison, the GHG emissions of Finland where 64 Mt in 2012 [77]. The GHG emis-sions per tonne produced vary from 0.04–0.27 Mt CO2e.
2.5.2 Energy distribution in surface mining operations
Figure 8 presents the energy consumption in different surface mining operations. The numbers are obtained from a report comparing the energy use of several surface mines made by Canadian Industry Program for Energy Conservation [58]. Figure 8 illustrates all the individual operations and categorization to the main operations: extraction, min-erals processing, haulage and supporting activities. To illustrate different categories the following, colors are used in Figure 8: operations in red are a part of extraction, blue indicates processing, green haulage, and purple supporting activities.
From the categories it can be noted that processing requires almost half of the total en-ergy (49%), supporting activities and haulage both a fifth (19 and 21%), and extraction only a tenth (11%). The largest individual energy consumer in surface mining opera-tions is other processing (28.9%). This category includes the different kinds of concen-tration processes described in Chapter 2.3.4. The second largest individual energy con-sumer is grinding (16.1%). After processing operations, the largest energy concon-sumer is transport; waste rock transport (10.7%) and ore transport (8.5%).
2.5.3 Energy distribution of underground mining operations
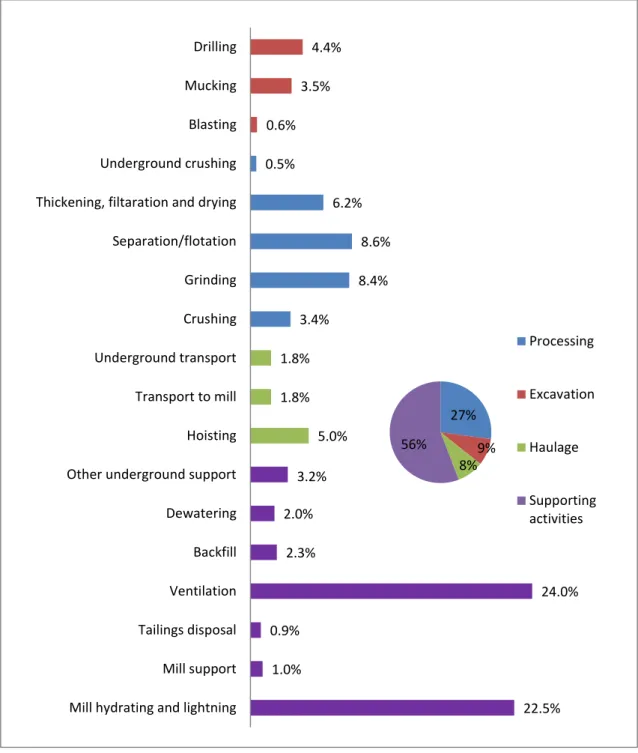
Figure 9 displays a similar investigation for underground mines. The results are averag-es based on the information provided by the report made by the Canadian Industry Pro-gram for Energy Conservation [59]. As in Figure 8, the energy consumption percent-ages of individual operations and the total energy consumption of the categorized groups are presented. The colors used in the Figure 9 are the same as in Figure 8: opera-tions in red are a part of extraction, in blue processing, green haulage, and purple sup-porting activities.
Figure 8. Distribution of energy consumption in surface mining, modified from [58].
In underground activities, a large part of the energy consumption goes to supporting activities; the most energy is consumed in ventilation (24%) and mill hydrating and lighting (22.5%). In total, the supporting activities account for over a half (56%) of the total energy consumption. When examining the actual mining operations, the results are very similar to the surface mine numbers; the most highly energy-consuming operations are the processing stages like separation, grinding, crushing, and filtration. The total energies used in extraction (8%) and haulage (9%) are quite the same as in surface op-erations. 5.35% 4.66% 5.03% 1.08% 4.33% 8.53% 10.66% 4.03% 16.09% 28.92% 1.12% 1.54% 2.12% 1.94% 0.83% 1.38% 2.39% Tailings Process water Other plant Dewatering Mine support Transport Waste rock transport Crushing Grinding Other processing Waste rock drilling Waste rock blasting Waste rock digging Waste rock handling Drilling Blasting Digging 11% 49% 19% 21% Excavation Processing Haulage Supporting activities
![Figure 1. Mines and mine sites in the world [22]. Blue and green points demonstrate exploration sites and red points producing mines](https://thumb-ap.123doks.com/thumbv2/123dok/3863639.2498359/14.892.169.812.134.414/figure-mines-sites-points-demonstrate-exploration-points-producing.webp)
![Figure 2. World production of minerals in 2012 [1, pp. 38–39] (natural gas and petro- petro-leum excluded)](https://thumb-ap.123doks.com/thumbv2/123dok/3863639.2498359/16.892.170.808.357.692/figure-world-production-minerals-natural-petro-petro-excluded.webp)
![Figure 3. Estimated market value of the mining sectors: World production numbers are from 2012 [1] and the price estimations from June 2014 [28] (natural gas and](https://thumb-ap.123doks.com/thumbv2/123dok/3863639.2498359/17.892.216.764.98.436/figure-estimated-market-sectors-production-numbers-estimations-natural.webp)
![Table 4 lists the annual energy consumption and greenhouse gas emissions of some mining companies in 2013: BHP Billiton [17][65, p](https://thumb-ap.123doks.com/thumbv2/123dok/3863639.2498359/33.892.165.822.570.888/table-annual-energy-consumption-greenhouse-emissions-companies-billiton.webp)
![Figure 8. Distribution of energy consumption in surface mining, modified from [58].](https://thumb-ap.123doks.com/thumbv2/123dok/3863639.2498359/35.892.173.806.106.821/figure-distribution-energy-consumption-surface-mining-modified.webp)
![Table 5. Summary of the energy distribution in surface and underground mines[58],](https://thumb-ap.123doks.com/thumbv2/123dok/3863639.2498359/37.892.164.783.306.521/table-summary-energy-distribution-surface-underground-mines.webp)
![Table 8. The fuel consumption of a haul truck [94]](https://thumb-ap.123doks.com/thumbv2/123dok/3863639.2498359/46.892.169.817.142.528/table-fuel-consumption-haul-truck.webp)
