A QUADTREE ORGANIZATION CONSTRUCTION AND SCHEDULING METHOD FOR
URBAN 3D MODEL BASED ON WEIGHT
Chunyu Yao a Guihui Peng aYuanlong Song a Mengqi Duan a
a Aerial Photogrammetry and Remote Sensing Bureau (277014866@ qq.com)
KEY WORDS:
3D Model, Digital City, Quadtree, LOD, Scheduling, RenderingABSTRACT:
The increasement of Urban 3D model precision and data quantity puts forward higher requirements for real-time rendering of digital city model. Improving the organization, management and scheduling of 3D model data in 3D digital city can improve the rendering effect and efficiency. This paper takes the complexity of urban models into account, proposes a Quadtree construction and scheduling rendering method for Urban 3D model based on weight. Divide Urban 3D model into different rendering weights according to certain rules, perform Quadtree construction and schedule rendering according to different rendering weights. Also proposed an algorithm for extracting bounding box extraction based on model drawing primitives to generate LOD model automatically. Using the algorithm proposed in this paper, developed a 3D urban planning&management software, the practice has showed the algorithm is efficient and feasible, the render frame rate of big scene and small scene are both stable at around 25 frames.
1. INTRODUCTION
With the rapid development of traditional mapping industry technology, the construction and application of 3D digital city become more widely, Has been developed to a city's 3D application from a single cell or small scene roaming browsing. The rapid development of geographic information acquisition technology, explosive growth of UAV technology, high-speed progress of Lidar technology, make Urban 3D model data acquisition methods become more and more diversified and convenient. Both the model accuracy and the model simulation have made great progress, also caused another problem that attract people's attention: The dramatic growth of data (DAI,2013;DENG,2013). Even the data a fine urban building model is likely to reach hundreds of megabytes. So even with the highly developed computer hardware, massive model data scene organization scheme and data scheduling strategy are still worthy of study.
2. QUADTREE INDEX ORGANIZATION FOR URBAN 3D MODEL BASED ON WEIGHT
Spatial data organization is a reasonable planning of space data and the establishment of spatial index, to improve the retrieval efficiency of spatial data (YAN,2001). The number of urban architectural models in the 3D digital city scene is huge, structure is complicated, it is unrealistic to load all the city models into the computer's Random Access memory in real-time scene rendering, it is necessary to query the eligible model data and load computer Random Access memory quickly. In order to complete the fast query of Urban 3D model, the spatial indexing of data is an indispensable step. Spatial Index of Urban 3D Model is a data structure arranged according to certain rules according to the location and shape of the Urban 3D model object. Contains summary information for spatial 3D models, such as model ID, minimum bounding box.
The common spatial index including grid index, B-Tree, R-Tree, quadtree, octree and so on (Zhu,2006). Terrain, images and other spatial data organization mainly based on the grid division, but because of the irregularity of building model, grid division produces a lot of division at the grid boundary. B-Tree is a one-dimensional index, can not process two-one-dimensional and multidimensional spatial data. R-Tree is natural expansion of B-Tree in multidimensional space, suitable for multi-dimensional space query, but due to the occasional spatial data distribution, the nodes are easy to overlap, will produce multiple branch inquiries in spatial queries, reduce the efficiency of space query
largely, so it’s not suitable for randomly distributed building models.
The quadtree is a kind of indexing mechanism that belongs to the spatial partitioning organization index structure (Pajarola R,1998), it’s data storage structure is a hierarchical tree structure, which is widely used in 3D digital city because of the higher query efficiency. The basic idea is: quarter the range of 3D digital city to get four connected space ranges, then quarter this four space ranges respectively, each space range gets four connected space ranges. End until the quadtree reaches the maximum number of layers or the sub-node's outer bounding box is less than the required minimum external bounding box. Then insert the model object information into the quadtree according to the external bounding box information.
The traditional quadtree construction method can solve the problem of 3D digital city model query efficiency, retrieve the model from the geographic location quickly, but the traditional quadtree does not take the complexity of the urban model into account. Especially in the 3D digital city rendering. Landmark building needs farther visual distance, loaded earlier. This paper takes the visualization requirements and complexity of urban models into account, proposes a Quadtree construction method for Urban 3D model based on weight.
In order to make important 3D city models be loaded earlier, get farther visual distance, we set different weights for different Urban 3D model. According to the model's geographic location, external bounding box, number of vertices, texture number and size get the weight of the model according to different weight ratio and certain rules, divide the model rendering importance level into low, intermediate, advanced, top four levels. In addition to calculating model weights automatically, the weights of certain models can be artificially developed if necessary. The rendering level of the model is not immutable, can be developed based on the scene. But the low rendering level this paper developed is generally the urban parts which have small size, small number of vertices, simple texture, this kind of model is always unloaded earlier, and loaded last. The top level model is generally an extremely important architectural model, is loaded most of the time.
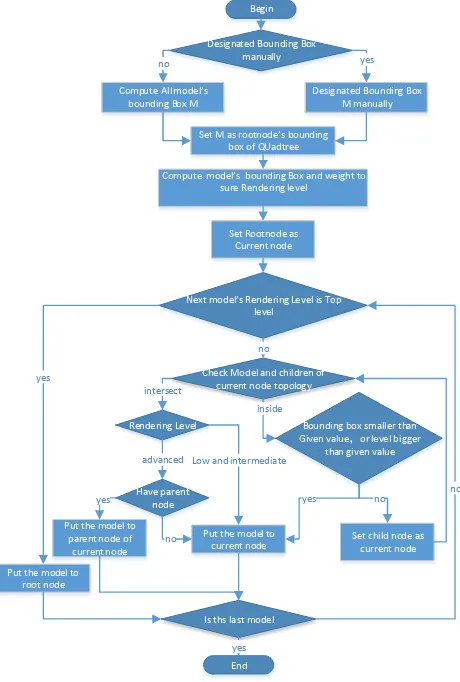
Quadtree construction steps for Urban 3D model based on weight showed in Figure 1:
1) Calculate an bounding box that can contain all models, or specify the required external bounding box manually, as an external bounding box for the quadruple root node.
2) Traverse all the 3D city models, calculate the model's external bounding box and rendering level. Take the root node as the node that is currently needed to be inserted, if the rendering level of the model is top level, add the model to the current node directly. The International Archives of the Photogrammetry, Remote Sensing and Spatial Information Sciences, Volume XLII-2/W7, 2017
ISPRS Geospatial Week 2017, 18–22 September 2017, Wuhan, China
This contribution has been peer-reviewed.
https://doi.org/10.5194/isprs-archives-XLII-2-W7-977-2017 | © Authors 2017. CC BY 4.0 License. 977
Otherwise, detect the topological relationship between the external bounding box and the sub-node of the current node. If the external bounding box intersects the sub-node external bounding box, and the rendering level of the model is low and intermediate, add the model to the current node. If the external bounding box intersects the sub-node external bounding box, the rendering level of the model is advanced, and has a parent node, add the model to the parent node, or add the model to the current node. If the model is within a child node, set the child node as the current node, recursive step 2, until the sub-node external bounding box is less than the specified value or the number of layers is greater than the specified value.
The quadtree construction method based on weight presented by this article, can retrieve the model data in 3D digital city rendering quickly, reduce the burden of memory and graphics, and taking the complexity of the urban model into account. The 3D city model is divided into different rendering levels, provides underlying support for 3D digital city rendering scheduling.
Begin
Designated Bounding Box manually no
Compute All model’s bounding Box M
Is ths last model Set M as rootnode’s bounding
box of QUadtree
yes
Compute model’s bounding Box and weight to sure Rendering level
Set Rootnode as Current node
Next model’s Rendering Level is Top level
Set child node as current node Check Model and children of
current node topology intersect
Have parent node Rendering Level
Low and intermediate advanced
yes inside
Bounding box smaller than Given value,or level bigger
than given value
no yes
Put the model to parent node of current node
no Put the model to current node
yes no
End
no
Put the model to root node
yes
Designated Bounding Box M manually
Figure 1. Quadtree construction process
3. SCHEDULING AND RENDERING METHOD FOR URBAN 3D MODEL
3.1 Automatic generation of LOD model
LOD technology allot resource for model rendering, reduce the details of non-critical objects according to the location and importance of the nodes in the 3D model in the rendering scene to get high rendering efficiency(Zhu, 2005). At present, most of single-dimensional 3D model the data providers provided has no LOD model, but 3D digital city rendering is inseparable from the
support of LOD technology, therefore, the automatic generation of LOD model is a problem that has to be studied(Ahmed, 2013). The data structure of the urban 3D model data is mainly composed of vertex data and texture data, attribute information is ignored because the participation of attribute information in the system rendering is small. LOD model automatic generate is the process of in fact generate sub-fine model, medium fine model, rough model by the fine model automatically. This article is based on actual requirements, analyze the realization of large scale model scheduling algorithm based on continuous simplified LOD method, build three LOD models for every building. Fine model is the original model of the urban 3D model, using original vertex data and original texture data; sub-fine model is the intermediate model, using original vertex data and compressed texture data; rough model using the vertex data of outer bounding box based on model drawing element, and a rough model with color based on the color array of texture averages(Theng, 2013; Batty M, 2002 ).
The traditional rough model is generated by acquiring the model's outer bounding box and generating the white mold of the bounding box. This method reduced data volume, but the 3D model has become a rectangular box without the original contour feature. The focus of this paper is to find a suitable algorithm that can make the rough model keeps the original contour and color, reduces detail features as much as possible, and simplify the model by maximum degree. In this paper, an algorithm for extracting bounding box extraction based on model primitive is proposed.
The urban 3D model is made up of drawing primitives, Cycle through the drawing primitive of the model and get an external bounding box in the process of generating a rough urban model, gets the texture information of the drawing primitive, find the average color of the texture information, assign an average color value to the outer bounding box of the primitive. Gets the set of outer bounding boxes for all drawing primitives after traversing all the bounding box of drawing primitives, merge these bounding boxes to get the rough mode of the final 3D model.Figure 2-- Figure 4 is show three LOD models.
Figure 2. fine model
Figure 3. medium fine model
Figure 4. rough model
The International Archives of the Photogrammetry, Remote Sensing and Spatial Information Sciences, Volume XLII-2/W7, 2017 ISPRS Geospatial Week 2017, 18–22 September 2017, Wuhan, China
This contribution has been peer-reviewed.
3.2 Rendering and scheduling for Urban 3D model based on weight
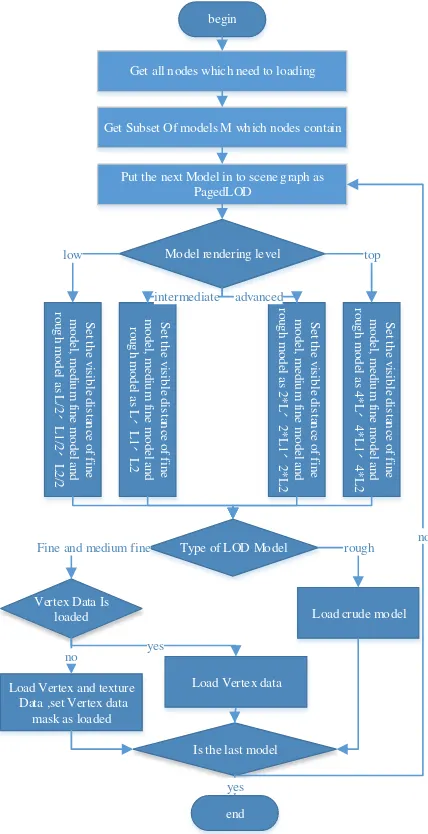
Spatial data scheduling is to determine when to use what way to call or call out a piece of spatial data. In the open source OpenSceneGraph (osg), some classes are designed and encapsulated based on dynamic scheduling technology, meet the 3D massive data model dynamic scheduling needs to a certain extent(FENG , 2011; YANG,2000). But for the massive urban 3D model, simply use OSG paging database technology, will cause the scene node tree to be too large. Which results in lower efficiency when traversing scene trees, even cause system crashes. In this paper, we use the urban model quadtree built in Section 2, proposed a dynamic scheduling algorithm for massive 3D city model based on quadtree and model weight. Figure 5 illustrates this process.
1)When the entire scene needs to be updated, pick a model according to spatial quadtree structure based on model weights and current point of view built in section 2, take all the lowest-level quadtree nodes that are less than the current viewpoint distance and all the corresponding upper nodes, get the model data contained in all quadtree nodes as the currently visible model subset M.
2)Add every model entity to system scene tree as a PagedLOD. Set the visible distance of fine model, medium fine model and rough model as L, L1, L2 respectively if the model rendering
weight is intermediate; Set the visible distance of fine model, medium fine model and rough model as L/2, L1/2, L2/2
respectively if the model rendering weight is low level; Set the visible distance of fine model, medium fine model and rough model as 2*L,2*L1, 2*L2 respectively if the model rendering
weight is advanced; Set the visible distance of fine model, medium fine model and rough model as 4*L,4*L1, 4*L2
respectively if the model rendering weight is top level.
3)Traversing the model subset M model to determine the model weight and the current viewpoint distance, if the model is satisfied to load fine model and medium fine model, but no vertex data is loaded, then load fine vertex and texture data, if vertex data is already exist, load texture data only, and mark the model vertex data as loaded. Load rough mode data if the roughing condition is satisfied.
4. EXPERIMENT ANALYSIS
Based on the study of this paper, as Xijing Hospital is building a hospital intelligent management system, we developed a set of ground and underground two three-dimensional linkage city planning and management system, the system utilizes 3D visualization technology on the basis of two - dimensional city information system, combine DOM, DEM, Fine 3D model, in order to complete intuitive, putative, interactive, all-round display of the status of urban construction, show the city real scene from the software by scientific means, provide decision-making functions for urban planning and municipal administration, reduce the loss caused by the timely interaction of information.
In order to verify the feasibility of the algorithm in this paper, we select two sets of data to do the test, a set of data is Xijing hospital test data which is relatively small, the other is Korla digital city data which volume is larger. As the picture shows.
1)Xijing Hospital has a small amount of data, but the data contains terrestrial buildings and terrain data DEM,DOM and underground pipeline data. Hospital pipeline length is 105.428 kilometers, the number of pipeline points is 12053.Collect texture data volume is 30GB, 5669 real photos. Establish 562 fine models.
begin
Get all nodes which need to loading
Get Subset Of models M which nodes contain
Model rendering level Put the next Model in to scene graph as
PagedLOD
Figure 5. the process of scheduling for Urban 3D model based on weight
2)Korla data volume is large, the data covers an area of 300 square kilometers, Korla area is divided into two parts: the old city and the planning area, texture data more than 400GB,there are more than 800,000 urban 3D model data, contains more than 60000 fine models.
The test machine is ordinary PC, the configuration parameters are: CPU: Intel(R)Core(TM)i5-3470, 4-core 3.20GHz,RAM: 8G, Video card: NVIDIA GeForce GTX 960, graphics memory: 2G, Operating system: WIN7 64-bit operating system.
Figure 6. The efficacy of Xijing hospital Data rendering The International Archives of the Photogrammetry, Remote Sensing and Spatial Information Sciences, Volume XLII-2/W7, 2017
ISPRS Geospatial Week 2017, 18–22 September 2017, Wuhan, China
This contribution has been peer-reviewed.
Figure 7. The efficacy of Kuerle Data rendering
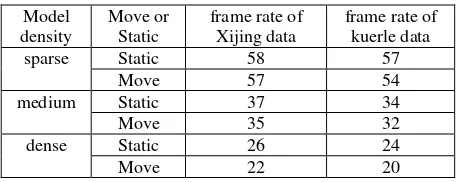
The efficiency of 3D applications can be measured by frame rate, which represents the number of times the system can draw every second while the scene is being processed. The higher the frame rate, the more smooth the rendering effect. In general, it is acceptable that the frame rate of three-dimensional application is 25 or so. As the algorithm design the system calculation is large when the scene moves, so the frame rate is slightly different when the scene moves and rests, we will test the frame rate when the scene move and static simultaneously. Some places of the 3D digital cities are densely populated, in some places the building is scarce, the rendering pressure of the two regions is quite different under the same conditions. This article will divided the region into three areas for testing: Model dense area, Model medium area, Model sparse area. we divided the area into dense areas if each frame rendering more than 4 million, medium area if each frame rendering is 2 million to 3 million, sparse area if each frame rendering under 2 million. The final test results are shown in the table 1. The frame rate listed in the table is the average frame rate obtained by sampling 20 times for each region and state.
Table 1. Two frame rate statistics Model
density
Move or Static
frame rate of Xijing data
frame rate of kuerle data
sparse Static 58 57
Move 57 54
medium Static 37 34
Move 35 32
dense Static 26 24
Move 22 20
As the table shows, It is easier to render in a sparsely populated place, it can be maintained at 50 or more frame rate in any case. It can be maintained at 30 or more frame rate where the model is generally dense, basically there is no pressure to render. The gap begins to widen between the frame rate of still and moving where model is more intensive. It can be maintained at 24 or more in the still scene when both in large scenes and small scenes, when the scene is moving, the frame rate is reduced by 4,but still able to maintain more than 20 frames. Through the above test we can see that the proposed algorithm can be used to organize the 3D model of mass city, to keep the system to maintain more than 20 frame rate.
5. SUMMARY AND OUTLOOK
This paper proposes a Quadtree construction and scheduling rendering method for Urban 3D model based on weight, the method assigns weights according to the different characteristics of the city model, divide different levels by weight, and then the
Quadtree is organized and dispatched. And divide the data into 3 layers of LOD can improve the scheduling efficiency effectively. This research achieved certain results, also developed a practical application system, but there are some areas for improvement, such as, the frame rate of moving scene is lower than still scene, the LOD model can generate more hierarchical models. With the oblique photography technology increasingly mature, the mixed rendering of tilting photography 3D data and urban 3D model is also a development trend, is the follow-up needs of this study.
REFERENCES
DAI Xuefeng , XIONG Hanjiang, GONGJianya. A Multrtexture Automatic Merging Approach for the 3D City Models [J]. Geomatics and Information Science of Wuhan University, 2013,40(3):347-352
DENG Shi-jun,WANG Yong-jie,DOU Hua-cheng,DANG Zeng-ming,CHENG Liang-yong. Dynamic scheduling of three-dimensional massive model data based on databasepager [J]. Science of Surveying and Mapping,2013,38(4):97-100
YAN Chao – de, ZHAO Xue – sheng. The Review of Spatial Indexes in GIS[J]. Geography and Geo-Information Science,2001,20(4):23-27
Zhu Qing, Gong Jun. An Improved Full 3D R2-Tree Spatial Index Method[J]. Geomatics and Information Science of Wuhan University, 2006, 31(4):340-343
Pajarola R. Large Scale Terrain Visualization Using the Restricted Quadtree Triangulation[C]/ / Proceedings Vi-sualization’98,North Carolina,USA,1998.
Zhu Qing, Gong Jun, Du Zhiqiang, et al. LODs Description of 3D City Model[J]. Geomatics and Information Science of Wuhan University, 2005, 30(11):965-969
Ahmed, I.,Khoo, E.H,Li, E. et al.Efficient Modeling and Simulation of Graphene Devices With the LOD-FDTD Method[J].IEEE microwave and wireless components letters,2013,23(6):306-308.
Theng Huat Gan,Eng Leong Tan.Unconditionally Stable Fundamental LOD-FDTD Method With Second-Order Temporal Accuracy and Complying Divergence[J].IEEE Transactions on Antennas and Propagation,2013,61(5):30-38.
Batty M and Smith A. Virtuality and cities: Definitions, geographic, designs [C] //Peter Fisher and David Unwin(Eds.) , Virtual
FENG Yan, GUO Rong-huan, WANG Min-qi, GU Xing-ye. Data organization and management of three dimensional city model [J]. Science of Surveying and Mapping,2011,36(1):215-217
YANG Bi-sheng, LI Qing-quan, MEI Bao-yan. Study of the Visualization of Three-Dimension Urban Model [J]. ACTA
GEODAETICA et CARTOGRAPHICA
SINICA,2000,29(2):149-154
The International Archives of the Photogrammetry, Remote Sensing and Spatial Information Sciences, Volume XLII-2/W7, 2017 ISPRS Geospatial Week 2017, 18–22 September 2017, Wuhan, China
This contribution has been peer-reviewed.