ANALYSIS OF SPATIAL PATTERN AND INFLUENCING FACTORS OF E-COMMERCE
Yaxuan Zhanga, Jiangping Chena∗, Shuming Zhanga
a
School of Remote Sensing and Information Engineering, Wuhan University, Wuhan, China
Commission IV, WG IV/3
KEY WORDS:E-commerce, spatial pattern, spatial autocorrelation, influencing factor, geographical weighted regression
ABSTRACT:
This paper aims to study the relationship between e-commerce development and geographical characteristics using data of e-commerce, economy, Internet, express delivery and population from 2011 to 2015. Moran’s I model and GWR model are applied to analyze the spatial pattern of E-commerce and its influencing factors. There is a growth trend of e-commerce from west to east, and it is obvious to see that e-commerce development has a space-time clustering, especially around the Yangtze River delta. The comprehensive factors caculated through PCA are described as fundamental social productivity, resident living standard and population sex structure. The first two factors have positive correlation with e-commerce, and the intensity of effect increases yearly. However, the influence of population sex structure on the E-commerce development is not significant. Our results suggest that the clustering of e-commerce has a downward trend and the impact of driving factors on e-commerce is observably distinct from year to year in space.
1. INTRODUCTION
In recent years, e-commerce is developing by leaps and bound-s. Its profound influence not only penetrates in all trades, but also becomes prevalent among many regions (Hao et al., 2016). Meanwhile, its spatial distribution pattern is changing every year dramatically and there are many other factors promoting the de-velopment of e-commerce (Tang, 2015). According to the lat-est data from the China Electronic Commerce Research Center, we know that the amount of online shopping users in China is up to 360 million and the turnover has already been more than $350,000,000,000 (Zhu et al., 2016). In other words, it accounts for 10%of retail sales (Xu, 2013).
Sendy Farag etc. reported investigation of the spatial distribu-tion of Internet users and online buyers in the Netherlands for the time period 1996-2001 and the impact of residential environment and shop accessibility on e-shopping (Farag et al., 2006). Yuko Aoyama analyzed how sociospatial factors, such as urban form, consumer preference, and cultural attributes shape the patterns of E-commerce in Japan (Aoyama, 2003). At yet, few researcher-s have examined Chineresearcher-se e-researcher-shopping from a researcher-spatial perresearcher-spective and they seldom concern the impact of spatial variables on e-shopping. Consequently, we try to include space-time accessibil-ity measures in our analysis.
In this paper, we apply some research methods of GIS, studying e-commerce not only in traditional time dimension, but also in s-pace dimension. Through combining datasets of express delivery, economies, Internet and population, we further observe the inter-action between e-commerce and above data. In this way, we are able to build a more objective model of e-commerce. The study of this paper provides practical guidance for conducting e-shopping and provides innovative methods for similar research.
∗Correspondingauthor ([email protected])
2. DATA AND METHODOLOGY
2.1 Data
The data in the facets about E-commerce, express delivery, econ-omy, Internet and population from 2011 to 2015, classified by province (excluding Taiwan, Hong Kong and Macao), e.g. “the turnover of E-commerce”, “the provincial GDP”, “the level of consumption”, “the number of Internet users”, “Internet popu-larity rate”, “the turnover of express”, “the number of express goods”, “ the number of express outlets”, “the provincial popu-lation”, “the provincial sex ratio”, “the structure of education in population” and “the structure of age in population”.
2.2 Methodology
In this paper, we apply the global spatial autocorrelation calcu-lated by using Morans model to study the overall spatial pattern throughout mainland, which can evaluate whether data clusters in space. On this basis, we use local Morans model to measure the spatial correlation between each province and the surrounding ar-eas. Next we use principal component analysis to get the compre-hensive factors. Then we set these factors as the variables of the GWR model and analyze the intensity of each factors influence in different regions.Furthermore, we can analyze the tendency of the e-commerce development and make scientific prediction to the objective development spatial pattern.
2.2.1 Spatial Autocorrelation Analysis Moran ’s Iis a sta-tistical index which is used to make spatial autocorrelation analy-sis, proposed by Moran in 1948 (Wang and Xu, 2011). The main function of this index is to reveal the overall spatial distribution agglomeration of e-commerce and to explain whether the spatial autocorrelation exists or not. The formula is defined as follows:
I=n∗ Pn
i Pn
jwij∗(xi−x)(xj−x)
(Pni Pnjwij)∗Pni(xi−x)
2 (1)
The formula of its expected value is:
The range ofMoran ’s Iis[−1,1], the greater the absolute value, the higher the degree of correlation and the spatial autocorrela-tion of the provincial e-commerce development. WhenMoran ’s I< E(I), there is a negative correlation between provinces. WhenMoran ’s I> E(I), there is a positive correlation between provinces. However we also need to use the standardizedZ val-ue to test whether the difference has statistical significance. Ac-cording to the normal distribution test value, if the absolute value ofZ value is greater than1.65(1.96), when the normal distri-bution function at0.05(0.01)level, it shows that the attribution between regions has significant positive spatial autocorrelation; similarly, if the absolute value ofZvalue is less than1.65(1.96), it indicates that the attribution between regions has a significant negative spatial autocorrelation.
However, global spatial autocorrelation can only reflect wether there are spatial clustering effects of the e-commerce develop-ment, and it isn’t able to describe which provinces have high value aggregation or low value aggregation (Xiao, 2014). Lo-cal spatial autocorrelation can find e-commerce geographiLo-cally aggregate in which specific provinces and in which specific pat-tern (high-high or low-low). The localMoran ’s Iof provincek
is calculated as:
M oran′s I
k=
(xk−x)
Pm
k=1(xk−x) 2 ∗
m X
h6=k W′
kh(xh−x) (3)
The expected value of localM oran′s I(E
k(Ik))is:
Ek(Ik) =−
m X
h=1
Wkh/(m+ 1) (4)
WhenM oran′s I
k> Ek(Ik), it can be deduced that there exists
a similar e-commerce agglomeration phenomenon in the neigh-bor areas of province k, namely the existence of a positive local spatial autocorrelation. And whenM oran′s I
k < Ek(Ik), it
can be deduced that the e-commerce in province k and its neigh-bor areas differ greatly, that is, there is a tendency of negative local spatial autocorrelation.
2.2.2 Principal Component Analysis Principal component
analysis (PCA) is mainly based on the feature analysis of covari-ance matrix to achieve the purpose of maintaining the maximum contribution of data sets to variance and reducing the dimension of data (Wang et al., 2014). Namely, in the case of minimal loss of data information, we come up with some component by reduc-ing the dimension of the original indicators into one or several comprehensive factors. The amount of the selection of the prin-cipal component is not only to meet the purpose of reducing the dimension of data, but to integrate as much information as pos-sible. Usually, we use a criterion that the cumulative variance contribution rate is not lower than a threshold (e.g. 85%) to de-termine the number of principal components (Wang et al., 2014).
2.2.3 Geographical Weighted Regression Through an
ex-tension of the traditional regression model, geographically weighted regression(GWR) can make the parameters be locally estimated. The formula of GWR is as follows:
yi=β0(ui, vi) + X
k
βk(ui, vi)xik+ǫi (5)
According to formula(5), (ui, vi)represents the spatial
coordi-nates of i-th sample points; βk(ui, vi) represents the function
value; ε is random error. In this formula, the kernel function
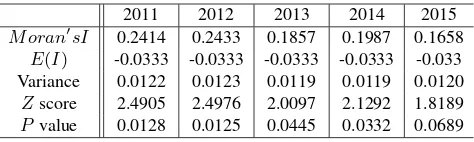
2011 2012 2013 2014 2015
M oran′sI
0.2414 0.2433 0.1857 0.1987 0.1658
E(I) -0.0333 -0.0333 -0.0333 -0.0333 -0.033 Variance 0.0122 0.0123 0.0119 0.0119 0.0120
Zscore 2.4905 2.4976 2.0097 2.1292 1.8189
Pvalue 0.0128 0.0125 0.0445 0.0332 0.0689
Table 1. The result of global Moran’s analysis
and kernel bandwidth are the most important parameters in GWR model.
The general regression model ignores the local heterogeneity a-mong variables (Bai and Zhang, 2014), while, in GWR model, we embed the spatial position characteristics of the research data, and we use the observations from neighboring data to estimate the local regression. This variable varies with the spatial position so that it reflects the spatial heterogeneity between dependent vari-ables and independent varivari-ables (Wang, 2013).
3. EXPERIMENT AND ANALYSIS
3.1 Global Spatial Pattern of E-commerce
We collected the data of the annual e-commerce turnover of 31 provinces in China from 2011 to 2015. We used the global moran model to analyze the spatial distribution pattern and the results are shown in Table??. We can find thatMoran ’s Iis higher than
E(I)in 2011-2015, which indicates that e-commerce in China has positive spatial autocorrelation at the provincial level in five years. The provinces with high e-commerce turnover are often adjacent to the provinces which are also with high values.
We make a significance test to the results and find that the results in 2011-2014 meet the standard of 5% significance test , and the result in 2015 only meets the standard of 10% significance test. It can be seen that the spatial distribution of the e-commerce de-velopment is non-random, but rather showing the geographical agglomeration between similar values.
However, from the overall perspective,Moran’s Ifluctuates with-in a certawith-in range and has a downward trend, from 0.241401 with-in 2011 down to 0.165808 in 2015. It shows that the geographi-cal agglomeration of e-commerce in China gradually weakens. This may be because when e-commerce just rose in early years, it was only promoted and applied in certain provinces. With the development of technology and changes of people’s minds, the provinces have begun to attach the importance to e-commerce. The differences of e-commerce development between regions be-gan to shrink, which gradually breaks the pattern of the past gath-ering. In addition, the analysis of the Z-value significance test in 2015 also shows that the e-commerce turnover in high value rel-atively distributes randomly. While the data in the previous few years shows that the e-commerce turnover in high value is more inclined to focus on clustering in some certain provinces.
3.2 Local Spatial Pattern of E-commerce
Tibet Xinjiang
Neimenggu
Qinghai Gansu
Sichuan
Jilin
Yunnan
Heilongjiang
Hebei
Hubei Shanxi
Hunan
Guangxi Henan
Anhui Shanxi
Jiangxi Guizhou
Liaoning
Fujian Shandong
Guangdong Zhejiang Jiangsu
Chongqing Ningxia
Taiwan
Hainan
Beijing Tianjin
Shanghai Shanghai
Hongkong
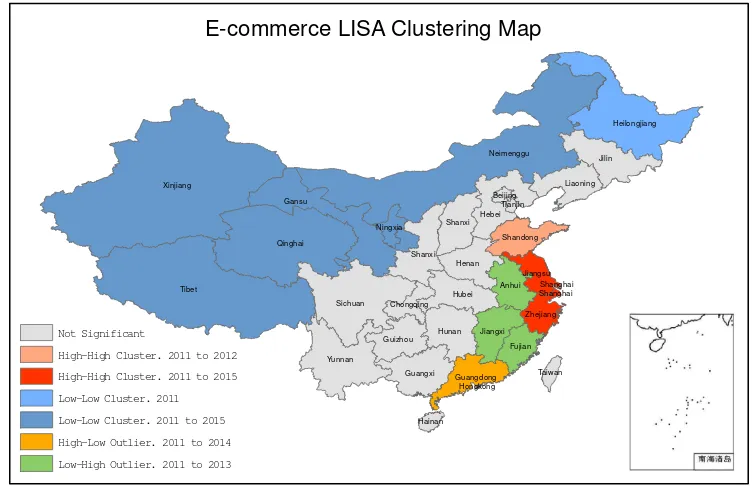
E-commerce LISA Clustering Map
Not Significant
High-High Cluster. 2011 to 2012
High-High Cluster. 2011 to 2015
Low-Low Cluster. 2011
Low-Low Cluster. 2011 to 2015
High-Low Outlier. 2011 to 2014
Low-High Outlier. 2011 to 2013
Figure 1. LISA clustering analysis of e-commerce by using local Moran’s model
Component 2011 2012 2013 2014 2015
Eigen -value
Contri -bution
rate
Cumul -ative contri -bution
Eigen -value
Contri -bution
rate
Cumul -ative contri -bution
Eigen -valuee
Contri -bution
rate
Cumul -ative contri -bution
Eigen -value
Contri -bution
rate
Cumul -ative contri -bution
Eigen -value
Contri -bution
rate
Cumul -ative contri -bution 1 6.028 54.804 54.804 5.906 53.691 53.691 5.742 52.202 52.202 5.620 51.094 51.094 5.568 50.620 50.620 2 2.897 26.334 81.138 2.892 26.295 79.986 2.928 26.622 78.823 2.613 23.757 74.851 2.784 25.309 75.929 3 1.128 10.254 91.392 1.094 9.947 89.933 1.182 10.749 89.572 1.407 12.789 87.640 1.066 9.693 85.622 4 0.399 3.626 95.018 0.482 4.379 94.312 0.431 3.920 93.492 0.589 5.351 92.991 0.604 5.491 91.113 5 0.226 2.051 97.069 0.294 2.670 96.982 0.316 2.869 96.361 0.333 3.026 96.017 0.492 4.476 95.589
11 0.003 0.031 100.000 0.005 0.044 100.000 0.005 0.043 100.000 0.005 0.042 100.000 0.005 0.043 100.000
Table 2. Eigenvalues and variance contribution rates of the principal component analysis
According to Figure 1, the regions with low value of e-commerce turnover are mainly concentrated in the northwest China; the re-gions with high value of e-commerce turnover are mainly concen-trated in the eastern and southeastern coastal areas E-commerce turnover has a decreasing trend from the eastern coastal to the inland. The main pattern of e-commerce development in 5 years did not change too much.
In 2011 and 2012, provinces in high-high cluster pattern were Zhejiang, Jiangsu, Shanghai and Shandong, indicating that these provinces began to develop e-commerce ealier and promoted each other. The next three years, the formation of a stable clus-ter to Jiangsu, Zhejiang and Shanghai as the core of the business district, leads a rapid development in Yangtze River delta region.
Xinjiang, Qinghai, Gansu are the core of the low-low cluster areas and the development of e-commerce is relatively slow in these regions. These provinces are adjacent to each other and fall in the third quadrant of the Moran Scatter. It is worth mentioning that in 2011, Heilongjiang is also located in the low-low cluster areas, indicating that the development of the Northeast in the past is relatively backward. While, in recent years, its e-commerce strength gradually increases, and there is a significant difference
between Northeast and Northwest now.
Analysis for Guangdong, it is in the high-low outlier mode. The level of its e-commerce development is high, but it is surround-ed by low-value provinces. Due to the geographical location of Guangdong Province, whose transportation is very convenient, it is suitable for the e-commerce development. In contrast, Fujian, Jiangxi, Anhui and other places, which are adjacent to Guang-dong, the economic strength of these provinces is relatively weak. Because they are on the south side of the high-high cluster area in Yangtze River Delta, and on the north side of Guangdong, that forms a low-high outlier pattern. However, from the trend of 5-year data, these provinces are developing e-commerce in an in-creasing pace, and the gap with the surrounding areas is gradually reduced. For example, the result shows that the dispersed pattern is no longer significant in 2014-2015, and the thematic maps have not show these characteristics again.
3.3 Dimensionality Reduction of Original Data
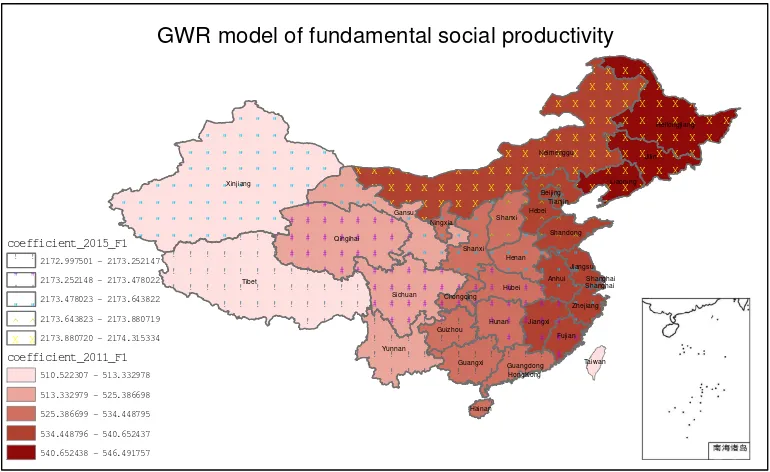
X X X X X X X X X
GWR model of fundamental social productivity
coefficient_2015_F1
^ ^2173.643823 - 2173.880719
X X2173.880720 - 2174.315334
coefficient_2011_F1
Figure 2. The regional difference map of fundamental social productivity influencing factor in GWR model
and ensure the objectivity and scientificity of the results of princi-pal component analysis (Chen et al., 2014). Then, the normalized data are analyzed by principal component analysis. Generally, n principal components with eigenvalues greater than 1 and cumu-lative contribution greater than 85% are selected. The eigenvalues and contribution rates of the analysis are shown in Table??. The results of the analysis of the data from 2011 to 2015 are simi-lar. The eigenvalues of the first three principal components are more than 1, and the cumulative contribution rates are 91.392%, 89.933%, 89.572%, 87.640% and 85.622%. The first three prin-cipal components basically can reflect most of the original infor-mation. Therefore, we replace 11 original variables with these three components to reduce the complexity and dimension of the original data.
In order to make the factor easier to be identified and explained, the initial component matrix is rotated through the maximum variance method (Chen et al., 2014). It can be seen from the factor rotation matrix in Table??(an example in 2011). The first principal component mainly includes express delivery turnover, the number express delivery goods, the number of express de-livery outlets, the number of Internet users, provincial GDP and provincial population. Its contribution rate is 54.804%, and it mainly reflects the fundamental social productivity. The second principal component mainly includes Internet popularity rate, the level of consumption, the proportion of the population aged 16-65, and the proportion of the population with high school educa-tion. Its contribution rate is 26.334%, and it mainly reflects the resident living standards. The third principal component mainly reflects the population sex structure, and its contribution rate is 10.254%.
The principal component is a linear combination of 11 normal-ized indexes. The final score of three principal components F1, F2 and F3 is calculated through multiplying the score coefficien-t macoefficien-trix and coefficien-the normalizacoefficien-tion index. We can make use of coefficien-the results of principal component analysis to apply the geography weighted regression analysis in the next step.
Component
1 2 3
the turnover of express 0.670 0.639 -0.280 the number of express goods 0.733 0.584 -0.174 the number of exprss outlets 0.929 0.238 -0.127 the number of Internet users 0.971 0.135 -0.013 Internet popularity rate 0.216 0.926 0.066
the provincial GDP 0.956 0.195 0.121 the level of consumption 0.250 0.926 -0.057 the provincial population 0.928 -0.247 0.022
the provincial sex ratio -0.027 0.120 0.974 the structure of age in population -0.016 0.864 0.301 the structure of education in population -0.011 0.889 0.014
Table 3. Rotation component matrix
3.4 Influencing Factors of E-commerce
In order to find the influencing factors of e-commerce develop-ment and its spatial differences, we use the above three compre-hensive factors to build the geographic weighted regression mod-el as follows:
We analyze the data from 2011 to 2015 by using the GWR and OLS models. Through comparing the results in Table ??, we find that theR2
Adjusted value of GWR is larger. Therefore, the GWR model is more reasonable.
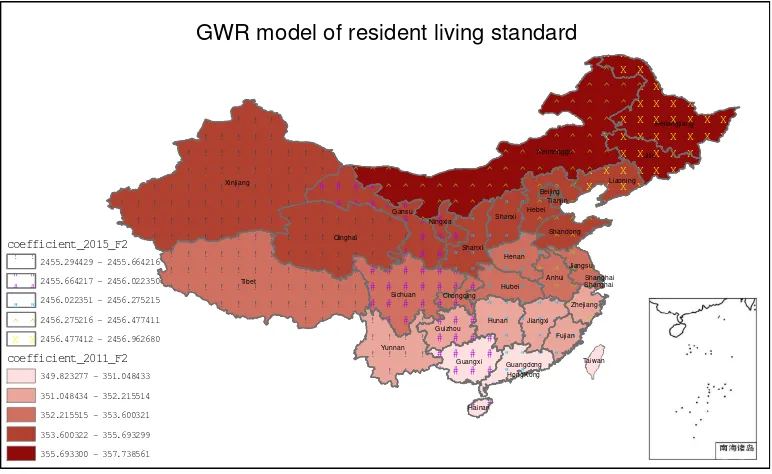
dif-X X X X X X X X X
GWR model of resident living standard
coefficient_2015_F2
" "2456.022351 - 2456.275215
^ ^2456.275216 - 2456.477411
X X2456.477412 - 2456.962680
coefficient_2011_F2
Figure 3. The regional difference map of resident living standard influencing factor in GWR model
ference for the influence of 3 comprehensive factors on the e-commerce development.
(1) According to Figure 2, the regression coefficient of the funda-mental social productivity is larger than 0, indicating that it has a positive correlation with the e-commerce development (Shan and Nie, 2014). From 2011 to 2015, the absolute value of the regres-sion coefficient is increasing year by year. The contribution to e-commerce of this comprehensive factor is growing from 2010. It shows that the development of e-commerce and economy are closely related. The influence of fundamental social productive is different in space, and the regression coefficient of the north-eastern provinces is decreasing continuously. The development of e-commerce in Xinjiang, Tibet and Qinghai is relatively slow. These provinces cannot keep up with the pace of its economic development, and the strength of this influencing factor is weak there. From the tendency of change in 2011-2015, it is obvious to see that the strength of this influencing factor is higher in eastern regions and lower in western regions at the beginning. While it gradually transfers the spatial pattern in which the the strength of this influencing factor in the northeast to the southwest is contin-uously decreasing. Moreover, the difference between the provin-cial regression coefficients becomes smaller, indicating that the impact of fundamental social productivity on the provinces tends to fluctuate in a smaller range. With the continuous development of the economy, every province has paid attention to e-commerce, and it has a lot of room to improve.
(2) According to Figure 3, the regression coefficient of resident living standard is larger than 0, indicating that it has a positive effect on the e-commerce development. With the change of time, the spatial pattern of intensity of resident living standard has also changed. The strength of this influencing factor is higher in north-ern regions and lower in southnorth-ern regions at the beginning. While it gradually transfers the spatial pattern in which the strength of this influencing factor is higher in eastern regions and lower in western regions year after year.Among them, the continuous im-provement of the Internet and education provide a certain foun-dation for the rapid development of e-commerce. The increase in per capita consumption level stimulates people’s desires of
on-line shopping. E-commerce in the eastern coastal areas is better, and the resident living standard is also higher there, forming a virtuous circle of mutual promotion.
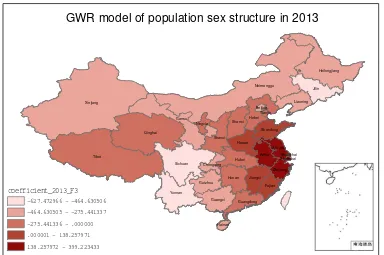
(3) According to Figure 4, the value of regression coefficient of population sex structure shows rare clustering characteristic in s-pace. According to the analysis results from 2011 to 2015, the values are small and irregularly changes through years. It in-dicates that the proportion of women has negligible effect on e-commerce and its spatial pattern tends to be randomly distributed. The high-value and low-value regions are different in every year. For example, in 2011, there is a pattern in which the strength of this factor is higher in eastern regions and lower in western re-gions. While in 2012, the west is higher than that in the east. The results cannot explain the correlation between the population sex structure and the e-commerce development. It is worth noting that the coefficient of Yangtze River delta has always been pos-itive. The possible explaination to account for this phenomenon is that the level of economic development in the Yangtze River Delta is high, so the demand for online shopping is also high, and women are the main crowd of online shopping.
4. CONCLUSION
Through the global moran’s analysis, there is a certain geographi-cal agglomeration of the e-commerce development in China, and this agglomeration is gradually weakening. Through the local moran’s analysis, the low value of e-commerce in China is main-ly concentrated in Xinjiang, Qinghai, Gansu as the core of the northwest, and high value gathers mainly in Jiangsu, Zhejiang and other eastern and southeast coastal areas. The provinces in high-low outlier pattern are mainly in Guangdong Province, and their gap with neighboring provinces is decreasing, and the dis-perse pattern is no longer significant. In general, it is obvious to see that the spatial aggregation of e-commerce development follows certain rules, and it reflects a strong imbalance character-istic.
liv-Tibet Xinjiang
Neimenggu
Qinghai Gansu
Sichuan
Jilin
Yunnan
Heilongjiang
Hebei
Hubei Shanxi
Hunan
Guangxi Henan
Anhui Shanxi
Jiangxi Guizhou
Liaoning
Fujian Shandong
Guangdong Zhejiang Jiangsu
Chongqing Ningxia
Hainan
Beijing Tianjin
Shanghai Shanghai
GWR model of population sex structure in 2013
coefficient_2013_F3
-627.472966 - -464.630506
-464.630505 - -275.441337
-275.441336 - .000000
.000001 - 138.257971
138.257972 - 399.223433
Figure 4. The regional difference map of population sex structure influencing factor in GWR model
2011 2012 2013 2014 2015
AICc R2
Adjusted AICc R2
Adjusted AICc R2
Adjusted AICc R2
Adjusted AICc R2
Adjusted
GWR 450.5629 0.8158 474.9662 0.9012 521.6660 0.8663 546.5994 0.8221 548.2064 0.8262 OLS 450.6166 0.8142 477.3576 0.8847 523.5297 0.8439 546.8821 0.8175 550.9197 0.8103
Table 4. The comparison of GWR and OLS model
ing standard and population sex structure. Through the geograph-ical weighted regression analysis, we find that compared with the OLS model, the GWR model has better effect of fitting the influ-encing factors. There is a positive correlation between the fun-damental social productivity and the e-commerce development. The resident living standard is the second most positive influenc-ing factor. And the population sex structure has no significant effect on the e-commerce.
The influence of the first two factors is difference in space, and there is a certain change in the time dimension. The strength of fundamental social productivity is higher in the east and lower in the west at the beginning. It gradually transfers into a pattern that the strength of this factor is continuously decreasing from the northeast to the southwest. The strength of resident living stan-dard is higher in the north and lower in the south at the beginning. It gradually transfers into a pattern that the strength of this factor is higher in the east and lower in the west year after year. And the influence of the two is increasing, which indicates that the above driving factors are becoming more and more important for the development of e-commerce.
On the basis of this analysis, we can choose the suitable model to forecast the development of E-commerce, and further analyze the trend of e-commerce in the time and space dimensions.
REFERENCES
Aoyama, Y., 2003. Sociospatial dimensions of technology adop-tion: recent m-commerce and e-commerce developments.
Envi-ronment and Planning A35(7), pp. 1201–1221.
Bai, J. and Zhang, H., 2014. Spatial-temporal analysis of eco-nomic growth in central plains ecoeco-nomic zone with eof and grw methods.Geographical Research34(12), pp. 1488–1496.
Chen, H., Cao, C., Zhang, C., Li, W., Qiao, Y., Du, S. and Zhao, Z., 2014. Principal component cluster analysis of effects of long-term fertilization on fertility of lime concretion black soll. Acta Pedologica Sinica51(3), pp. 609–617.
Farag, S., Weltevreden, J., Van Rietbergen, T., Dijst, M. and van Oort, F., 2006. E-shopping in the netherlands: does geography matter? Environment and Planning B: Planning and Design
33(1), pp. 59–74.
Hao, F., Guan, H. and Wang, S., 2016. Study on the influencing factors and spatial distribution of electronic commerce develop-ment level in china’s cities. Economic Geography36(2), pp. 1– 10.
Shan, Y. H. and Nie, J. C., 2014. Influencing factors of residential land price in wuhan based on gwr model. Journal of Huazhong Agricultural University113(5), pp. 111–118.
Tang, Y., 2015. A spatial difference study on china’s e-commerce development level.Economic Geography35(5), pp. 9–14.
Wang, X. and Xu, S., 2011. Spatial autocorrelation analysis of c2c e-business in china.Economic Geography.
Wang, Y., Wang, J., Yao, Y. and Wang, J., 2014. Evaluation of drought vulnerability in southern china based on principal com-ponent analysis. Ecology & Environmental Sciences23(12), p-p. 1897–1904.
Xiao, W. D., 2014. Spatial statistics analysis of china’s planting geographic agglomeration.Economic Geography34(9), pp. 124– 129.
Xu, S., 2013. Research on Geographic Pattern of Chinas C2C E-commerce. PhD thesis, Dalian University of Technology.
Zhong, H., Zhang, Shaozhong, H. L. and Nie, Y., 2014. Spa-tial pattern of c2c e-commerce online shops in china. Economic Geography34(4), pp. 91–96.