A NOVEL APPROACH FOR 3D NEIGHBOURHOOD ANALYSIS
S. Emamgholian a, *, M. Taleai b, D. Shojaei c
a Master student in GIS, Faculty of Geodesy and Geomatics Engineering, K. N. Toosi University of Technology, Tehran, Iran –
b Dept. of GIS, Faculty of Geodesy and Geomatics Engineering, K. N. Toosi University of Technology, Tehran, Iran –
c Centre for SDIs and Land Administration, Dept. of Infrastructure Engineering, The University of Melbourne, Victoria, 3010 ,
Australia – [email protected]
Commission IV, WG IV/5
KEY WORDS: 3D GIS, Neighbourhood, Analysis, Indoor Modelling, Buffer, BIM
ABSTRACT:
Population growth and lack of land in urban areas have caused massive developments such as high rises and underground infrastructures. Land authorities in the international context recognizes 3D cadastres as a solution to efficiently manage th ese developments in complex cities. Although a 2D cadastre does not efficiently register these developments, it is cur rently being used in many jurisdictions for registering land and property information. Limitations in analysis and presentation are considered as examples of such limitations.
3D neighbourhood analysis by automatically finding 3D spaces has become an issue of major interest in recent years. Whereas the neighbourhood analysis has been in the focus of research, the idea of 3D neighbourhood analysis has rarely been addressed in 3 dimensional information systems (3D GIS) analysis.
In this paper, a novel approach for 3D neighbourhood analysis has been proposed by recording spatial and descriptive information of the apartment units and easements. This approach uses the coordinates of the subject apartment unit to find the neighbour spaces. By considering a buffer around the edges of the unit, neighbour spaces are accurately detected. This method was implemented in ESRI ArcScene and three case studies were defined to test the efficiency of this approach. The results show th at spaces are accurately detected in various complex scenarios. This approach can also be applied for other applications such as property management and disaster management in order to find the affected apartments around a defined space.
* Corresponding author
1. INTRODUCTION
Cities around the world have experienced an increasing pressure on land due to population growth and lack of land in urban areas which lead to multi-level developments. Since land privatization starts, 2D plans were drafted for registration (Stoter, 2004). Currently, in Iran and many other jurisdictions, land and property registration is stored in 2D approaches such as 2D paper or PDF based plans (Shojaei et al., 2015) which are not easy for the public to understand their rights, restrictions and responsibilities (RRRs). However, this method of registration is not efficient and have various limitations (Shojaei et al., 2012).
In the real world, RRRs have a 3D nature. In this condition, 2D modelling of RRRs is not be able to efficiently record the RRRs. As an example, there is no possibility to interactively view the ownership rights and do some analyses such as neighbour parcels around a subject parcel.
Moving from 2D registration and visualization systems to a 3D system is an important issue which received a great attention in the recent decade. Many researchers have investigated various aspects of a 3D digital cadastre implementation. Some of them used the existing Geospatial Information Systems (GIS) as a powerful tool in land management to display apartments and related RRRs in three dimensions. Some GIS tools have the
ability of getting, storing, editing, quarrying, analysing and presenting 3D RRRs (Shojaei, 2014). Considering the complexity of 3D geometry of objects, not only data storage is problematic, but also registration of RRRs could be affected. Moreover, the most difficult aspect of modelling and visualization is presenting the relation between the spatial elements, yet this issue is a problem in three dimensions (Aien et al., 2013a).
rotate, zoom, expand, and turning off layers and identifying objects. Shojaei et al. (2013) did a comprehensive study on 3D visualization requirements for developing a prototype and at last developed one according to user requirements. This prototype is able to display upper and lower space of specified land. It also has various tools with ability of identifying, measuring, and searching for rights, restrictions and responsibilities.
Despite the current research development, no country has the ability to present the complete display of rights in a 3D system and it has a limited functionality (Shojaei, 2014) and (Karki, 2013). One of such limitation is neighbourhood visualization in 3D space.
In this study, neighbourhood analysis in high-rises and the methods of modelling in a 3D spatial information system have been investigated. Some of the potential applications of this analysis are in disaster management and property management which have not been investigated.
In this paper, Section 2 looks at the methodology of
neighbourhood analysis. According to the explained
methodology, a prototype is developed (Section 3). Finally, the outcome and future direction are presented in Section 4.
2. METHODOLOGY
In this paper, 3D neighbourhood analysis is designed and developed in a new approach with the help of 3D GIS. Implementing a 3D GIS involves four interdependent parts including: a data model for information itself, a data format for supporting the data model, a database to manage data, and visualisation tools for displaying and querying the data (Shojaei, 2014).
This paper focuses on the 3D visualisation of a 3D Cadastral system and develops a tool for identifying indoor neighbour parcels in high-rises. To realize the importance of other parts, the following sections should also be considered.
2.1 Data format
Type and format of the data used in the 3D visualisation is important. 3D cadastral data includes physical and legal aspects (Shojaei et al., 2013). The physical objects (such as walls, door, windows) are visible and the legal objects (such as property rights) are conceptual objects. Modelling and visualising in the cadastral systems should be able to provide both types of cadastral and legal data independently (Aien et al., 2013b). 3D data is stored in various formats such as the Collada format, CityGML (OGC standard), and ShapeFile (ESRI data format for spatial data).
Choosing the appropriate data format to illustrate the physical and legal nature of the cadastral data and their relationship is significant. GIS can help land management processes by providing a variety of 3D tools. 3D GIS techniques are used in many applications, such as urban planning and architecture. 3D GIS also has a lot of potential for implementing a 3D cadastre. Over the past decade, extensive research has been done in 3D visualisation using ESRI products. Because they provide various 3D functions. According to the above description, the ESRI ArcScene has been chosen for implementing the prototype. It should be noted that other software may have the capability to perform this activity. ShapeFile data format is used in this article as the main format and DWG (input data) and Collada (auxiliary data) formats are finally converted to ShapeFile, as explained below.
2.2 Data Model and Database
There is always a need for an efficient database for managing 3D data and analysis. This database should be able to store the physical parts of the apartment and its legal information. The visualisation of all building components may increase the complexity of a 3D model, which should be considered at all steps. Cadastral maps indicate the exact boundaries of the land parcels, in which, by establishing the relationship the RRRs and maps, the owner can identify his assets and prove its ownership and also use its assets with confidence. In this article, the database consists of all the registration information of the apartment.
The data organization in the database is called the data model. The data model determines the logical structure of the database and basically determines how the data is stored, organized and manipulated (Aien et al., 2013a). In this study, all of the polygons in the 2D survey plans, including parking, warehouses and their doors, elevators, ramps, stairs, ducts, razors, common properties, apartment units, balconies, roofs, toilets, hall, entrance, skylight, ramps, lobbies, facilities, children's play area, seamless interruption between blocks, cut-off wall, substation and terraces are modelled. In this model, various descriptive fields, including a unique code, are intended to create the interface between the programming language and the visualising software. It is possible to add or reduce the descriptive fields associated with each entity with the perception of the managers and decision makers. It needs to be explained that modelling has been done in such a way that the information of each floor are modelled individually so that analysis can be made on each floor separately. The UML diagram of the building model is shown in Figure 1.
2.3 Survey Plan Processing
Generally, the initial spatial data is obtained from the common survey plans. To use these plans in a 3D visualisation, we must examine a topological perspective (Ying et al., 2011): 1) Polygons must be closed. 2) The boundary of polygons should not self-intersect. 3) Polygons should create a planar partition, i.e., they do not overlap and have no gaps between themselves. Also components in the apartment (such as elevators) must be vertically in the same direction.
High- Rise
+FloorNumb er : int +Object_ID : strin g +Name : strin g
+Uniqe_Cod e : int
1
Figure 1. UML Class of Building
Figure 3. Polygons after modification Figure 2. Initial polygons.
2.4 Extrusion
Several methods are used to represent 3D geometry, including
Extrusion (Pouliot et al., 2011), CSG1 (Jarroush and
Even-Tzur, 2004), B-Rep2 (Karki et al., 2010), Polyhedrons (Stoter,
2004) and Regular Polytopes (Thompson, 2007). All of these methods deal with 3D geometry and 3D topology. In recent years, the limitation of using the 2D plans in visualising the boundaries of high-rise buildings has contributed to the awareness of moving toward a 3D visualisation. In this paper, after the processing 2D survey plans, the extrusion technique has been used to represent the third dimension. This technique has the ability to model most of the existing buildings in Iran according to their appearance. Several software products are
1 Constructive Solid Geometry
2 Boundary Representation
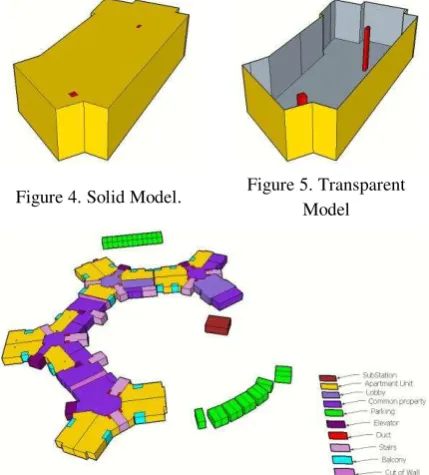
able to create 3D models including Google SketchUp and Esri ArcScene. The reason for choosing these products is the flexibility to build 3D models and programming capabilities to add the desired analysis such as the 3D neighbourhood. For the polygon with two holes such as ducts (Figure 3), the extruded model can be created as illustrated in figure 4 and figure 5. Figure 6 illustrates the 3D extrusion model of a floor of 3 buildings with many property units.
Figure 5. Transparent Model Figure 4. Solid Model.
Figure 6. 3D extrusion of ground floors of case study representing 3D cadastral objects
3. IMPLEMENTATION
The case study is in Tehran, Iran, which including three buildings, 16 floors utmost, 299 apartment units and three underground basements. The choice of the case study is in such a way that it has the complexity needed to test a variety of neighbouring states. The source file of survey plan in the case study has been produced by surveyors in DWG format. Due to the lack of distinction between property units in the Esri ArcScene Extruded model as shown in figure 7 and to create a better 3D visual perception, all apartments floors in the Google SketchUp were exported to collada format and added to the ESRI ArcScene extruded model which are shown in figure 8. In addition, a geo-database has also been linked with building components in Esri ArcScene.
Figure 8. Esri ArcScene Model by Adding Collada Formats Figure 7. Esri ArcScene
Extruded Model
additional developments for 3D neighbourhood analysis in C# language by creating an AddIn in Esri ArcScene.
This tool is not exclusive to a particular apartment and can be independently run on any apartment. It is necessary to explain that the tool automatically identifies and selects the next-door neighbours of each building unit by creating a buffer around the coordinates of their corners and reads their information from the database.
Also, to identify the above and below neighbours, the algorithm extends the Z value of the points in the floor of an apartment unit, then it identifies, selects and reads their information from database. Figure 7 shows the steps to test the developed tools. In addition, all details are also automatically stored in the geo-database as illustrated in figure 8. Finally, all information is saved in a text file as shown in figure 9.
The system manages 2357 3D property units, including three buildings which have three underground basements.
(b)
(a)
(d)
(c)
b. identifying and selecting upstairs neighbour Figure 7a. identifying input
apartment unit.
d. identifying and selecting next-door neighbour c. identifying and selecting
downstairs neighbour.
Figure 8. Details of Neighbours of Apartment Unit #196
Figure 9. Neighbours’ details of Apartment Unit #196
4. CONCLUSION
This paper presents a method for constructing a 3D cadastral management system from 2D surveying plans and introduces an approach for 3D neighbourhood analysis. Testing the developed tool has shown that is easy to use, extend and adapt for the purpose of a 3D cadastral system. 3D neighbourhood analysis in buildings is important in various applications. This prototype showed that it was possible to identify and analyse RRRs with the help of 3D GIS.
To support curved surfaces and very large volume data, more deep insights about the development of C# on ArcScene should be investigated. This algorithm can also be applied to the fields of urban planning and land management system, specifically in emergency management and 3D analysis.
REFERENCES
Aien, A., Kalantari, M., Rajabifard, A., Williamson, I., Bennett, R., 2013a. Utilising data modelling to understand the structure of 3D cadastres. Journal of spatial science 58, 215-234.
Aien, A., Kalantari, M., Rajabifard, A., Williamson, I., Wallace, J., 2013b. Towards integration of 3D legal and physical objects in cadastral data models. Land Use Policy 35, 140-154.
Ammar, R.K., Neeraj, D., 2013. SLRB Bahrain – 3D Property
Registration System, 5th Land Administration Domain Model Workshop Kuala Lumpur, Malaysia.
Budisusanto, Y., Aditya, T., Muryamto, R., 2013. LADM implementation prototype for 3D cadastre information system of multi-level apartment in Indonesia, 5th Land Administration Domain Model Workshop.
Elizarova, G., Sapelnikoiv, S., Vandysheva, N., Van Oosterom, P., De Vries, P., Stoter, J., Ploeger, H., Spiering, B., Outers, R., Hoogeveen, A., 2012. Russian-Dutch project" 3D cadastre modelling in Russia".
Jarroush, J., Even-Tzur, G., 2004. Constructive solid geometry as the basis of 3D future cadastre. FIG working Week, Athens, Greece.
Karki, S., 2013. 3D Cadastre Implementation Issues in Australia. Master by Research, The University of Southern Queensland.
Karki, S., Thompson, R., McDougall, K., 2010. Data validation in 3D cadastre, Developments in 3D geo-information sciences. Springer, pp. 92-122.
Pouliot, J., Roy, T., Fouquet-Asselin, G., Desgroseilliers, J., 2011. 3D Cadastre in the province of Quebec: A First experiment for the construction of a volumetric representation, Advances in 3D Geo-Information Sciences. Springer, pp. 149-162.
Shojaei, D., 2014. cadastral visualisation: understanding users’ requirements. University of Melbourne.
Shojaei, D., Rajabifard, A., Kalantari, M., Bishop, I.D., Aien, A., 2015. Design and development of a web-based 3D cadastral visualisation prototype. International Journal of Digital Earth 8, 538-557.
Stoter, J., 2004. 3D Cadastre. Delft University of Technology. Thompson, R.J., 2007. Towards a rigorous logic for spatial data representation. NCG, Nederlandse Commissie voor Geodesie.