Lampiran 1
Perkembangan Ekspor Sektor Pertanian Sumatera Utara, 1996-2013
Tahun
Ekspor
Berat Bersih (Ton)
Nilai FOB
(US)
1996
938.492
998.290.000
1997
885.801
891.707.000
1998
1.088.026
746.359.000
1999
981.148
625.157.000
2000
824.352
551.295.000
2001
1.035.361
665.936.000
2002
885.245
600.529.000
2003
838.057
686.911.000
2004
1.024.946
1.029.559.000
2005
1.044.992
1.222.394.000
2006
1.077.964
1.705.921.000
2007
1.107.505
1.850.403.000
2008
1.042.468
2.187.775.000
2009
976.542
1.444.088.000
2010
1.077.691
2.677.304.000
2011
1.050.217
3.951.429.000
2012
1.020.007
2.740.148.000
2013
1.104.842
2.403.011.000
Perkembangan Ekspor Sumatera Utara menurut Komoditi Utama Sektor
Pertanian, 1996-2013
Tahun Lemak & minyak nabati
Getah karet alam Kopi Coklat
Berat Bersih
(Ton)
Nilai FOB (US)
Berat Bersih
(Ton)
Nilai FOB (US)
Berat Bersih
(Ton)
Nilai FOB (US)
Berat Bersih
(Ton)
Lampiran 3
Perkembangan Impor Sektor Pertanian Sumatera Utara, 1996-2013
Tahun
Impor
Berat Bersih (Ton)
Nilai FOB (US)
1996
73.497
50.812.000
1997
155.710
67.680.000
1998
62.358
26.522.000
1999
163.886
39.416.000
2000
207.066
65.482.000
2001
165.400
40.861.000
2002
245.142
54.188.000
2003
230.807
52.496.000
2004
197.687
62.026.000
2005
121.405
75.394.000
2006
278.291
118.536.000
2007
294.244
158.740.000
2008
271.704
200.628.000
2009
311.415
163.972.000
2010
335.684
197.537.000
2011
544.531
298.482.000
2012
587.835
343.038.000
2013
783.484
408.375.000
Perkembangan Impor Sumatera Utara menurut Komoditi Utama Sektor
Pertanian, 1996-2013
Tahun
Biji dan Buah
mengandung Minyak
Tepung Gandum dan Meslin
Berat Bersih
(Ton)
Nilai FOB
(US)
Berat Bersih
(Ton)
Nilai FOB
(US)
1996
5.511
3.474
1.536
360
1997
10.222
6.055
4.417
1.062
1998
13.642
2.571
11.648
3.265
1999
49.867
9.462
147.862
25.448
2000
33.217
7.213
83.979
14.198
2001
13.466
3.696
89.797
14.926
2002
7.794
2.327
61.123
12.536
2003
30.135
7.657
37.725
81.118
2004
12.274
4.575
50.790
12.432
2005
45.752
13.095
68.869
17.103
2006
34.445
9.243
69.190
17.390
2007
97.100
33.125
106.056
30.134
2008
90.957
47.057
103.247
43.930
2009
90.533
51.721
128.198
41.409
2010
97.992
53.876
136.826
45.165
2011
118.229
73.555
123.441
46.487
2012
121.458
77.845
104.929
38.504
2013
130.222
87.541
41.873
15.232
Lampiran 5
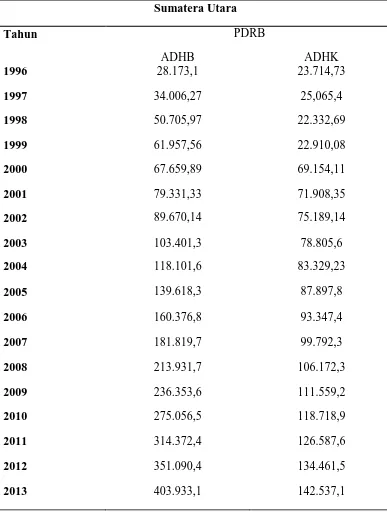
Tabel PDRB Sumatera Utara Atas Dasar Harga Konstan Menurut
Lapangan Usaha, 1996-2013
Sumatera Utara
Tahun
PDRB
ADHB
ADHK
1996
28.173,1
23.714,73
1997
34.006,27
25,065,4
1998
50.705,97
22.332,69
1999
61.957,56
22.910,08
2000
67.659,89
69.154,11
2001
79.331,33
71.908,35
2002
89.670,14
75.189,14
2003
103.401,3
78.805,6
2004
118.101,6
83.329,23
2005
139.618,3
87.897,8
2006
160.376,8
93.347,4
2007
181.819,7
99.792,3
2008
213.931,7
106.172,3
2009
236.353,6
111.559,2
2010
275.056,5
118.718,9
2011
314.372,4
126.587,6
2012
351.090,4
134.461,5
2013
403.933,1
142.537,1
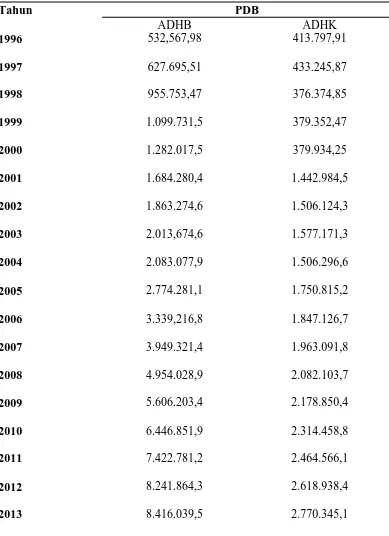
Tabel PDB Indonesia Atas Dasar Harga Konstan Menurut Lapangan Usaha,
1996-2013
Tahun
PDB
ADHB
ADHK
1996
532,567,98
413.797,91
1997
627.695,51
433.245,87
1998
955.753,47
376.374,85
1999
1.099.731,5
379.352,47
2000
1.282.017,5
379.934,25
2001
1.684.280,4
1.442.984,5
2002
1.863.274,6
1.506.124,3
2003
2.013,674,6
1.577.171,3
2004
2.083.077,9
1.506.296,6
2005
2.774.281,1
1.750.815,2
2006
3.339,216,8
1.847.126,7
2007
3.949.321,4
1.963.091,8
2008
4.954.028,9
2.082.103,7
2009
5.606.203,4
2.178.850,4
2010
6.446.851,9
2.314.458,8
2011
7.422.781,2
2.464.566,1
2012
8.241.864,3
2.618.938,4
2013
8.416.039,5
2.770.345,1
Lampiran 7. Output Korelasi
Ekspor Sektor Pertanian Dengan Produk
Domestik Regional Bruto (PDRB)
CORRELATIONS /VARIABLES=y x
/PRINT=TWOTAIL NOSIG
/STATISTICS DESCRIPTIVES XPROD /MISSING=PAIRWISE.
Correlations
Descriptive Statistics
Mean Std. Deviation N
PDRB 82971.0000 38874.07872 18
ekspor 1498789777.7778 961297182.06241 18
Correlations
PDRB ekspor
PDRB
Pearson Correlation 1 .761**
Sig. (2-tailed) .000
Sum of Squares and
Cross-products 25690297936.000
48342514750300
0.000
Covariance 1511193996.235 28436773382529.
410
N 18 18
ekspor
Pearson Correlation .761** 1
Sig. (2-tailed) .000
Sum of Squares and
Cross-products
48342514750300
0.000
15709568628099
109000.000
Covariance 28436773382529.
410
92409227224112
4100.000
N 18 18
1.
Lemak dan Minyak Nabati
CORRELATIONS /VARIABLES=Y X
/PRINT=TWOTAIL NOSIG
/STATISTICS DESCRIPTIVES XPROD /MISSING=PAIRWISE.
Correlations
Descriptive Statistics
Mean Std. Deviation N
PDRB 82971.0000 38874.07872 18
lemak &minyak nabati 2037062.3889 1389615.69423 18
Correlations
PDRB lemak &minyak
nabati
PDRB
Pearson Correlation 1 .851**
Sig. (2-tailed) .000
Sum of Squares and
Cross-products 25690297936.000
781331668481.00
0
Covariance 1511193996.235 45960686381.235
N 18 18
lemak &minyak nabati
Pearson Correlation .851** 1
Sig. (2-tailed) .000
Sum of Squares and
Cross-products
781331668481.00
0
32827540219992.
277
Covariance 45960686381.235 1931031777646.6
05
N 18 18
2.
Getah Karet Alam
CORRELATIONS /VARIABLES=Y X
/PRINT=TWOTAIL NOSIG
/STATISTICS DESCRIPTIVES XPROD /MISSING=PAIRWISE.
Correlations
Descriptive Statistics
Mean Std. Deviation N
PDRB 82971.0000 38874.07872 18
Getah karet alam 1082447.0556 793920.55355 18
Correlations
PDRB Getah karet alam
PDRB
Pearson Correlation 1 .751**
Sig. (2-tailed) .000
Sum of Squares and
Cross-products 25690297936.000
393985825635.00
0
Covariance 1511193996.235 23175636802.059
N 18 18
Getah karet alam
Pearson Correlation .751** 1
Sig. (2-tailed) .000
Sum of Squares and
Cross-products
393985825635.00
0
10715267370836.
943
Covariance 23175636802.059 630309845343.35
0
N 18 18
CORRELATIONS /VARIABLES=Y X
/PRINT=TWOTAIL NOSIG
/STATISTICS DESCRIPTIVES XPROD /MISSING=PAIRWISE.
Correlations
Descriptive Statistics
Mean Std. Deviation N
PDRB 82971.0000 38874.07872 18
kopi 178811.9444 120571.13755 18
Correlations
PDRB kopi
PDRB
Pearson Correlation 1 .781**
Sig. (2-tailed) .000
Sum of Squares and
Cross-products 25690297936.000 62212426951.000
Covariance 1511193996.235 3659554526.529
N 18 18
kopi
Pearson Correlation .781** 1
Sig. (2-tailed) .000
Sum of Squares and
Cross-products 62212426951.000
247135786572.94
4
Covariance 3659554526.529 14537399210.173
N 18 18
4.
Coklat
CORRELATIONS /VARIABLES=Y X
/PRINT=TWOTAIL NOSIG
/STATISTICS DESCRIPTIVES XPROD /MISSING=PAIRWISE.
Correlations
Descriptive Statistics
Mean Std. Deviation N
PDRB 82971.0000 38874.07872 18
coklat 68004.8333 42902.44538 18
Correlations
PDRB coklat
PDRB
Pearson Correlation 1 .618**
Sig. (2-tailed) .006
Sum of Squares and
Cross-products 25690297936.000 17517355459.000
Covariance 1511193996.235 1030432674.059
N 18 18
coklat
Pearson Correlation .618** 1
Sig. (2-tailed) .006
Sum of Squares and
Cross-products 17517355459.000 31290536938.500
Covariance 1030432674.059 1840619819.912
N 18 18
CORRELATIONS /VARIABLES=Y X
/PRINT=TWOTAIL NOSIG
/STATISTICS DESCRIPTIVES XPROD /MISSING=PAIRWISE.
Correlations
Descriptive Statistics
Mean Std. Deviation N
PDRB 82971.0000 38874.07872 18
impor 134676944.4444 114548724.91625 18
Correlations
PDRB impor
PDRB
Pearson Correlation 1 .830**
Sig. (2-tailed) .000
Sum of Squares and
Cross-products 25690297936.000
62801727757000.
016
Covariance 1511193996.235 3694219279823.5
30
N 18 18
impor
Pearson Correlation .830** 1
Sig. (2-tailed) .000
Sum of Squares and
Cross-products
62801727757000.
016
22306397645894
4448.000
Covariance 3694219279823.5
30
13121410379937
908.000
N 18 18
Lampiran 10. Output Korelasi
Impor Komoditi Utama Sektor Pertanian Dengan
Produk Domestik Regional Bruto (PDRB)
1.
Biji dan Buah mengandung Minyak
CORRELATIONS /VARIABLES=Y X
/PRINT=TWOTAIL NOSIG
/STATISTICS DESCRIPTIVES XPROD /MISSING=PAIRWISE.
Correlations
Descriptive Statistics
Mean Std. Deviation N
PDRB 82971.0000 38874.07872 18
biji & buah meng. minyak 27449.3333 29717.27648 18
Correlations
PDRB biji & buah meng.
minyak
PDRB
Pearson Correlation 1 .824**
Sig. (2-tailed) .000
Sum of Squares and
Cross-products 25690297936.000 16175229353.000
Covariance 1511193996.235 951484079.588
N 18 18
biji & buah meng. minyak
Pearson Correlation .824** 1
Sig. (2-tailed) .000
Sum of Squares and
Cross-products 16175229353.000 15012980862.000
Covariance 951484079.588 883116521.294
N 18 18
CORRELATIONS /VARIABLES=Y X
/PRINT=TWOTAIL NOSIG
/STATISTICS DESCRIPTIVES XPROD /MISSING=PAIRWISE.
Correlations
Descriptive Statistics
Mean Std. Deviation N
PDRB 82971.0000 38874.07872 18
gandum 25594.3889 20647.51318 18
Correlations
PDRB gandum
PDRB
Pearson Correlation 1 .506*
Sig. (2-tailed) .032
Sum of Squares and
Cross-products 25690297936.000 6905035698.000
Covariance 1511193996.235 406178570.471
N 18 18
gandum
Pearson Correlation .506* 1
Sig. (2-tailed) .032
Sum of Squares and
Cross-products 6905035698.000 7247436610.278
Covariance 406178570.471 426319800.605
N 18 18