MEASURING SUNFLOWER NITROGEN STATUS FROM AN UNMANNED AERIAL
VEHICLE-BASED SYSTEM AND AN ON THE GROUND DEVICE
F. Agüera a, *, F. Carvajal a, M. Pérez a
a ESI - Dept. of Rural Engineering, Escuela Superior de Ingeniería, University of Almería, 04120 Almeria, Spain - [email protected]
Commission I, WG I/V
KEY WORDS: Precision agriculture, Site-specific farming, Unmanned Aerial Vehicle.
ABSTRACT:
Precision agriculture recognizes the inherent spatial variability associated with soil characteristics, land morphology and crop growth, and uses this information to prescribe the most appropriate management strategy on a site-specific basis. To reach this task, the most important information related with crop growth is nutrient status, weed infestation, disease and pet affectation and water management. The application of fertilizer nitrogen to field crops is of critical importance because it determines plant’s growth, vigour, colour and yield. Furthermore, nitrogen has been observed as a nutrient with high spatial variability in a single field, related to its high mobility.
Some previous works have shown that is possible to measure crop nitrogen status with optical instruments. Since most leaf nitrogen is contained in chlorophyll molecules, there is a strong relationship between leaf nitrogen and leaf chlorophyll content, which is the basis for predicting crop nitrogen status by measuring leaf reflectance. So, sensors that can easily monitor crop nitrogen amount throughout the growing season at a high resolution to allow producers to reach their production goals, will give useful information to prescribe a crop management on a site-specific basis.
Sunflower is a crop which is taking importance again because it can be used both for food and biofuel purposes, and it is widely cultivated in the South of Spain and other European countries.
The aim of this work was to compare an index related with sunflower nitrogen status, deduced from multispectral images taken from an Unmanned Aerial Vehicle (UAV), with optical data collected with a ground-based platform.
An ADC Lite Tetracam digital cam was mounted on a md4-200 Microdrones to take pictures of a sunflower field during the crop season. ADC Lite Tetracam is a single sensor digital camera designed for capture of visible light wavelength longer than 520 nm and near-infrared wavelength up to 920 nm. The md4-200 Microdrones is an UAV which can be programmed to follow a route defined by several way-points and actions. The ground-based device was a Pacific Vision, Inc. multispectral radiometer. Four images with both systems were taken during the crop season and an index related with nitrogen crop status was calculated from them and compared in a sunflower field that had four irrigation treatments and eight nitrogen application rates, resulting in 32 plots of 7 m by 3.4 m, with a plant density of 7.1 plants m-2.
Calculated Normalized Difference Vegetation Index (NDVI) from both measurement systems was a good indicator of nitrogen applied, but the UAV-based system provided a better estimate than ground-based system because in the first system was possible to eliminate the soil and shadows for calculating the index..
* Corresponding author
1. INTRODUCTION
The goal of every farmer is to produce the crop in a cost-effective manner. The actual cost of sensor technology, computers, global position systems and control systems technology allows to the agriculture to implement new opportunities for farm management (Goddard et al., 1995). In this way is possible to improve the efficiency because of the knowledge of the spatial variability of crop growth not only between fields but also within fields (Blakeman et al., 2000).
Precision agriculture recognizes the inherent spatial variability associated with soil characteristics, land morphology and crop growth, and uses this information to prescribe the most appropriate management strategy on a site-specific basis (Brisco et al., 1998, Peña-Barragan et al., 2010). To reach this task, the most important information related with crop growth is nutrient status, weed infestation, disease and pet affectation and water management. The application of fertilizer nitrogen to field crops is of critical importance because it determines plant’s growth,
vigour, colour and yield (Pearson, 1984). Furthermore, nitrogen has been observed as a nutrient with high spatial variability in a single field, related to its high mobility (Cahn et al., 1994).
Some previous works have shown that is possible to measure crop nitrogen status with optical instruments (i.e. Reyniers et al., 2004). Since most leaf nitrogen is contained in chlorophyll molecules, there is a strong relationship between leaf nitrogen and leaf chlorophyll content (Han et al., 2001), which is the basis for predicting crop nitrogen status by measuring leaf reflectance (Filella et al., 1995). Increase in the visual reflectance is mostly related to the decrease in chlorophyll content resulting from lower nitrogen supply. Increase in near-infrared (NIR) reflectance mostly responds to increase in leaf area index and green biomass, and has been widely reported for wheat crops (Peñuelas et al., 1996).
soil-brightness, environmental effects, shadow, soil colour and moisture (Bannari et al., 1995).
As regard image resolution, low image resolution satellites have proved to be limited in the analysis of crop performance at a field level. Very high resolution images from Ikonos have shown a good measure of crop nitrogen content on a rather small area (Cetin et al., 2002). Wright et al. (2001) observed that total yield and total nitrogen content correlated better to Ikonos imagery than either a hand-held chlorophyll meter or conventional nitrate tissue tets.
So, sensors that can easily monitor crop nitrogen amount throughout the growing season at a high resolution to allow producers to reach their production goals, will give useful information to prescribe a crop management on a site-specific basis. The threat to find an area of the crop with nitrogen deficiency causes the farmer to apply excess fertilizer and results in over-application of nitrogen on some fields, which impacts the cost-effective crop production as well as the environment.
The aim of this work was to compare an index related with sunflower nitrogen status, deduced from multispectral images taken from an Unmanned Aerial Vehicle (UAV), with optical data collected with a ground-based platform.
2. MATERIALS AND METHODS
2.1 Field Experiment
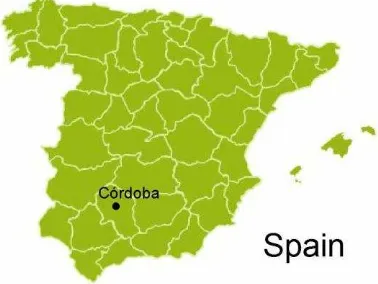
The field experiment was located at the Sustainable Agricultural Institute, situated in Córdoba (37º51’18”N latitude, 4º48’16”W longitude, 90 m altitude), Southern Spain (figure 1). The soil is a deep sandy-loam, classified as Typic Xerofluvent. Córdoba has a Mediterranean-type climate with high temperatures in the summer and most rainfall concentrated between late autumn and spring.
Figure 1. Location of the experimental field in Córdoba, Spain.
The PR64E71 sunflower (Helianthus annuus, L.) hybrid was sown on 23rd February, 2011 at a plant population of 7.1 plants×m-2, which is a plant population widely used by the farmers of this area.
The experimental field was divided into four grids corresponding to a different irrigation treatment (figure 2). Irrigation treatment were: full irrigation, which covered the 100% of crop water need, full irrigation until anthesis and null irrigation from this phenology stage, simulating a typical sunflower season, half irrigation, which covered the 50% of
crop water need, and null irrigation. The irrigation treatment began on 25th May. Each of these four grids was divided into eight elemental plots of 7×3.4 m, corresponding to a nitrogen treatment. So, an amount of 32 elemental plots were obtained. The nitrogen application rates were 0, 10, 20, 30, 40, 50, 60, 70 and 80 kg[N] ha-1 and were applied as a half on sowing date and the second half on 20th May 2011.
Figure 2. Plot layout of the experimental field. R1, R2, R3 and R4 correspond to full irrigation, full irrigation until anthesis,
50% irrigation and no-irrigation treatment, respectively. Numbers 0 to 7 represent the nitrogen application rate.
2.2 Optical measurements
2.2.1 Images. An ADC Lite Tetracam digital cam was
mounted on a md4-200 Microdrones to take pictures of a sunflower field during the crop season. ADC Lite Tetracam is a single sensor digital camera designed for capture of visible light wavelength longer than 520 nm and near-infrared wavelength up to 920 nm (http://www.tetracam.com/). The md4-200 Microdrones (http://www.microdrones.com/index-en.php) is an UAV which can be programmed to follow a route defined by several way-points and actions. With a flight height of 75 m, in combination with the cam focal length, only one picture was necessary to cover the whole experimental field.
Four images were taken during the crop season: 27th April, 19th May, 30th May and 23rd June. Furthermore, on 27th April, a picture was taken with a calibrated RGB cam (figure 3). Previously, several targets were placed on ground surface in the plots corners (see detail in figure 3). Coordinates of the four field experiment targets were measured with a Trimble R6 GPS receptor to georeference the image. These four targets were kept during all crop season and then, the pictures from Tetracam could be georeferenced too. The Idrisi software was used to carry out this task (http://www.clarklabs.org/).
NDVI of each elemental plot was calculated from red and NIR bands of Tetracam pictures using a mask with the classification output.
Figure 3. RGB field experiment image with targets to georeference. In the left up corner a detail of a target.
2.2.2 Ground device measurements. The ground-based
device was a Pacific Vision, Inc. multispectral radiometer. Four measurements at the same date when the images were taken were carried out. The radiometer uses photodiodes as light transducers. Downward facing sensors measure the crop radiance and upward facing sensors correct for incident irradiation from the Sun and the Sky. Wavelength range measurement of this radiometer is from 517 to 1182 nm, with a resolution of 16 bits. With the radiometer sensor field of view and the sensor placed 1 m above the canopy, the measured spot was circular with 50 cm diameter. Nine measurements were taken in the three central rows of each elemental plot. Files saving the measurements were processed by a informatics program developed by the authors with VisualBasic 6.0. Wavelength of 637 nm for red and 744 nm for NIR were used to calculate the NDVI.
3. RESULTS AND DISCUSSION
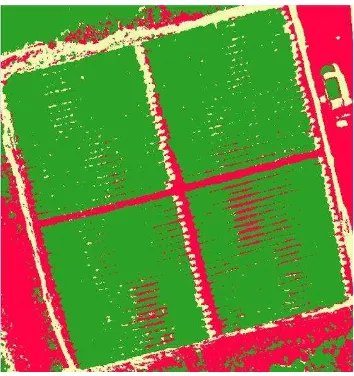
The classification process carried out on Tetracam images to extract the crop, yield good results for the four images, with producer and user precision over 98% in all cases. Figure 4 shows the result of the classification carried out on the image taken on 30th May, where green colour represents vegetation, red represents bare soil and white represents shadows. Here, one can observe that shadows and gaps between plants have been detected with high accuracy, which is possible because the image resolution. This characteristic represents an advantage over current satellites image, which have a ground-resolution of one meter or more. At 75 m height, the Tetracam image reach a ground-resolution of 2.8 cm. Reyniers and Vrindts (2006), working with wheat and Ikonos images, found that pixel size caused inaccuracy in the NDVI estimation because some pixels covered plot with different treatments. To calculate NDVI a mask for every elemental plot, taking into account the output classification and considering only the central area, as shows the figure 5, was used.
Figure 4. Image classification output corresponding to Tetracam image taken on 30th May. Green colour represents vegetation,
red represents bare soil and white represents shadow.
Figure 5. Masks taken into account to calculate the NDVI. All these masks are place in the central area of an elemental plot
and consider the image classification output.
27th March statistically significant relation at the 90% confidence level.
0 1 2 3 4 5 6 7 8
Figure 6. NDVI calculated from radiometer measurements (left column) and from Tetracam images (right column) in relation to
applied nitrogen and the straight lines fitted, for every measurement date. Details of fitted lines are related in table 1. The highest correlation coefficients were found for both systems on 19th May: 0.801 and 0.712 for Tetracam and radiometer system, respectively. It could be by the cloudy day, which caused smooth shadows in the crop. However, on 23rd June, the correlation coefficient for Tetracam system was le lowest due to bad light conditions since the picture was taken too late and the incident light angle was very low.
The NDVI from both systems was relativity highly correlated (R=0.834) as shown by figure 7. The NDVI values from radiometer had a broader range of variation than values from Tetracam images and they were lower than those from Tetracam images. Similar results were obtained by Reyniers and Vtindts (2006) working with a wheat crop, a similar radiometer and an Ikonos image. They found that the NDVI values of Ikonos were lower than values from radiometer but the range was larger.
NDVI from Tetracam images
Figure 7. Relation between the NDVI from Tetracam images and the NDVI from radiometer averaged per elemental plot. All
measurements have been taken into account. Correlation coefficient = 0.834
4. CONCLUSIONS
The NDVI of both measurements systems was good related to applied nitrogen in the field: except for the first date, at an early crop development stage, all fitted regressions were statistically significant.
Images from a Tetracam on-board of an UAV can be a useful information tool for detecting nitrogen deficiencies at in-field level. Image process is easy and data can be ready in a short time. In this way, the farmer can take decisions to prescribe the most appropriate management strategy on a site-specific basis and solve nitrogen deficit during de crop season.
Nevertheless, the flight autonomy is limited and the covered area is too small. Another limitation for UAV could be the weather conditions, if it is windy at a relativity low velocity, the UAV can have problems to flight. So, is necessary to develop economics UAV which have not these problems. Furthermore, the possibility to use hyperspectral sensors could to advance in the knowledge of crops nitrogen status.
Blakeman, R.H., Bryson, R., Dampney, P., 2000. Assessing crop condition in real time using high resolution satellite imagery. In: Aspects of Applied Biology 60, Remote Sensing in Agriculture, the Association of Applied Biologists, c/o Horticulture research International, Wellebourne, Warwick CV35 9EF, UK, pp. 163-172.
Brisco, B., Brown, R.J., Hirose, T., McNairn, H., Staenz, K., 1998. Precision agriculture and the role of remote sensing: a review. Canadian Journal of Remote Sensing, 24, pp. 315-327.
Cahn, M.D., Hummel, J.W., Brouer, B.H., 1994. Spatial analysis of soil fertility for site-specific crop management. Soil Science Society of America Journal, 58, pp. 1240-1248.
Cetin, H., Mueller, T.G. and Carter, P., 2002. Comparison of Ikonos and RDACS imagery for detection of nitrogen deficiency in corn. The high Spatial Resolution Commercial Imagery Workshop. US Geological Survey National Center, Reston, VA, USA, pp. 25-27.
Goddard, T.W., Lachapelle, G., Cannon, M.E., Penney, D.C., McKenzie, R.C., 1995. The potential of GPS and GIS in precision agriculture. In: Proceedings Geomatique V: La Route
de L’Innovation, Montreal, PQ, Canada, 9-10 November, pp 75-89 (Canadian Institute of Geomatics).
Filella, I., Serrano, L., Peñuelas, J., 1995. Evaluating wheat nitrogen status with canopy reflectance índices and discriminat analysis. Crop Science, 35, pp. 1400-1405.
Han, S., Hedrickson, L., Ni, B., 2001. Camparison of satellite remote sensing and aerial photography for ability to detect in-season nitrogen stress in corn. An ASAE meeting presentation. Paper No. 01-1142, ASAE, St Joseph, MI, USA.
http://www.tetracam.com/ (accessed 1 July 2011)
http://www.microdrones.com/index-en.php (accessed 1 July 2011)
http://www.clarklabs.org/ (accessed 1 July 2011)
Pearson, J.P., 1984. Control of Crop Productivity, Academic Press, New York.
Peña-Barragan, J.M., Lopez-Granados, F., Jurado-Exposito, M., García-Torres, L., Sunflower yield related to multitemporal aereal photography, land elevation and weed infestation. Precision Agriculture, 11, pp. 568-585.
Peñuelas, J., Filella, I., Serrano, L., Save, R., 1996. Cell Wall elasticity and wáter index (R970 nm/R900 nm) in wheat under different nitrogen availabilities. International Journal of Remote Sensing, 17, pp. 373-382.
Reyniers, M., Vrinsts, E., Baerdemaeker, J., 2004. Fine-scaled optical detection of nitrogen stress in grain crops. Optical Engineering, 43, pp. 3119-3129.
Reyniers, M., Vrinsts, E., 2006. Measuring wheat nitrogen status from space and ground-based platform. International Journal of Remote Sensing, 27(3), pp. 549-567.
Wright, D.L., Rasmussen, V.P., Ramsey, R.D., Neale, C.M.U., Harman, K., Searle, G., Grant, D., Hole, C., 2001. Nitrogen stress detection using remote sensing. The 4th
Annual National Wheat Industry Research Forum, New Orleans, LA, USA, 1-2 February 2001 (National Association of Wheat Growers/US Wheat Associates/ Wheat Foods Council).
6. ACKNOWLEDGEMENTS
![Table 1. Equations of the fitted models: Applied nitrogen (kg[N]×hastatistically significant relation at the 90% confidence level](https://thumb-ap.123doks.com/thumbv2/123dok/3227811.1395967/4.595.344.502.272.411/table-equations-applied-nitrogen-hastatistically-significant-relation-confidence.webp)
