SELECTIVE TRANSPORT AND ARMOURED LAYER DEVELOPMENT IN
NON-UNIFORM BED MATERIALS
PART 2: NUMERICAL MODEL VERIFICATION
Arie Setiadi Moerwanto
Pusat Penelitian dan Pengembangan Sumber Daya Air Jl. Ir. H. Juanda no. 193, Bandung
E-Mail: [email protected] Diterima: 13 Februari 2012; Disetujui: 16 Maret 2012
ABSTRAK
Ukuran butir, rapat massa dan posisi masing-masing butir-butir material terhadap aliran akan sangat mempengaruhi gerak mula masing-masing butir material dasar sungai. Material dengan ukuran butir yang lebih besar menanggung efek peningkatan gaya seret. Fenomena angkutan sedimen terpilah, pembentukan lapisan perisai dan pembentukan corak dasar sungai terkait secara integral dengan angkutan material dasar sungai, sehingga kecermatan pensimulasian fenomena tersebut akan sangat mempengaruhi ketelitian analisis kedalaman aliran, laju muatan sedimen dasar, laju angkutan sedimen layang dan pada akhirnya akan mempengaruhi kecermatan analisis perubahan morfologi sungai. Verifikasi submodel numerik yang dikembangkan dan merupakan pokok bahasan tulisan ini menunjukkan bahwa submodel memiliki objek kerja yang sangat baik dan mampu mensimulasikan pembentukan lapisan perisai pada dasar sungai dengan material dasar sangat tidak seragam pada kondisi aliran tidak langgeng. Adopsi struktur pemodelan yang modular, dilengkapi dengan berbagai metode untuk memprediksi tebal lapisan aktif dan laju angkutan sedimen memberikan fleksibilitas untuk disesuaikan dengan berbagai kondisi lapangan. Lapisan perisai menghambat pembentukan corak dasar sungai, serta menurunkan laju angkutan sedimen. Kondisi ini mengakibatkan perbedaan cepat rambat gelombang perubahan hidrodinamika pada permukaan air dan cepat rambat gelombang perubahan pada dasar sungai menjadi bertambah lebar, memberikan celah yang lebih lebar untuk penerapan metode pemisahan (decoupled) penyelesaian persamaan dasar pemodelan numerik morfologi sungai.
Kata Kunci: Material dasar sungai tidak seragam, angkutan sedimen terpilah, corak dasar sungai, lapisan perisai.
ABSTRACT
Particle size, shape, density and exposure to the flow determine the resistance to movement of an individual particle. Larger grains have an acceleration effect on the movement of the mixture. The selective transport, armoured layer development and geometry of bed forms are integrally linked to the bed material transport, hence the accuracy of simulating those phenomena will also influence the accuracy of analysis of flow depth, bed load transport rate, suspended load concentration and later on river morphology changes. Verification of the developed sub-model which is the main objective of this study presents that the sub-model is able to simulate rivers with various morphological and hydraulic conditions, to include rivers with graded bed materials under unsteady flow conditions. The model performs quite well in simulating the armoured layer development. Adoption of modular structure, completed with various predictors of active layer thickness and sediment transport rate make it could easily be tuned to meet the field conditions. Armoured layers developed in rivers detain the development of bed-forms, lower the rate of sediment transport and make the difference between the celerity disturbances waves on water surface and celerity on bed surface wider. These conditions provide a wider window for the adoption of decouple method of solution in solving the governing equations of river morphological models.
Keywords: Non-uniform bed materials, selective sediment transport, bed forms, armoured layer.
INTRODUCTION
This paper is the second part of research papers dealing with numerical modeling of selective transport and armoured layer
development in non-uniform bed materials. While the first part of the research papers has described in detail the literature review and theoretical background to support numerical model
18 Jurnal Teknik Hidraulik Vol. 3, No. 1, Juni 2012 : 1 - 102 development of selective transport, prediction of
active layer thickness, schematization of bed materials exchange, and defining alluvial bed roughness and armoured layer development in non-uniform bed materials (Moerwanto, 2011b), this second part will focus on verification and evaluation of the performances of the developed numerical model.
Alongside, extensive flume experiments were carried out at the Department of Civil Engineering, University of Auckland to gain a detailed understanding of the development of armoured layers in non-uniform bed materials (Chin, 1985 and Chin et al., 1994). A custom built flume incorporated a recessed sediment table which could be slowly raised. With this setup, the sediment table could be raised according to the rate of erosion and thereby maintain the approach flow depth and the approach bed shear stress constant throughout the experiment. In such a controlled hydraulic environment, the number of variables that determine the development of the armoured layer are reduced. In this case, only variables related to sediment property and composition will determine the armouring. Later, results of these experiments are used to verify the performance of the developed numerical model.
AIMS
This paper is aimed to present the verification results on the developed a sub-numerical model that able to simulate selective transport and armoured layer development in non-uniform bed materials under unsteady flow conditions using finite element method. This study is carried out under the scheme of developing A Riverine Fully Coupled Finite Element Model with Sediment Transport Sub-processes as a required tool to support the adaptation policy to respond to the global climate change.
LITERATURE REVIEW
It has been described in the first part of this paper (Moerwanto, 2011b) that to achieve the desirable model, the following field phenomena of bed load transport in non-uniform bed materials under unsteady flow conditions are incorporated and simulated by the selective transport and armoured layer development sub-model:
1 Formation of alluvial bed roughness 2 Prediction of active layer thickness, 3 Schematization of bed materials exchange, 4 Evaluation of actual size fraction sediment
transport, capacity under unsteady flows conditions by including the temporal and spatial lag effects of the alluvial reach, and 5 Development of armoured layer.
To make the designed sub-model able to simulate those field conditions, the following methods are adopted to manage each specific phenomenon (Moerwanto, 2011b):
1) Adopted method for formulating size fraction transport of non-uniform bed materials
Most of the transport formulae are developed based on a proportional relation of the excess of grain shear stress beyond that needed for incipient motion,
(
')
.cr b τ
τ − This condition infers that to cope with the non-uniform bed material both formulations of the exposure correction factor, i.e. modifying the grain shear stress '
b τ , or adjusting the critical bed shear stress τcr, should yield a similar result. Therefore the present designed sub-model adopts the following techniques to cope with the non-uniform bed material:
a) the modified version of the transport formula is adopted in cases where the modification of a particular transport formula has been proposed (viz. Ackers and White, MPM and Paintal formulae), otherwise
b) the exposure correction factor for the critical bed shear stress is incorporated into a sediment transport formula derived for uniform bed material.
Modular structure of the present model makes any technique for formulating size fraction transport can easily be adopted and used as a tuned variable to meet the field conditions. Tests for evaluating the performances of each technique is carried out in this study.
2) Adopted predictor for the active layer thickness
The present sub-model is developed by adopting a modular structure, hence any predictor can be easily incorporated and used as a tuned variable. Since there is no outstanding method, the following considerations can guide the selection of an appropriate predictor for the active layer thickness:
a) the active layer thickness must be thicker than the bed load layer. It is incurred since the bed load layer is a part of the active layer,
b) a constant active layer thickness as proposed by Bennett and Nordin (1977) is considerable. Even though it does not represent the active layer development, its simplicity compared to other methods is an attraction in itself. This method narrows down the number of parameters in the bed material sorting sub-process. This choice could be altered when
extensive data for calibration is available. In these conditions, a relationship based on bed form height can also be used to estimate a reasonable thickness for the active layer. c) Due to the wide range of flume and field data
used to develop the van Rijn bed form predictor (1984b, 1993), this predictor is preferred to estimate the active layer thickness.
3) Adopted alluvial bed roughness predictor
The dynamic wave approach for the momentum equation is implemented in the present model. As a consequence, the temporal lag effect on the effective alluvial bed roughness must also be included. To satisfy these requirements, the following features are employed in the present model:
a) The Chezy coefficient is used to represent the alluvial bed roughness. As a consequence, the predicted bed roughness given by any predictor must first be translated into a Chezy coefficient before being incorporated in the discrete momentum equation.
b) Predictors of alluvial bed roughness which are based on the grain and bed form parameters are preferred. The contribution of grain roughness is basically independent of the flow unsteadiness. Meanwhile, the contribution of the bed forms depends on the unsteadiness of the flow. The clear separation in quantifying the contribution of the grain and the bed form roughness means that the required adjustments due to unsteady flow conditions will only be implemented to analyze the contribution of bed forms’ roughness.
c) To cope with the temporal lag effect of the alluvial stream due to unsteady flow conditions, the designed model adopts the equivalent steady discharge model proposed by Phillips (1984) and Phillips and Sutherland (1990). In Phillip’s model, the unsteady flow hydrograph is basically transformed into a series of equivalent steady discharges. Later, the hydrodynamic data determined from these steady discharges is used to determine the geometric dimensions of the bed forms in unsteady flow conditions (Moerwanto, 2011a). Armoured layers developed in rivers with graded bed materials may detain the development of bed-forms. This phenomenon is implicitly analysed in this present study.
METHODOLOGY
Three basic approaches characterize this research:
1 The sub-model developed for simulating selective transport and armoured layer development in non-uniform bed materials under unsteady flow conditions is designed by implementing the modularity advantages of finite element solution.
2 The performances of the sub-model are steps by steps verified by comparing its prediction results with set of data resulted in from physical hydraulic laboratory tests. 3 To minimize the influence of changes on the
hydrodynamic conditions triggered by development of local scouring and bed degradation, a flume completed with an adjustable sediment table is utilized.
Step by step verification tests are carried out and reported in this paper, to include basic design of the laboratory flume data (Chin, 1985) used in this study.
VALIDATION OF THE DESIGNED
SUB-MODEL
1 Flume experiments
1) Apparatus
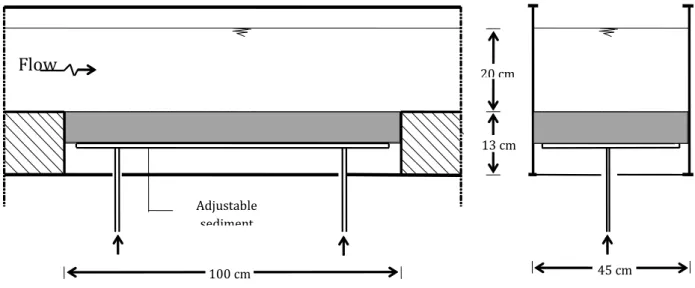
The experiments were carried out in a 19 m long non-recirculation flume, with a width of 0.45 m and depth of 0.44 m (Figure 1). The sediment table was 1 m long and was as wide as the flume. The sediment table could accommodate a sediment layer up to 13 cm deep and was located 10.43 meters downstream from the flume inlet. The part of the flume upstream of the sediment table was named the approach reach. Its length was estimated to be sufficient for the development of a fully turbulent boundary layer. To simulate the roughness of an armoured bed, a mixture of equal amounts by volume of the two coarsest sieve sizes of the tested sediments was sprayed onto the bed of the approach reach which had been coated beforehand with adhesive.
2) Test materials
The sediment used in the experiments was produced by mixing 11 basic sizes of uniform grains in different proportions, resulting in 9 mixtures of non-uniform materials. Only the experiment of Series 4-1 to 4-4 were simulated and discussed in this paper. The initial sediment gradation of the mixture of non-uniform materials used in the Series 4-1 to 4-4 experiments is presented in Figure 3.
20 Jurnal Teknik Hidraulik Vol. 3, No. 1, Juni 2012 : 17 – 28
Figure 1 Experimental setup of the flume used for verification (Chin, 1985).
Table 1 Hydrodynamic data for the flume experiments on armoured layer development (adapted
from Chin, 1985).
SERIES u* [m/s] ks [mm] h [m] u [m/s] Bed slope Q [m3/s]
4-1 0.074 18.6 0.20 0.780 5.270 E-3 0.070
4-2 0.085 18.6 0.20 0.896 6.956 E-3 0.081
4-3 0.090 18.6 0.20 0.949 8.150 E-3 0.085
4-4 0.096 18.6 0.20 0.956 8.873 E-3 0.086
3) Hydrodynamic data of experiments
The hydrodynamic data which was reported for each experiment included water depth (h), shear velocity (u*) and Nikuradse roughness of the approach bed (ks). For experiment Series 4-4, additional data that was also reported, ie. energy slope and flow velocity at several points in the vertical direction. The flume conditions, particularly the roughness of the approach bed and the material used in a series of experiments were kept the same. Based on this setup, the following hydrodynamic variables which are required for the model simulations may be derived and are presented in Table 1.
4) Experiment procedure
The desired sediment mixture was loaded into the recess above the sediment table and smoothed. The excess air in the bed was removed by slowly saturating the bed with water. The flow
was then gradually increased until the predetermined discharge was reached
Since there was no supply of sediment from upstream, erosion occurred. The initial bed level was maintained by continually elevating the sediment table. Therefore, the term of depth of erosion in the experiments refers to the height of this vertical adjustment. No detailed erosion patterns were reported. The experiment was stopped when there was no noticeable erosion occurring due to armouring of the bed.
At the end of the experiment, the bed was drained and then dried using a fan heater. Paraffin wax was used to obtain the armoured layer samples. These samples were then processed to obtain the gradation of the armoured layer. Since the amount of material eroded from the sediment recess was too small to be accurately sampled, the eroded material was not sampled.
Adjustable sediment
100 cm 20 cm 13 cm 45 cm
Flow
Figure 2 Schematized flume in numerical model 2 Model simulation
1) Modelling of the flume experiments
The first finite element (FE) node is located on the fixed part of the bed, ie. just upstream of the sediment table, while the last FE node is located on the fixed part of the bed, ie. just downstream of the sediment table. Ten uniform elements are used in the numerical model (Figure 2).
2) Internal boundaries and simulation arrangement
Two nodes, ie. the most upstream node and the most downstream node are not located on the sediment recess table. Therefore, these nodes require a special treatment. Since the approach flow is sediment free water and the approach reach is made from non-erodible material, hence no sedimentation nor scouring can occur at the most upstream node. Considering these conditions, the most upstream node is simulated as a fixed bed. A slightly different case occurs at the most downstream node. Aggradation may happen at this node, but erosion lower than the initial bed elevation of this node will not be possible.
In the laboratory, in order to maintain a steady flow depth, the sediment recess table was continuously adjusted upwards according to the erosion rate. No further details were given about which depth of erosion was chosen for this adjustment. No erosion patterns were reported that might be used to trace back the procedure for adjusting the bed level by raising the sediment table.
To cope with this lack of information, the predicted minimum depth of erosion at the sediment table given by the numerical model is selected to adjust the sediment table. This setup is carried out to
hinder a condition where the adjusted bed level is higher than the approach reach. The model simulates the flume experiments by following the computational procedure below:
a) Taking into account the boundary conditions, the hydrodynamic parameters are evaluated by solving the continuity and momentum equations for the sediment-water mixture. The bed level changes are then estimated by solving the sediment mass balance equation. b) The change in the composition of the sediment
mixture is analyzed by evaluating the sediment mass balance equation for each sediment size class.
c) Before stepping to the next time level, the bed level at each node, except for the first and the last node, is adjusted by adding a value equal to the minimum erosion depth of the reach.
3) Schematization of non-uniform bed materials
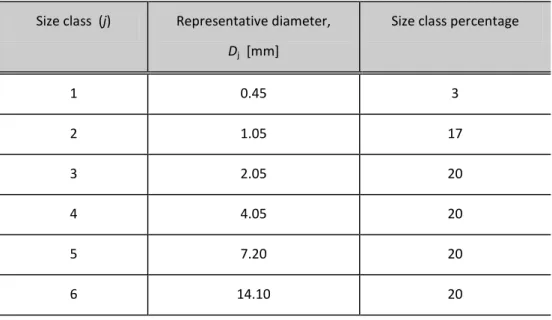
The characterization of the sediment mixture into more than four size classes to describe the total transport rate is not necessary (Ribberink, 1987 and Thein, 1989). However, Ribberink (1987) also noted that the mean grain size of the transported mixture is influenced by the splitting of the sediment mixture. It is noted particularly for conditions where the bed shear stresses are close to the initiation of particle motion. Considering these criteria and the aim of the experiments which is for analyzing the development of the armoured layer, the bed material mixture is divided up into six size classes for use in the present model. The representative diameter and percentage of each size class is shown in Table 2 and Figure 3.
1 0.0 fixed bed fixed Chainage [m]: Node number :
Sediment Push rod Push rod 2 0.1 3 0.2 4 0.3 5 0.4 6 0.5 7 0.6 8 0.7 9 0.8 11 1.0 10 0.9 Flow
Jurnal Teknik Hidraulik Vol. 3, No. 1, Juni 2012 : 17 – 28 22
Table 2 Size class data of the initial sediment mixture.
Size class (j) Representative diameter, Dj [mm]
Size class percentage
1 0.45 3 2 1.05 17 3 2.05 20 4 4.05 20 5 7.20 20 6 14.10 20
Figure 3 Initial particle size distribution of the sediment. Model calibration
1 Sediment transport formula
The experiment of Chin is actually a typical example of non-equilibrium sediment transport conditions. However, the spatial lag effects of the bed load module should not necessarily be utilised in these simulations due to the following constraints:
1) No experimental data of sediment transport rate was reported. This condition restricts the calibration processes which are required to determine the spatial lag coefficient, CSL (Moerwanto, 2011a).
2) The erodible reach of the experiments is very short, therefore the linear elements used are also small. To simulate this setup, the van Rijn pick-up function (1984b) for bed load transport is appropriate. 0 25 50 75 100 0.1 1.0 10.0 100.0 Particle size [mm] P ercen ta g e f in er
Initial lab. gradation (Chin, 1985) Initial model gradation
For the case of a short erodible channel, the van Rijn pick-up function for bed load (1984b) can be included in relation for the bed load transport rate as follows:
(
)
) ( . . 00033 . 0 0 5 . 0 50 5 . 1 3 . 0 * 0 x x B D g T D Q Q act sb sb − ∆ + = (1) whereBact , the active portion of channel bed width in which erosion and deposition takes place, [m];
D* , dimensionless particle diameter, defined
as 3 1 2 50 ∆
ν
g D ;D50 , particle diameter at which 50% by weight is finer, [m];
0
sb
Q , bed load transport rate at the upstream end of the reach being considered, [m3/s]; T , dimensionless transport stage parameter,
defined as 2 * 2 * 2 * cr cr u u u − u* , shear velocity, [m/s]; cr
u* , critical shear velocity for the initiation of particle motion, [m/s];
x , distance along the erodible reach, [m]; ∆ , sediment relative density under water,
[-];
ν , kinematic viscosity of fluid, [m2/s];
subscript 0 , the upstream limit of the reach being considered.
2 The exposure correction factor
Implementing a particular exposure correction factor for a non-uniform bed material for analysing the development of the armoured layer should be taken carefully. Shielding and exposing phenomena occur particularly in flow conditions where the tractive force is slightly higher than the threshold of particles motion. Moreover, sorting of the bed material is apparently damped by the adopted exposure correction factor. The magnitude of the damping effect is significantly affected by the exposure correction factor.
The applicability of two exposure correction factors, ie. the Egiazaroff correction factor and the Ashida correction factor, are assessed in the present study. Both correction factors are applied to the simulations of the flume experiments. Data for test Series 4-1 is chosen for this assessment. This selection is based on a criterion that the hydrodynamic conditions of test Series 4-1 are closer to the threshold of sediment movement compared to the other experimental conditions. It is in these conditions that the shielding and exposing phenomena become apparent. The model results in simulating the development of an armoured layer are compared to the experimental results in Figure 4.
Figure 4 Effect of the exposure correction factor on the particle size distribution of the fully
developed armoured layer
.
0 25 50 75 100 0.1 1.0 10.0 100.0 Particle size [mm] P e r ce n ta g e f in e r
Laboratory data (Chin, 1985): Armoured layer gradation Model predicted gradation: Using correction of Egiazaroff Using correction of Ashida Without correction
24 Jurnal Teknik Hidraulik Vol. 3, No. 1, Juni 2012 : 1 - 102 The figure also contains a predicted
armoured layer gradation given by the model without incorporating any exposure correction factor. The agreement between the results of the model without a correction factor and the flume data is poor. Only sediment size classes 5 and 6 remain in the armoured layer. This condition is caused by the absence of the shielding effect of the finer size classes. The Ashida exposure correction factor was derived in combination with the Meyer-Peter and Muller formula for bed load sediment transport. The development was aimed at improving the Egiazaroff exposure correction factor. This improvement was particularly intended for particle sizes satisfying. Comparing the gradation of the developed armoured layer which is given by each correction factor with the experimental results, the following conclusions may be drawn:
i) The Ashida correction gives a low shielding correction for the sediment size classes where their representative diameter are smaller than the mean diameters of the mixture. It can be seen in Figure 4 that this low shielding has caused a condition where the sediment size classes 1 and 2 are completely removed from the mixture. These results disagree with the flume data. The Egiazaroff exposure correction results in a better representation of the shielding effect than those of the Ashida for the sediment size classes where Dj < Dm.
ii) The Ashida exposure correction gives a better representation of the exposure effect than those of the Egiazaroff for the sediment size classes where Dj are slightly larger than Dm. An almost horizontal line between the sediment size classes 4 and 5 in Figure 4 indicates that only a small part of the sediment size class 5 is remain in the mixture. This prediction is agreeable to the flume data. iii) Both exposure correction factors give a
comparable correction for the remaining sediment size classes.
Based on these comparison results, it can be concluded that the Egiazaroff exposure correction factor is preferred for simulating the experimental conditions.
Model results and discussion
In order to avoid any unnecessary numerical shocks to the system when the upward bed level adjustment is made, a small time step of ∆t = 2.5 seconds is taken. Using this numerical data, the simulations have been conducted with a Courant number for the sediment movement of Crs = 0.02 corresponding to the initial conditions. The simulation results are presented as erosion depth and grading curve for the developed armoured layer and are given in Figures 5 to 8.
Figure 5 Erosion depth with the effect of bed armouring is included
0 10 20 30 40 50 60 0 50 100 150 200 250 Time [minutes] D e p th o f e r o si o n [m m
] Laboratory data(C hin, 1985):
Series 4-1 Series 4-2 Series 4-3
Mode l pre diction:
Series 4-1 Series 4-2 Series 4-3
It is evident in Figure 5 that the model tends to underestimate the depth of erosion. This trend is evident in all the experiments, with a discrepancy ratio of about 29% in Series 4-1 to 47% in Series 4-3. Since no data concerning the rate of sediment transport was measured, further model calibration cannot be done.
Aside from the results of test Series 4-3, the predicted grading curve of the resulting armoured layer agrees with the experimental data. At the end of each simulation, there is a tendency for only sediment size classes 3, 4 and 6 to remain. This trend is becoming more pronounced in the simulation Series 4-3.
Figure 6 also indicates the sensitivity of the results to the number of sediment size classes. The results of the model using 6 size classes are compared with those of the model using 4 size classes. It is evident in Figure 5 that a better prediction will be achieved when more size classes are used to characterize the sediment mixture. Moreover, smaller size classes need to be taken close to the mean diameter. However, for practical purposes the criteria proposed by Ribberink (1987) to characterize the sediment mixture still
prevail. Considering the fact that only a limited model calibration can be done, the model performance on simulating armoured layer development is good.
The results indicate that the sorting and armouring sub-model performs reasonably well. The disagreement between the predicted and measured results, particularly for the erosion depth may be caused by the following:
1) some additional judgment is needed in choosing which erosion depth should be used to adjust the bed level changes, and
2) the chosen bed load transport formula and the exposure correction factor may well give rise to discrepancies between the model and the experiment results.
The available laboratory data does not permit any further attempt at calibration. This assumption is supported by the facts that the formula used for predicting bed load transport rate had a relative standard error about 30% (van Rijn, 1984b).
Figure 6 Predicted particle size distribution for the armoured layer after 6 hours for the Series 4-1 experiment.
0 25 50 75 100 0.1 1.0 10.0 100.0 Particle size [mm] P e r ce n ta g e f in e r
Laboratory data (Chin, 1985): Initial gradation
Armoured layer gradation Model data:
Initial gradation
Armoured layer (using 6 size classes) Armoured layer (using 4 size classes)
26 Jurnal Teknik Hidraulik Vol. 3, No. 1, Juni 2012 : 1 - 102
Figure 7 Predicted particle size distribution for the armoured layer after 6 hours for the Series 4-2 experiments.
Figure 8 Predicted particle size distribution for the armoured layer after 6 hours for the Series 4-3 experiments.
0 25 50 75 100 0.1 1.0 10.0 100.0 Particle size [mm] P e r ce n ta g e f in e r
Laboratory data (C hin, 1985):
Initial gradation
Armoured layer gradation
Mode l data:
Initial gradation
Armoured layer gradation
0 25 50 75 100 0.1 1.0 10.0 100.0 Particle size [mm] P e r ce n ta g e f in e r
Laboratory data (C hin, 1985):
Initial gradation
Armoured layer gradation
Mode l data:
Initial gradation
The results indicate that the sorting and armouring sub-model performs reasonably well. The disagreement between the predicted and measured results, particularly for the erosion depth may be caused by the following:
1) some additional judgment is needed in choosing which erosion depth should be used to adjust the bed level changes, and
2) the chosen bed load transport formula and the exposure correction factor may well give rise to discrepancies between the model and the experiment results.
The available laboratory data does not permit any further attempt at calibration. This assumption is supported by the facts that the formula used for predicting bed load transport rate had a relative standard error about 30% (van Rijn, 1984b).
Other important phenomena raised from the test results are apparent evidences that armoured layer detain the development of bed-forms and lowered the rate of sediment transport. The absence of bed-forms diminishes the spatial and temporal lag effects of bed-load transport, while the lowering of bed-load transport rate results in the difference between the celerity disturbances waves on the water surface and celerity on bed surface becomes wider. These phenomena show that in those conditions the decouple method of solution is actually appropriate enough to solve the governing equations of the developed Riverine Finite Element Model with Sediment Transport Sub-processes.
CONCLUSIONS
Verification tests by comparing the numerical model results with laboratory flume test results shows that the adoption of the present selective transport and armour sub model gives the developed river morphology model be able to simulate rivers with various morphological and hydraulic conditions, to include rivers with graded bed materials under unsteady flow conditions. The model performs quite well in simulating the armoured layer development.
A wide discrepancy was present when the developed model was utilized for simulating the depth of erosion in the flume tests. Unfortunately this discrepancy could not be further verified since no flume data concerning the sediment transport rate was reported on those tests.
The present model is developed with a modular structure, any predictor of active layer thickness can be easily incorporated and used as a
tuned variable to meet the field conditions. However, the van Rijn bed form predictor (1984b, 1993) is proposed to be used to estimate the active layer thickness.
Armoured layers developed in rivers with graded bed materials will detain the development of bed-forms and lowered the rate of sediment transport. In these field conditions the difference between the celerity disturbances waves on the water surface and celerity on bed surface becomes wider, hence the window of appropriateness to adopt the decouple method of solution is becoming wider to solve the governing equations of the developed Riverine Finite Element Model with Sediment Transport Sub-processes.
REFERENCES
Ackers, P. and W.R. White .1980. Bed material transport: A theory for total load and its verification. International Symposium on River Sedimentation, Beijing, Paper B10. Ashida, K. and M. Michiue. 1973. Studies on bed load
transport rate in open channel flows. Proceedings of IAHR, International Symposium on River Mechanics. A.I.T., Bangkok, Vol. 1, Paper A-36, pp. 407-418. Bennett, J.P. and C.F. Nordin. 1977. Simulation of
sediment transport and armouring. Hydrological Sciences Bulletin, Vol. XXII, No. 4, pp. 555-569.
Borah, D.K., C.V. Alonso, and S.N. Prasad. 1982. Routing graded sediments in streams: Formulations. Journal of Hydraulic Engi-neering, ASCE, Vol. 108, No. HY12, pp. 1486-1503.
Chin, C.O. 1985. Stream bed armouring. Report no. 403 - Department of Civil Engineering, University of Auckland.
Chin, C.O., B.W. Melville and A.J. Raudkivi. 1994. Streambed armouring. Journal of Hydraulic Engineering, ASCE, Vol 120, No. 8, pp. 899-918.
Moerwanto, A.S. 2011a. Temporal Lag Effects of Alluvial System Under Unsteady Flow Conditions, Jurnal Teknik Hidraulik, Vol. 2, no. 1, Juni 2011, pp. 1-16.
Moerwanto, A.S. 2011b. Selective Transport And Armoured Layer Development In Non-Uniform Bed Materials. Part 1: Numerical Model Development, Jurnal Teknik Hidraulik, Vol. 2, no. 2, Desember 2011, pp. 97-112.
28 Jurnal Teknik Hidraulik Vol. 3, No. 1, Juni 2012 : 1 - 102 Phillips, B.C. 1984. Spatial and temporal lag effects in
bed-load sediment transport - Civil Engineering Research Report No. 84-10 - Reprint of PhD Thesis, Department of Civil Engineering, University of Canterbury. Phillips, B.C. and A. J. Sutherland. 1990. Temporal lag
effects in bed load sediment transport. Journal of Hydraulic Research, IAHR, Vol. 28, No. 1, pp. 5-23.
Ribberink, J.S. 1987. Mathematical modeling of one-dimensional morphological changes in rivers with non-uniform sediment. Delft University of Technology, PhD Thesis. Rijn, L.C. van. 1984b. Sediment transport, Part III Bed
forms and alluvial roughness. Journal of Hydraulic Engineering, ASCE, Vol. 110, No. 2, pp. 1733-1754.
Rijn, L.C. van. 1993. Principles of sediment transport in rivers, estuaries and coastal seas. Aqua Publications, Amsterdam.
Thein, K.N.N. 1989. One-dimensional morphological modelling of graded sediments. IHE - Delft, Msc Thesis.
Yalin, M.S. 1977. On the physical modelling of dunes. Proceedings of XVIIth Congress, IAHR, Baden-Baden, Vol. 1, Paper A4, pp. 25-32.


![Figure 5 Erosion depth with the effect of bed armouring is included 0102030405060050100150200 250Time [minutes]](https://thumb-ap.123doks.com/thumbv2/123dok/4130546.3066246/8.892.99.755.693.1091/figure-erosion-depth-effect-armouring-included-time-minutes.webp)


