Preliminary Identification of Road Network Vulnerability Due to
Expansion of Status of Mount Merapi Eruption-Impacted Areas
in Yogyakarta Special Region
Imam Muthohar
#, Hardiansyah
*, Budi Hartanto
#, Sigit Priyanto
*#Civil and Enveronmental Engineering, Faculty Of Engineering, Universitas Gadjah Mada,
Jalan Grafika No.2, Yogyakarta, 55281, Indonesia E-mail: [email protected]
*Civil and Enveronmental Engineering, Faculty Of Engineering, Universitas Gadjah Mada, Jalan Grafika No.2, Yogyakarta, 55281, Indonesia
E-mail: [email protected]
#Civil and Enveronmental Engineering, Faculty Of Engineering, Universitas Gadjah Mada,
Jalan Grafika No.2, Yogyakarta, 55281, Indonesia E-mail: [email protected]
*Civil and Enveronmental Engineering, Faculty Of Engineering, Universitas Gadjah Mada, Jalan Grafika No.2, Yogyakarta, 55281, Indonesia
E-mail: [email protected]
Abstract—The eruption of Mount Merapi in Yogyakarta, Indonesia in 2010 caused many casualties due to minimum preparedness in facing disaster. Increasing population capacity and evacuating to safe places become very important to minimize casualties. Regional government through the Regional Disaster Management Agency has divided disaster prone areas into three parts, namely ring 1 at a distance of 10 km, ring 2 at a distance of 15 km and ring 3 at a distance of 20 km from the center of Mount Merapi. The success of the evacuation is fully supported by road network infrastructure as a way to rescue in an emergency. This research attempts to model evacuation process based on the rise of refugees in ring 1, expanded to ring 2 and finally expanded to ring 3. The model was developed using SATURN (Simulation and Assignment of Traffic to Urban Road Networks) program version 11.3. 12W, involving 140 centroid, 449 buffer nodes, and 851 links across Yogyakarta Special Region, which was aimed at making a preliminary identification of road networks considered vulnerable to disaster. An assumption made to identify vulnerability was the improvement of road network performance in the form of flow and travel times on the coverage of ring 1, ring 2, ring 3, Sleman outside the ring, Yogyakarta City, Bantul, Kulon Progo and Gunung Kidul. The research results indicated that the performance increase in the road networks existing in the area of ring 2, ring 3 and Sleman outside the ring. The road network in ring 1 started to increase when the evacuation was expanded to ring 2 and ring 3. Meanwhile, the performance of road networks in Yogyakarta City, Bantul, Kulon Progo and Gunung Kidul during the evacuation period simultaneously decreased in when the evacuation areas were expanded. The results of preliminary identification of the vulnerability have determined that the road networks existing in ring 1, ring 2, ring 3 and Sleman outside the ring were considered vulnerable to the evacuation of Mount Merapi eruption. Therefore, it is necessary to pay a great deal of attention in order to face the disasters that potentially occur at anytime.
Keywords— Model, Evacuation, SATURN, vulnerability.
I. INTRODUCTION
Soil fertility and natural wealth on the slope of Mount Merapi (Indonesia) are among of the reasons why people liv-ing in this risky area are reluctant to move although a potential threat of disaster is present at any time. It can be said that peo-ple living in this area are greatly exposed to social vulnera-bility and danger of disaster [1][2]. Mount Merapi is one of the world's most active volcanoes and has exploded more than 80 times and the last eruption in 2010 claimed more than 400 lives [3]. Increased population capacity and evacuation to safe places are crucial to save them from the danger of disaster [4][5]. An optimum evacuation plan by involving road net-work of evacuation routes and safe shelters are absolutely re-quired to ensure the safety of refugees [6][7].
Evacuation is a process in which people move from a dan-gerous place to a safer place to reduce health problems and the lives of vulnerably affected people. It is also an effort to completely reduce the number of victims, so that it requires various coordinated aspects in determining the policy. Transport modeling for evacuation has been developed in sev-eral studies to obtain optimum evacuation movement results, which can provide an alternative solution to disaster prob-lems, especially in minimizing casualties, such as design of evacuation routes to relieve congestion during evacuation [8][9].
the expansion of the affected area of Mount Merapi which in-creased the number of refugees, as an attempt to identify ini-tial vulnerability of surrounding road networks.
II. METHOD
Demand model and supply model are transport modeling methods that can be used in evacuation model-ing. When the disaster takes place, the number of users of the road networks increases significantly be-cause there are self-rescuing ef-forts. Large number of travelers and possibility of damage to several roads due to disaster make road networks very vulner-able. Evacuation modeling using user equilibrium (UE) can analyze flow and travel times of road network due to emer-gency conditions has resulted in a conclusion that the meas-urement of evacuation performance is highly dependent on the structure of road network and the number of vehicles in the emergency planning zone [12][13]. Several evacuation models have been used to identify critical networks, by taking congestion or ratio between flow and capacity of the road into consideration [14].
Rise of travel is a central aspect of transport modeling pro-cess. Travel is once movement made by a per-son by using one or more modes and each travel has one origin and one destination [20]. The final stage of transport studies is to make a regression technique more widely. Several travels of trip ends (dependent variable) were observed in each zone and each zone had measurable characteristics in which the rise of travel might be correlated. A regression analysis to analyze changes in road network performance burdened by evacuation process including flow and travel times as dependent varia-bles and the number of refugees in affected area as independ-ent variable is expressed in equation 1.
𝑌 = 𝑏0+ 𝑏1 𝑥 𝑋1+ 𝑏2 𝑥 𝑋2+ ⋯ + 𝑏𝑛 𝑥 𝑋𝑛 (1)
where,
𝑏0 = constant (result of regression analysis)
𝑋1, 𝑋2 = independent variable
Travel distribution is a central aspect of transport model-ing process. Although travel, distribution and loadmodel-ing are of-ten discussed separately, human behavior makes the three phases correlated to each other. In regard to travel distribu-tion, it is important to know two things about the end of the travel, namely con-nected together, without determining ac-tual route and sometimes without reference to travel mode, with a travel matrix between origin and destination known. The Furness method generates flow from the first equilibrium zone and pull into a balanced zone, as expressed in equation 2.
The utilization of existing road network as an evacuation traffic facility can be very difficult when such road network is considered not to have adequate readiness to deal with emergency. In practice, the concept of road network perfor-mance-based evacuation transport model has several ad-vantages, such as its ability to analyze traffic performance for evacuation process on a large scale, and several results of sim-ulation in the form of evacuation time and solid path identifi-cation can produce a measurement of network vulnerability. Impacts of changes in natural conditions and of human hands, increased intensity of disasters in recent years has become an interesting research object as a study material, especially con-cerning road vulnerability networks due to disasters. Changes in road network performance due to an event can be identified as network vulnerability and toughness and can be expressed by index [15][16][17]. A methodology of analyzing of road network vulnerabilities is developed based on consideration of socio-economic impact of network degradation and search for determining the most important location as a result of net-work failure [18]. The vulnerability of road transport system is considered not from a security standpoint, but rather as an issue of reduced accessibility for various reasons. It emphasizes on system function and not physical network, although some of the reasons causing road network discontinuity are caused by physical damage [19]. Therefore, increased network performance can be identified as network vulnerability as a results of an event or disaster..
Figure 1. Input network model
Figure 1 shows road networks and rise zone and pull of travel. Evacuation zone and some regency road network were placed in Sleman Regency, the closest area from the peak of Mount Merapi, as alternative evacuation routes for refugees. Furthermore, each ring was limited to make simulation pro-cess and analysis of results easier.
After the design of the road network model was com-pleted, the next step was process to input network and travel matrices into SATURN. The input of road network consisted of number of nodes connecting links, free flow speed, speed during capacity, capacity of road link, number of directions and length of link. Meanwhile, the input of travel distribution consisted of daily OD matrices and evacuation travel, i.e. evacuation route of refugees in ring 1 which was obtained from the daily OD matrix modification added by the number of refugees to be evacuated with a variation of 50%, 60%, 70%, 80%, 90% and 100%. Similarly, the expansion of evac-uation to ring 2 was a combination of variation of refugees in ring 1 add by 80%, 90%, and 100% with 50%, 60%, 70%, 80%, 90% and 100% of the population in ring 2. Furthermore, the expansion of evacuation to ring 3 was a combination of variation of evacuation travel in ring 1 add by 90% and 100% and ring 2 added by 80%, 90% and 100% with 50%, 60%, 70%, 80%, 90% and 100% of the population moving to ring 3.
Before the simulation on the disaster condition, daily travel modeling was firstly made as the basic model for the next process. The basic model should have a similarity with the real condition as evidenced by statistical testing with cer-tain value limits. The following is the inputs of the road net-work model in SATURN as shown in Figure 2.
Figure 2. Road network model in SATURN
Figure 2 shows the road network models to be loaded un-der several conditions for analyzing perfor-mance. The road network performance observed in the analysis was total vol-ume and travel times on the road network included in ring 1, ring 2, ring 3, Sleman outside the ring, Yogyakarta City, Ban-tul, Kulon Progo and Gunung Kidul.
III.RESULTS AND DISCUSSION
Before the simulation process, the model was firstly vali-dated by comparing the results of daily travel model to traffic counting in the field. The results of model validation in 60 national and provincial roads are shown in Figure 3.
Figure 3. Road network model in SATURN
The result of validation show that R Square was 0.761, mean-ing the similarity of the model was 76% with actual condition. Some models could have similarity close to 100%, but it was difficult to obtain for mac-roscopic models. After the valida-tion process was accepted, the next process was performing a predefined scenario simulation. The results of the evacua-tion scenario of evacuating refuges in ring 1, which consisted of 6 variations of the model, obtained regression equations to
y = 0.5771x + 713.71 R² = 0.761
0 1,000 2,000 3,000 4,000 5,000 6,000 7,000 8,000
0 3,000 6,000 9,000 12,000
Re
sal
ts
o
f M
o
d
el
(p
cu
/h
o
u
r)
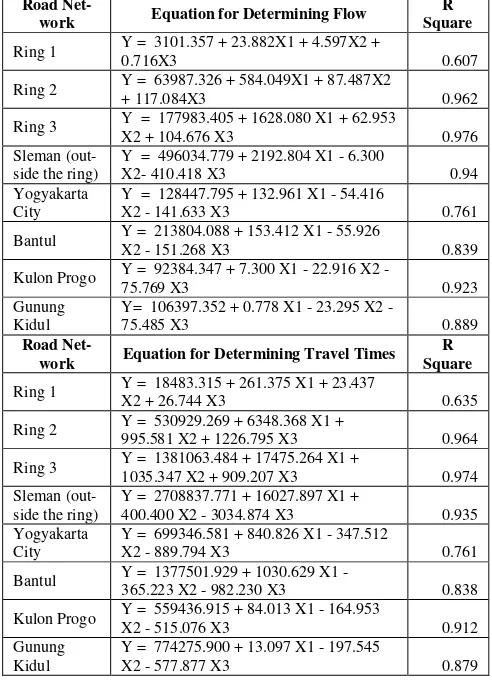
determine flow and travel times in the observed areas as shown in Table 1.
TABLE 1.
EQUATIONS TO DETERMINE FLOW AND TRAVEL TIMES DUE TO REFUGEES IN RING 1
Road
Net-work Equation for Determining Flow
R
work Equation for Determining Travel Times R
When the evacuation scenario of the refugees was expanded to ring 2 consisting of 18 variations of simu-lation model, the regression equations were obtained as shown in Table 2.
TABLE 2.
EQUATION TO DETERMINE FLOW AND TRAVEL TIME DUE TO REFUGEES EXPANDED UNTIL RING 2
Road
Net-work Equation for Determining Flow
R
work Equation for Determining Travel Times R
Similarly, when the evacuation scenario of refugees was ex-tended to ring 3 consisting of 36 variations of the simulation model, the regression equations were obtained as shown in Table 3.
TABLE 3.
EQUATION TO DETERMINE FLOW AND TRAVEL TIME DUE TO REFUGEES EXPANDED UNTIL RING 3
Road
Net-work Equation for Determining Flow
R
work Equation for Determining Travel Times R time of the road network in the observed are-as based on the percentage of population moving in each disaster prone area of ring 1, ring 2 and ring 3..
Figure 4. Total flow in the observation areas
Figures 4 and 5 show the changes in road network perfor-mance due to the evacuation process compared with road net-work performance on daily travel. Accordingly, it can be seen that the total flow and travel times of each road network ob-served in all scenarios produced changes in values. The values increased in some observation areas, but decreased in other areas.
The results of flow calculation analysis show that the val-ues increased in the road networks in ring 2, ring 3 and Sleman outside the ring. The values of flow in the road net-work of ring 2 consisting of daily travel scenario, evacuation scenario of refugee in ring 1, evacuation scenario of refugees until ring 2 and refugee evacuation scenario until ring 3 were 64,184; 73,319; 86,829; 135,752 pcu/hour respectively. The values of flow in the road network of ring 3 were 179,913; 198,760; 205,358; 341,393 pcu/hour respec-tively. Mean-while, the values of flow in the road network of Sleman out-side the ring were 504,959; 517,416; 515,374; 657,659 pcu/ hour respectively.
The results of the analysis of travel time calculation show that there were changes in the form of in-creased values of travel time due to the evacuation scenario of the refugees compared with the daily travel scenario in the road network of ring 2, ring 3 and Sleman outside the ring. The values of travel times in the road network of ring 2 consisting of daily travel scenario, evacuation scenario of refugees in ring 1, evac-uation scenario of refugees until ring 2, and evacuation scenario of refugees until ring 3 were 533,607; 625,527; 769,521; 1,310,867 seconds respectively. The increased val-ues of travel time in the road network of ring 3 were 1,403,447; 1,610,859; 1,700,468; 3,148,267 seconds respec-tively. Meanwhile, the increased values of total travel time in the road network of Sleman outside the ring were 2,774,307; 2,865,594; 2,832,662; 3,927,639 seconds respectively.
Other obtained results show that there were changes in flow and travel times of the road network in ring 1 due to the influ-ence of daily travel scenario, evacuation scenario of refugees in ring 1, evacuation sce-nario of refugees in ring 2 and evac-uation scenario of refugees until ring 3, namely 3,236 ; 2,912; 3,996; 5,758 pcu/hour and 19,832; 16,335; 30,692; 46.835 seconds respectively. These results indicate that the values of flow and travel times of the road network increase when the evacuation scenario of refugees was expanded until ring 2 and ring 3. This indicates that there was a phenomenon of inter-ference in the road network.
Furthermore, flow and travel times decreased from daily travel to evacuation travel as the evacuation status was ex-panded to ring 3, i.e. the road network existing in Yogyakarta City, Bantul, Kulon Progo and Gunung Kidul. The implemen-tation of the evacuation scenario from ring 1, expanded to sce-nario ring 2 and until the scesce-nario ring 3 made the values of flow and travel times continuing to decrease, indicating that some travels in these areas were delayed due to the disaster of Mount Merapi.
Therefore, the road networks were initially identified to ex-perience vulnerability due to the increased val-ues of flow and travel time as shown in Figure 6.
Figure 6. Road networks identified to be vulnerable
Figure 6 shows that in the implementation of scenario of ref-uges in ring 2 and ring 3, road networks exist-ing in ring 1, ring 2, ring 3 and Sleman outside the ring were identified to be vulnerable. Meanwhile, due to the evacuation scenario of ring 1, the road networks identified to be vulnerable were only in ring 2, ring 3 and Sleman outside the ring. However, the road networks existing in ring 1 could be concluded to vul-nerable because it had been identified in the scenario of ring 2 and ring 3.
IV.CONCLUSIONS
Based on the results of the discussion, it can be concluded that:
1. The expansion of refugee evacuation status from ring 1, ring 2 and until ring 3 increased the flow and travel times in the road networks include in ring 2, ring 3, and Sleman outside the ring.
2. The road network in ring 1 started to increase when the evacuation was expanded to ring 2 and ring 3.
3. The performance of road networks existing in Yogya-karta City, Bantul, Kulon Progo and Gunung Kidul sim-ultaneously decreased when the evacuation zone was ex-panded.
4. The preliminary identification of vulnerability had deter-mined that the road networks existing in ring 1, ring 2, ring 3 and Sleman outside the ring were considered vul-nerable to the evacuation of Mount Merapi eruption. 5. The results of the analysis have proved that not all road
networks in the Province of Yogyakarta Special Region are vulnerable to the disaster of Mount Merapi eruption.
ACKNOWLEDGMENT
REFERENCES
[1] S. J. Ki, “Social vulnerability at a local level around the Merapi
volcano,”Int. J. Disaster Risk Reduct., vol. 20, no. October, pp. 63–77, 2016.
[2] M. B. Rahman, I. Susana, and S. Purwo, “Community resilience : learning from Mt Merapi eruption 2010,”Procedia - Soc. Behav. Sci., vol. 227, no. November 2015, pp. 387–394, 2016.
[3] P. Jousset, J. Pallister, M. Boichu, M. F. Buongiorno, A. Budisantoso, F. Costa, S. Andreastuti, F. Prata, D. Schneider, L. Clarisse, H. Humaida, S. Sumarti, C. Bignami, J. Griswold, S. Carn, C. Oppenheimer, and F. Lavigne, “The 2010 explosive eruption of Java â€TM s Merapi volcano — A ‘ 100-year ’event,”
J. Volcanol. Geotherm. Res., vol. 241–242, pp. 121–135, 2012. [4] E. Tyas, W. Mei, A. Fajarwati, S. Hasanati, and I. Meilyana,
“Resettlement following the 2010 Merapi Volcano eruption,”
Procedia - Soc. Behav. Sci., vol. 227, no. November 2015, pp. 361– 369, 2016.
[5] T. Hayashi, “Disaster Prevention Education in Merapi Volcano Area Primary Schools : Focusing on Students ’ P erception and Teachers ’Performance,”Procedia Environ. Sci., vol. 20, pp. 668– 677, 2014.
[6] J. Wang, L. Zhang, Q. Shi, P. Yang, and X. Hu, “Modeling and simulating for congestion pedestrian evacuation with panic,”Phys. A Stat. Mech. its Appl., vol. 428, pp. 396–409, 2015.
[7] Y.-C. C. Y.-C. Chiu, “Traffic scheduling simulation and assignment for area-wide evacuation,”Proceedings. 7th Int. IEEE Conf. Intell. Transp. Syst. (IEEE Cat. No.04TH8749), pp. 537–542, 2004.
[8] A. Stepanov and J. M. Smith, “Multi-objective evacuation routing in transportation networks,”Eur. J. Oper. Res., vol. 198, no. 2, pp. 435–446, 2009.
[9] Z. Zhang, S. a. Parr, H. Jiang, and B. Wolshon, “Optimization model for regional evacuation transportation system using macroscopic productivity function,” Transp. Res. Part B Methodol., 2015.
[10] P. S. Hardiansyah, Suparma BS, Muthohar I, “Perencanaan Transportasi untuk Evakuasi Fokus pada Pengungsi Model dengan Pendekatan Multiobjektif,”J. Transp., vol. 16, no. 3, pp. 231–240, 2016.
[11] H. Fu, A. J. Pel, and S. P. Hoogendoorn, “Optimal traffic management to ensure emergency evacuation compliance,”2013 10th IEEE Int. Conf. NETWORKING, Sens. Control, pp. 532–537, 2013.
[12] a. G. Hobeika and C. Kim, “Comparison of traffic assignments in evacuation modeling,”IEEE Trans. Eng. Manag., vol. 45, no. 2, pp. 192–198, 1998.
[13] V. L. Knoop, M. Snelder, H. J. Van Zuylen, and S. P. Hoogendoorn, “Link-level vulnerability indicators for real-world
networks,”Transp. Res. Part A, vol. 46, no. 5, pp. 843–854, 2012. [14] E. Leal, D. Oliveira, and W. Porto, “Determining critical links in a road network : vulnerability and congestion indicators,”Procedia - Soc. Behav. Sci., vol. 162, no. Panam, pp. 158–167, 2014. [15] C. Balijepalli and O. Oppong, “Measuring vulnerability of road
network considering the extent of serviceability of critical road links in urban areas,” J. Transp. Geogr., vol. 39, pp. 145–155, 2014.
[16] A. Reggiani, P. Nijkamp, and D. Lanzi, “Transport resilience and
vulnerability : The role of connectivity,”Transp. Res. Part A, vol. 81, pp. 4–15, 2015.
[17] D. M. Scott, D. C. Novak, L. Aultman-Hall, and F. Guo, “Network Robustness Index: A new method for identifying critical links and evaluating the performance of transportation networks,”J. Transp. Geogr., vol. 14, no. 3, pp. 215–227, 2006.
[18] M. a P. Taylor, S. V. C. Sekhar, and G. M. D’Este,“Application of accessibility based methods for vulnerability analysis of strategic road networks,”Networks Spat. Econ., vol. 6, no. 3–4, pp. 267– 291, 2006.
[19] K. Berdica, “An introduction to road vulnerability: What has been done, is done and should be done,”Transp. Policy, vol. 9, no. 2, pp. 117–127, 2002.