Acknowledgements
This report belongs to the public domain. Users are welcome to download, save, or distribute this report electronically or in any other format. A digital copy of this report is available at
www.forestdeclaration.org.
Please use the following citation:
Climate Focus. 2016. Progress on the New York Declaration on Forests: Eliminating Deforestation from the Production of Agricultural Commodities – Goal 2 Assessment Report. Prepared by Climate Focus in cooperation with the NYDF Assessment Coalition with support from the Climate and Land Use Alliance and the Tropical Forest Alliance 2020.
Authors:
Charlotte Streck, Franziska Haupt, and Stephanie Roe (Lead Authors) and Katharina Behm, Alan Kroeger, and Ingrid Schulte, with contributions from Xavier Andrillon, Stephen Donofrio, Jef Hayward, Sarah Lake, Ben McCarthy, Katie McCoy, Rafel Servent, and Francesca Ward.
NYDF Assessment Coalition: CDP
Climate Focus
Environmental Defense Fund (EDF) Forest Trends
Global Alliance for Clean Cookstoves (GACC) Global Canopy Programme (GCP)
International Union for Conservation of Nature (IUCN) Rainforest Alliance
Stockholm Environment Institute (SEI) The Sustainability Consortium (TSC) Woods Hole Research Center (WHRC)
World Resources Institute (WRI), Global Forest Watch World Wildlife Fund (WWF-US)
We gratefully acknowledge the many individuals who ofered their time and expertise, in many diferent ways, to the development and improvement of this work:
Charles McNeill and Dearbhla Keegan (UNDP)
Daniel Zarin, Kevin Currey, and Leonardo Fleck (CLUA)
Marco Albani, Anna Kopacz, Patricia Ohnmacht, and Florian Reber (TFA 2020)
Arild Skedsmo and Andreas Tveteraas (Norwegian International Climate and Forest Initiative) Daniela Goehler (The World Bank)
Dewi Bramono and Aida Greenbury (Asia Pulp & Paper)
Katie McCoy, Jillian Gladstone, Lena Meintrup, Rafel Servent and Anjali Fordington (CDP) Chris Meyer (Environmental Defense Fund)
Andrew Kluth (Golden Veroleum Liberia)
Ana Maria Arabia Zuniga and Styven Herrera Villarraga (Grupo Exito) Lucian Peppelenbos (IDH)
Ulrika Hvistendahl (IKEA)
Sarah Price (Programme for the Endorsement of Forest Certiication) Jefrey Hayward and Mark Moroge (Rainforest Alliance)
Toby Gardner and Javier Godar (SEI)
Christy Slay, Christopher Cooke, Philip Curtis, and John Kester III (TSC)
Nancy Harris and Caroline Winchester (World Resources Institute and Global Forest Watch) Joseina Braña-Varela and Lloyd Gamble (WWF-US)
Private Sector Advisory Group: Mark Murphy (Cargill)
Rachael Sherman (McDonald’s)
Mike Barry and Fiona Wheatley (Marks & Spencer)
Further acknowledgements:
Ellen Wilson and Susan Tonassi (Burness)
This project was funded by the Climate and Land Use Alliance and the Tropical Forest Alliance 2020.
Design:
Circle Digital - www.circle.co.ke (report and website) Imaginary Oice - www.imaginaryoice.com (infographics)
Contents
Forewords
5
Executive
Summary
7
I.
Introduction
11
II. Commercial Agriculture as a Driver of Deforestation
13
III. Tracking Progress on Goal 2: Methodology
17
IV. Tracking Progress on Goal 2: Findings
19
V.
Concluding
Remarks 46
VI.
Bibliography
48
Forewords
Last year we as a global community were presented with a stark choice. Do we accept the inevitable outcomes of our “business-as-usual” trajectory, or do we take the road less traveled by coming together to create a new normal - A new normal where governments, civil society, the private sector and small farmers, link arms to tackle the challenges before us and aspire to achieve the global goals that relect our values?
We could not have answered this question more emphatically. Last year saw the adoption of both the Sustainable Development Goals (SDGs) and the Paris Agreement, which together draw a roadmap towards a sustainable and climate friendly future. The coalition that supported the New York Declaration on Forests (NYDF) should feel even more galvanized as a result. These new global frameworks create additional momentum for forest conservation and sustainable development.
We have long known that forest landscapes play a crucial role in combatting climate change and supporting livelihoods. It is estimated that over a quarter of the world’s population rely on forests for their livelihoods, and a majority of them use trees directly on their farms. A focus of this year’s report is on the forested and mosaic landscapes that the private sector operates within and sources from, and which are pivotal for forging partnerships and implementing integrated
approaches that can advance a large portion of the global community’s goals for 2030. Most people are not aware how impactful these interconnected forest landscapes can be in changing lives, reducing emissions, and safeguarding forests. And while companies clearly have a signiicant role to play, the NYDF, SDGs, and Paris Agreement goals require multi-stakeholder cooperation if we are to see progress continue.
We have already seen net deforestation declining from a high in 2005 to 6.65 million hectares in 2015, and since the Paris Agreement was agreed, the number of restoration commitments under the Bonn Challenge has doubled to more than 124 million hectares. This progress is encouraging, but we have to and will do better. The adoption of the SDGs followed by the Paris Agreement signals a pivot from negotiation to action on land-use, providing an unequivocal signal to the private sector and other stakeholders that healthy forests are central to the future of our planet.
UNDP applauds the multi-stakeholder efort that supports the progress assessment on the NYDF, and which focused this year on evaluating progress made towards eliminating deforestation from supply chains in agricultural production. The focus report, “Progress on the New York Declaration on Forests: Eliminating Deforestation from the Production of Agricultural
Commodities – Goal 2 Assessment Report” is a unique and comprehensive efort to bring all data sources together in an honest assessment of private sector pledges and commitments. The second report, “Progress on the New York Declaration on Forests – Achieving Collective Forest Goals - Updates on Goals 1-10” complements the in-depth report on Goal 2, with an annual update on all NYDF Goals.
We continue to look ahead now that the impetus for action is so clear. And we acknowledge that the NYDF is a collection of promises, and that this year we as a global community made great strides towards keeping them.
Nik Sekhran
Two years after the New York Declaration on Forests (NYDF), and four years after the creation of the Tropical Forest Alliance 2020 (TFA 2020) at the Rio+20 meeting, this report provides an important opportunity to relect on the road travelled and the one that lies ahead. The focus of this year’s report is Goal 2 of the NYDF, which is to support private sector commitments to eliminate deforestation from the production of agricultural commodities such as palm oil, soy, paper, and beef products by no later than 2020. The Tropical Forest Alliance 2020 was established in 2012 with those commitments at the centre of its raison d’être – to create a public-private partnership in which its partners take voluntary actions to reduce tropical deforestation associated with forest-risk commodities. As such this report, which we were proud to support, is also a “check up” of how we are doing as an industry and as an alliance.
The verdict calls for hope, but also for a strong recommitment of efort. On the one hand we have made clear progress from those early days - in some cases a lot of progress – and a true movement for market transformation is on the way. The number of companies making commitments to deforestation-free supply chains continues to grow, and many are now well into implementation, especially where certiication standards and integrated supply chains provide clear options for sustainable choices. Partners of TFA 2020 and the endorsers of the NYDF are leading the way in the implementation of commitments made across all supply chains. On the other hand, headwinds are strong, and with just around four years to the end of 2020, there is still a lot to be done. More companies need to commit, and many more need to move much faster to operationalise those commitments. To do this, private sector companies
need greater support from governments, civil society, and the inancial sector. From forest governance to inancial policies and regulation, from smallholder inclusion programs to public procurement pledges, there are encouraging early signs, but overall we need a substantial step change in pace to meet the goal.
To accelerate the pace of change we need to build upon the positive political momentum encapsulated in the Sustainable Development Goals (SDGs) and the Paris Agreement. Companies should feel comfortable making bold commitments in the knowledge that the global community is behind them. Governments and civil society should see that now more than ever there is a need to collaborate with businesses and be part of the transition to deforestation-free commodities. Now more than ever there is a need for dedicated public-private collaborations, like TFA 2020, to help achieve these deforestation-related commitments.
As more companies develop and implement commitments, they can look to TFA 2020 to make critical connections to accelerate implementation through collaboration, be it through integrated land-use planning, working with smallholders, and monitoring and measuring progress. Governments and civil society organisations can use our platform to foster alignment between public policy and “action on forests” for the successful achievement of interrelated SDGs that are critical to the successful transformation of national and local economies. We are hopeful that through collaboration we can accelerate the ongoing transition from commitment to action, and that we will be able to both foster the production of deforestation-free commodities and also cultivate a new era of partnership for sustainable development.
Marco Albani
Executive Summary
In September 2014, the New York Declaration on Forests (NYDF) outlined 10 goals that provide en-dorsers—including countries, subnational governments, companies, indigenous groups, and NGOs— with ambitious global targets to protect forests and end natural forest loss by 2030. In 2015, the irst
edition of the NYDF Progress Assessment proposed a framework and respective indicators for mea-suring progress toward all 10 goals and ofered an initial assessment on the status of progress toward achieving them. The assessment is supported by a broad coalition of civil society and research orga-nizations that annually publishes progress updates. In addition to summarizing new data and indings around the established indicators, the Progress Assessment also provides an in-depth analysis of a selected goal.
This year’s focus report is dedicated to Goal 2 on eliminating deforestation from agricultural commod-ity supply chains. The NYDF Assessment Coalition has developed a new framework that allows a com-prehensive evaluation of supply-chain eforts taken by private and public actors, drawing on existing work and data from all partner organizations and illing in data gaps through company interviews.
For the irst time, this report aggregates, cross-references, and interprets data from a variety of dis -parate sources to provide a coherent picture of the “state of play” of eforts to ensure that agrocom -modity supply chains are free of deforestation. The full picture of engagement from pledge to impact is slowly emerging, showing that the global supply-chain movement continues to gain momentum with a continued increase in pledges and progress on implementation. The overall impact on forests is, how-ever, currently impossible to assess, as there are no comprehensive global data sets that link eforts to clean up agricultural commodity supply chains to an actual reduction in deforestation. Any analytical efort is also burdened by scattered data and multiple and overlapping deinitions.
Cross-sectoral cooperation enables risks, responsibilities, resources, competencies, and beneits to be shared. The NYDF can provide a platform for the exchange of information and best practices, leading
to a cooperative implementation of strategies for sustainable land use that address deforestation at the national level.
KEY MESSAGES: 2016 ASSESSMENT OF GOAL 2
Agriculture is the biggest driver of global forest loss, and signiicant deforestation can be linked to speciic commodities and geographic regions. This report focuses on the assessment of progress related to the four key commodities driving agricultural deforestation: palm oil, soy, cattle, and wood products. Large shares of production and trade of these commodities can be traced to a handful of countries—Indonesia, Brazil, Malaysia, and Paraguay in particular—where the majority of tropical deforestation is concentrated. Targeted action in these countries is particularly important to reduce agro-commodity-driven deforestation.
CRITERION 1: Commitment to deforestation-free commodities
• The number of corporate commitments to reduce the deforestation of agricultural commodity supply chains continues to grow. Since last year’s report, 108 companies have announced 212 new commitments, an in-crease of 43% over the previous year. Supply-Change.org reports that, in total, more than 400 companies have made more than 700 pledges to reduce their impacts on forests and the rights of forest communities.
• The variety of deforestation-related commitments makes direct comparisons diicult. Commitments range from signing on to high-level pledges, such as those formulated in the NYDF, to individual targets on the
pro-duction or sourcing of speciic commodities. Very few companies commit to zero (gross) deforestation across
their operations; most choose a step-wise approach that sets priorities and deadlines for individual commodi-ties.
• The majority of the 629 companies assessed by Supply-Change.org that source or produce palm oil (59%) and wood products (53%) have made commodity-speciic commitments. For soy and cattle, the proportion of companies with commitments is considerably lower (21% and 12%, respectively). This is a matter of concern, considering that cattle have a deforestation footprint that is nine-times larger than the one associated with
palm oil. The numbers correlate with the availability and use of certiication as a tool to implement sup
-ply-chain pledges. Overall, more than 20% of global palm oil and 11% of timber is certiied.
• Most of the companies that have announced commitments are manufacturers and retailers, nearly 90% of which are headquartered in Europe, North America, or Australia. Companies operating upstream in the supply chain (producers, processers, and traders) and those headquartered in Latin America, Africa, and Asia have been slower to act. This may be starting to change, however. More producer companies, particularly those involved in palm oil in Southeast Asia, are announcing their own pledges. These commitments are particularly important since large producers control a vast portion of the market share and have outsized impacts on land use and conversion. Meat processing companies headquartered in Brazil have also achieved progress in elimi-nating deforestation from their operations.
• Over 90% of the assessed companies source or produce in deforestation hotspots (Brazil, Indonesia, Malay-sia, and Paraguay). Risk mitigation seems to be a major driver for companies to address deforestation in their supply chains.
CRITERION 2: Implementation of private-sector forest commitments
• The growing number of commitments to reduce impacts on people and forests represents important progress, but more focus is needed on action. Implementation requires translating announcements into practice, and
an important irst step is adopting commodity-speciic, concrete policies and systems, like production stan
-dards, procurement rules, operational plans, and key performance metrics. Signiicant advancement has been
reported on deforestation-related risk assessments, a dialogue with suppliers, and the revision of procurement
rules. Once these policies are in place, monitoring progress and compliance is the next step for ensuring defor -estation impacts are avoided. More work is needed on this step. Strategies on how a company can eliminate
deforestation from its supply chains are diicult to compare, as they depend on the targeted commodity,
geography, work with suppliers, and the position of a company in the supply chain.
• There has been a signiicant efort to implement supply-chain commitments, yet less than half of the as -sessed companies have time-bound actionable plans (Forest 500), robust monitoring systems are still rare, and only 45% of companies are reporting on compliance to deforestation policies (Supply-Change.org). Trac-ing commodities to the producer level remains challengTrac-ing for many companies, and very few can report on the impact of their pledges on deforestation. In particular, soy and palm oil face barriers to traceability to the
• The majority of companies opt to limit procurement to certiied products rather than deining company product standards. Supply-chain eforts are generally more advanced in commodities with widely recognized
certiication standards and integrated supply chains, which provide easy and accessible options toward sustainability. In line with our indings on commitments, progress toward increasing certiied production and
sourcing has been good for wood products and palm oil, but less so for soy and beef.
• NYDF endorsers and TFA 2020 member companies are more advanced—across all supply chains—in terms of adopting commitments and translating them into actions. Companies that are engaged in these initiatives
show signiicant progress in adopting policies and systems to implement their commitments.
• Companies producing or sourcing from deforestation hotspots are more advanced in operationalizing their commitments (approximately 10–20% higher) than those with less exposure to these regions. This is
encour-aging, given their ability to directly and signiicantly afect deforestation.
CRITERION 3: Support by non-supply chain actors
• Meeting the targets of the NYDF, including Goal 2, will require collective action. Unfortunately, limited
im-provements have been made to forest governance and public-sector support in recent years, though speciic
success stories may provide a model for future collaboration and partnerships.
• Despite increasing civil society pressure, Forest 500 reports that only one-third of 150 assessed inancial insti -tutions have deforestation-related commitments in place. The United Nations Environment Programme inds only a small percentage of institutions that monitor compliance with such commitments, and even fewer that
ofer inancial instruments to support the implementation of sustainability measures in supply chains.
• Weak forest governance presents a major barrier to private-sector eforts. Countries have taken measures to reduce deforestation, and REDD+ has increased the political will to improve forest governance.
Compa-nies have, however, experienced little concrete improvement in forest governance and limited public-sector support. Nevertheless, the companies highlighted speciic incidents of improved collaboration and listed an
increasing number of successful public-private initiatives.
• A growing number of public-private initiatives support the elimination of deforestation at the supply chain or landscape level. Large-scale public programs backed by private-sector announcements for preferential sourc-ing from such program areas provide a chance for “produce-and-protect” partnerships. Sectoral agreements and moratoria as piloted in the Brazilian Amazon have also had a major impact on deforestation.
CRITERION 4: Overall impact on deforestation
• Finally, there are currently no available data that provide global coverage to determine whether cumulative company eforts are translating into measurable reductions in deforestation, though two tools are being
Manufacturers and retailers Producers, processors and traders 64 70 56 88 74 64 66 78
Farm Plantation Forest
Risk assessment Production standard Procurement standard 87 87 84 87
Percent adoption (%)
Percent adoption (%) 76 80 64 87 57 57 56 70 Timber 49% 25% Pulp/ Paper
20% 16% 13%
48% 14% 7% 2% 2% 23%
Companies
Commitments Palm oil Timber/Pulp Soy Cattle
59% 53% 21% 12%
General
Average compliance reported Companies disclosing information
By supply chain level By deforestation hotspot By commodity 14 Prod ucer s Trad ers Reta ilers Ma nufa ctur ers Proc esso rs 47 76 43 79 41 67 45 70 43 70 Braz il Ma lays ia Para guay Indo nesi a 46 75 47 68 46 70 49 68 Palm oil Soy Cat tle Tim ber/ Pulp 50 46 81 35 75 50 82 60 59
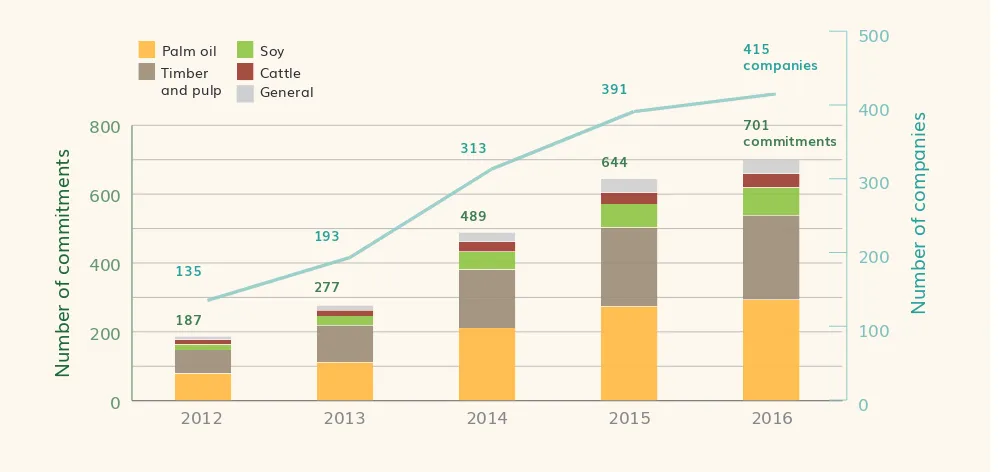
Private-sector commitments are continually increasing, now up to 415 companies and 701 commitments. The majority address palm oil and wood products, while few address soy and cattle.
415 701
I. Commitments to deforestation-free commodities
S u p p ly-c ha n g e .o rg , 2 0 16 C D P , 2 0 15 F o re st 5 00 , 2 0 16 C D P , 2 0 15 C D P , 2 01 5 u p p ly-c ha n g e .o rg , 2 0 1 6
II. Implementation of private-sector forest commitments
Most companies have adopted policies or strategies to operationalize commitments.
Yet, less than half of the companies have time-bound actionable plans.
Approximately 70% of companies have traceability systems.
Yet, very few can trace back to the production level.
Only about 45% of companies disclose information on their compliance to deforestation policies. Of those that disclose information, progress on compliance is fairly high.
i. Policies
ii. Monitoring
iii. Compliance
I. Introduction
Two years after its adoption in 2014, a total of 190 governments, private-sector entities, and civil society organizations have endorsed the New York Declaration on Forests (NYDF). (1) The declaration includes ambitious targets to end natural forest loss by 2030, with a 50% reduction by 2020 as a mile-stone toward its achievement. It also calls for restoring 350 million hectares of degraded and deforest-ed lands by 2030, supporting the private sector in eliminating deforestation from the supply chains of major agricultural commodities by 2020, and providing inancial support to reduce emissions related to deforestation and forest degradation.(2)
The endorsers of the NYDF have committed individually and jointly to doing their part to achieve the 10 goals laid out in the NYDF (Table 1). Progress requires committed and continued action from NYDF endorsers; efective monitoring on progress, engagement, and visibility of results is important to boost this resolve. The NYDF Assessment Coalition is an independent network of civil society groups and re-search institutions that annually evaluates the progress toward meeting the NYDF goals.
The 2016 NYDF Progress Assessment has two parts: a detailed report on Goal 2, which aims to help the private sector halt deforestation associated with agricultural commodities, and a summary report that contains an update on all goals formulated in the context of the NYDF.
Over the last few years, an encouraging number of companies have announced their intent to eliminate deforestation from their supply chains. As of September 2016, more than 415 international companies have pledged to reduce or eliminate deforestation in the production, supply, and procurement of food and household products. (3) Meanwhile, more than 50 tropical forest countries have started to imple-ment measures for the reduction of deforestation and forest degradation (REDD+). Many of these mea-sures receive support from partner governments, resulting in a multitude of bilateral and multilateral REDD+ implementation partnerships. In the wake of the Paris Agreement’s entry into force on Novem-ber 4, 2016, these partnerships are expected to increase in numNovem-ber and deepen in mutual commitment.
Table 1: The 10 NYDF Goals
Goal 1. At least halve the rate of loss of natural forests globally by 2020 and strive
to end natural forest loss by 2030
Goal 2. Support and help meet the private-sector goal of eliminating deforestation
from the production of agricultural commodities such as palm oil, soy, paper, and
beef products by no later than 2020, recognizing that many companies have even
more ambitious targets
Goal 3. Signiicantly reduce deforestation derived from other economic sectors by
2020
Goal 4. Support alternatives to deforestation driven by basic needs (such as
sub-sistence farming and reliance on fuel wood for energy) in ways that alleviate
pov-erty and promote sustainable and equitable development
Goal 5. Restore 150 million hectares of degraded landscapes and forestlands by
2020 and signiicantly increase the rate of global restoration thereafter, which
would restore at least an additional 200 million hectares by 2030
Goal 6. Include ambitious, quantitative forest conservation and restoration targets
for 2030 in the post-2015 global development framework, as part of new
interna-tional sustainable development goals
Goal 7. Agree in 2015 to reduce emissions from deforestation and forest
degrada-tion as part of a post-2020 global climate agreement, in accordance with
interna-tionally agreed rules and consistent with the goal of not exceeding 2°C warming
Goal 8. Provide support for the development and implementation of strategies to
reduce forest emissions
Goal 9. Reward countries and jurisdictions that, by taking action, reduce forest
emissions—particularly through public policies to scale-up payments for veriied
emission reductions and private-sector sourcing of commodities
Goal 10. Strengthen forest governance, transparency, and the rule of law, while
also empowering communities and recognizing the rights of indigenous peoples,
II. Commercial Agriculture as a Driver of
Deforestation
THE BIG FOUR: PALM OIL, SOY, CATTLE, AND WOOD
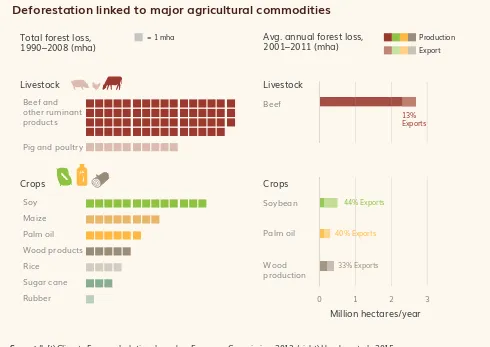
The production of palm oil, soy, cattle, and wood has a massive impact on forests. A recent study esti-mates these commodities accounted for 40% of total deforestation during the period of 2001–11 and conirms that livestock is the single largest driver of deforestation. (4; 5) Figure 1 illustrates the deforesta-tion footprint linked to major agricultural commodities. It also shows that soy and palm oil are the two most exported commodities with embedded deforestation as a share of overall production, whereas beef is largely consumed domestically. Also, as a result of growing international demand, particularly for beef, palm oil and soy (used as food, animal feed and products, and increasingly as biofuels), forest loss from these commodities is likely to increase.(5; 6; 7) To a lesser degree, other commodities—including rubber, sugar, cocoa, and cofee—also pose a risk for forests.
Deforestation linked to major agricultural commodities
Source: (left) Climate Focus calculations based on European Commission, 2013; (right) Henders et al., 2015
Figure 1. Figure illustrates two data sources, one for total forest loss between 1990 and 2008 and another for average annual forest loss in 2001-11. (8; 4)
0 1 2 3
Beef and other ruminant products
Pig and poultry
= 1 mha Production
44% Exports
13% Exports
40% Exports
33% Exports
Export
Beef
Wood production Soybean
Palm oil
Million hectares/year Livestock
Avg. annual forest loss, 2001–2011 (mha) Total forest loss,
1990–2008 (mha)
Maize Soy
Palm oil
Sugar cane
Rubber Wood products
Rice
Crops
Livestock
DEFORESTATION HOTSPOTS
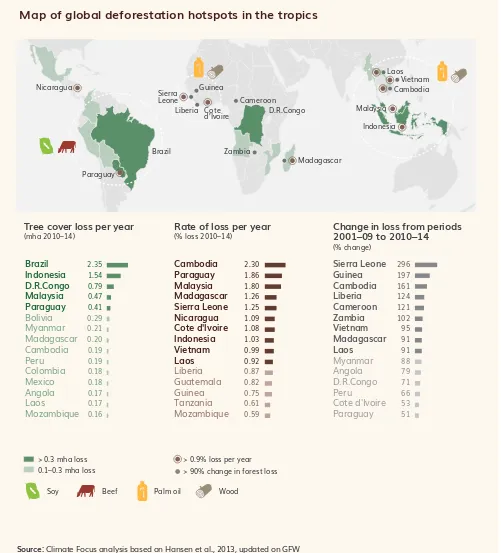
Deforestation linked to commercial agriculture varies strongly by region and is particularly pronounced in certain hotspot areas of the tropics: South America for cattle and soy, Southeast Asia for palm oil and wood products, and West Africa for palm oil, logging, and other crops, including cocoa.(8; 6; 9) In 2000–14, tropical countries lost approximately 123 million hectares of tree cover, an area about the size of France, Germany, and the United Kingdom combined.(10)
Brazil and Indonesia have been in the spotlight for their eforts to reduce deforestation, since they contain a large share of tropical forests and have had historically high rates of deforestation. Brazil has reduced its deforestation rate by 70% since 2005, and Indonesia has had an extended moratori -um on primary forest conversion since 2011.(11; 12) Despite these encouraging developments, curbing deforestation in Brazil and Indonesia remains a priority—these two countries alone are able to reduce annual land use emissions by approximately 10%.i (13; 14) A recent spike in forest ires in Indonesia and the recent increase in deforestation in Brazil also adds reason for continued and urgent action.(15; 16)
Map of global deforestation hotspots in the tropics
Source: Climate Focus analysis based on Hansen et al., 2013, updated on GFW
Figure 2. Deforestation hotspots in the tropics according to the top 15 countries with highest tree cover loss, rates of tree cover and percent change in loss from periods 2001-09 to 2010-14. Data is averaged per year and uses a default crown cover threshold of 30%.(10)
> 0.3 mha loss
0.1–0.3 mha loss > 90% change in forest loss > 0.9% loss per year Brazil Indonesia D.R.Congo Malaysia Paraguay Bolivia Myanmar Madagascar Cambodia Peru Colombia Mexico Angola Laos Mozambique 2.35 1.54 0.79 0.47 0.41 0.29 0.21 0.20 0.19 0.19 0.18 0.18 0.17 0.17 0.16 2.30 1.86 1.80 1.26 1.25 1.09 1.08 1.03 0.99 0.92 0.87 0.82 0.75 0.61 0.59 296 197 161 124 121 102 95 91 91 88 79 71 66 53 51 Cambodia Paraguay Malaysia Madagascar Sierra Leone Nicaragua Cote d'Ivoire Indonesia Vietnam Laos Liberia Guatemala Guinea Tanzania Mozambique Sierra Leone Guinea Cambodia Liberia Cameroon Zambia Vietnam Madagascar Laos Myanmar Angola D.R.Congo Peru Cote d'Ivoire Paraguay
Soy Beef Palm oil Wood
Change in loss from periods 2001–09 to 2010–14
(% change)
Rate of loss per year
(% loss 2010–14)
Tree cover loss per year
A COLLABORATIVE EFFORT TO ADDRESS DEFORESTATION
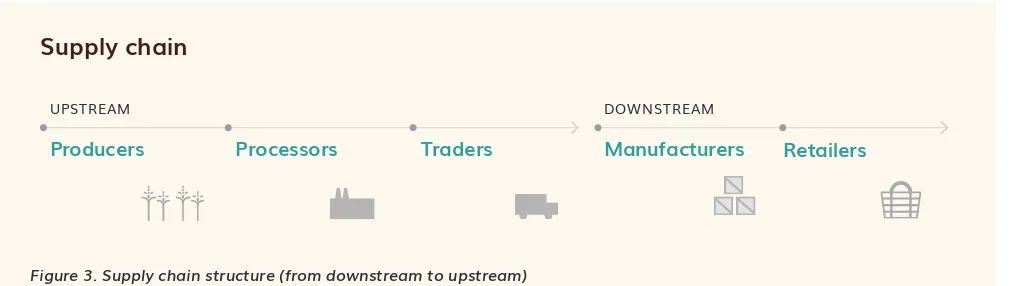
Private companies play a critical role in removing deforestation from agricultural supply chains. From farm to fork, commodities move along a supply chain of producers, processors, traders, manufacturers, and retailers that are united in their interest in a stable, high-quality, legal supply of commodities (Figure 3). Motivated by multiple objectives, supply-chain commitments seek to improve livelihoods, eliminate negative environmental impacts, and improve the sustainability and quality of products. Eliminating deforestation from agricultural production contributes to such environmental and social responsibility goals.
Large of-takers of internationally traded commodities have considerable inluence over suppliers and can facilitate their transition to more sustainable behaviors and in particular toward integrated supply chains that are dominated by a handful of powerful players.(19) We know, however, very little about the direct impact of supply-chain commitments on environmental improvements, since in most cases the data are missing.(3) While pledging the elimination of deforestation from supply chains is an important irst step, it is the implementation and monitoring of such commitments that will result in real change.
Governments are key partners in the implementation of supply-chain commitments. Many tropical countries sufer from weak or absent forest governance, high levels of corruption, unclear land tenure, and unreliable law enforcement (Box 1). Private actors alone cannot overcome these challenges. They depend on action by, or cooperation with, governments.
Box 1: Summary of main implementation barriers
• Weak governance, in particular lack of enforcement of policies • Missing legal and instrumental frameworks
• Diiculties in agreeing on common deinitions and goals for deforestation policies, within companies as well
as in conjunction with suppliers and other stakeholders
• Lack of global traceability systems
• Data gaps (e.g., diiculties related to the attribution of deforestation and impact of speciic activities). • Lack of premiums or other incentives for suppliers to transform their business models to low-deforestation
impact
Source: NYDF endorsers/TFA member interviews
Producers Processors Traders Manufacturers
UPSTREAM DOWNSTREAM
Retailers
Supply chain
Civil society has an important role in building capacities, tracking progress, and disseminating infor-mation. An increasing number of supply-chain initiatives seek to increase transparency around defor-estation-related company commitments to broaden the supply-chain movement, enable consumers to make informed choices, and facilitate cooperation between governments and companies. Annex I summarizes the available information from platforms and transparency initiatives that focus on agri-cultural supply chains. Collectively, these initiatives cover a wide range of geographies, commodities, companies, and approaches for tackling and understanding supply-chain transparency, building trust, and providing a highly complementary set of capabilities and insights.
III. Tracking Progress on Goal 2: Methodology
A new framework to assess progress toward implementing supply-chain commitments guides the 2016 NYDF Progress Assessment, providing a methodology that gives the aspirational Goal 2 of the NYDF a tool for evaluation. The assessment framework draws on existing work from other monitoring and reporting platforms and allows for the tracking and comparability of progress, from initial supply-chain pledges to implementation of deforestation commitments by companies to overall impacts on forests. It was developed collectively by the NYDF Assessment Coalition, based on a bottom-up analysis of the core components of forest monitoring and supply-chain operations, as well as extensive consultations with companies and other experts.
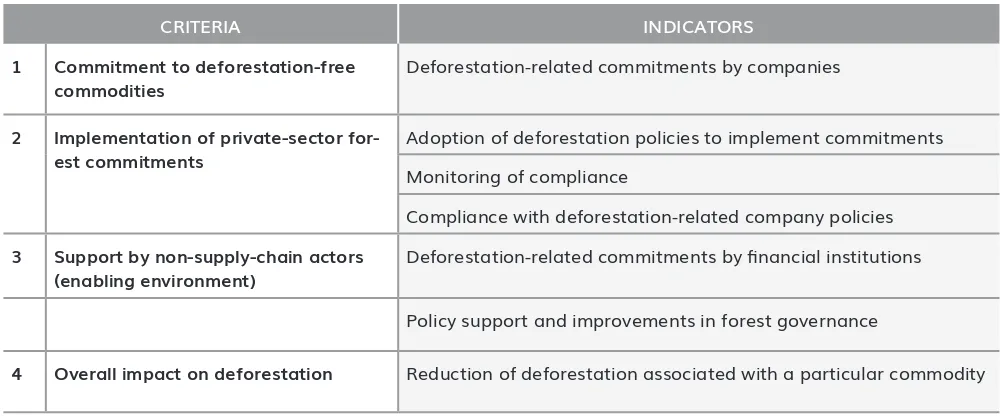
Table 2: Assessment Framework to measure progress toward NYDF Goal 2
CRITERIA INDICATORS
1 Commitment to deforestation-free commodities
Deforestation-related commitments by companies
2 Implementation of private-sector for-est commitments
Adoption of deforestation policies to implement commitments
Monitoring of compliance
Compliance with deforestation-related company policies
3 Support by non-supply-chain actors (enabling environment)
Deforestation-related commitments by inancial institutions
Policy support and improvements in forest governance
4 Overall impact on deforestation Reduction of deforestation associated with a particular commodity
The NYDF Assessment Coalition deined four criteria that are critical components for achieving Goal 2 (Table 2). Companies irst adopt supply-chain commitments (Criterion 1), then implement these com -mitments through company policies, operational plans and monitoring and compliance systems (Criteri-on 2). To increase impact, governments, n(Criteri-on-supply-chain private actors (e.g., inancial instituti(Criteri-ons) and nongovernmental organizations (NGOs) also have to support these private-sector eforts and create an enabling environment that encourages and permits action (Criterion 3). Finally, the overall impact of supply-chain eforts on deforestation determines the eventual success of these eforts (Criterion 4). The irst three criteria are proxies for assessing private-sector progress, by determining what steps the company has taken or the support that companies have received to eliminate deforestation in its com-modity supply chains. The fourth criterion seeks to address whether these eforts actually translate into measurable, reduced deforestation.
This assessment is based on data gathered from four transparency initiatives and complemented with information from interviews. In total, more than 600 corporations were evaluated, based on data from (Forest Trends’ Supply-Change.org, The Global Canopy Programme’s Forest 500 initiative, CDP’s forests program, and The Sustainability Consortium). Supplementary interviews were conducted with NYDF endorsers and Tropical Forest Alliance 2020 (TFA 2020) members (26 companies out of 55ii) to ensure data coverage across endorsers. Potential future data sources for indicators where currently no infor-mation is available have also been identiied (Global Forest Watch–Commodities and Transparency for Sustainable Economies (Trase), which are discussed later in this report). Following data compilation, we analyzed and assessed progress on the implementation of deforestation commitments, focusing on four major commodities: soy, cattle, palm oil, and wood (including pulp, paper, and timber). While we provide a global analysis, we also assessed supply-chain eforts based on their geographic footprint in the four main deforestation hotspot countries: Brazil, Indonesia, Malaysia, and Paraguay. Finally, we developed case studies to illustrate on-the-ground progress, diferent implementation strategies, policy support, the role of non-state actors, and barriers encountered by diferent stakeholders. Details on data sources can be found in Annex II. Box 2 summarizes data gaps and limitations.
Box 2. Data gaps and limitations
Criteria 1, 2, and 3. Data measuring the adoption of commitments are widely available. Although existing data provide
an indication of progress toward implementation, the lack of data providing details on the quality of these actions makes it hard to judge whether action is suicient and adequate to achieve deforestation-related goals. These data gaps and limitations are due to a variety of factors, the main ones being the complicated nature of supply chains, the large number of actors, companies not having resources to collect data or no mandate from management. Coherence of diferent datasets (e.g., consistency of deinitions) would allow for better comparison of indings.
High level of granularity and diferences among supply chains make it diicult to compare interview data. This presents a serious limitation to interviews—and likely beyond—as many details may be misinterpreted in aggregated reporting eforts.
IV. Tracking Progress on Goal 2: Findings
Criterion 1: Commitment to deforestation-free commodities
• Deforestation-related pledges have continued to increase since the adoption of the NYDF in 2014, with the number of companies making commitments increasing to 415 from 307 since last year’s report. Since commitments do not follow any commonly accepted deinitions, analysis of pledges, both in their scope as well as in their ambition, remains challenging.
• Of the companies active in the four big commodities, the majority of commitments address palm oil (59%) and wood products (53%). Soy and cattle receive signiicantly less attention (21% and 12%, respectively).
• The comparatively few commitments covering cattle—the single largest driver of deforestation— is a matter of concern, although the lack of commitments does not necessarily equal a lack of action. Reasons for limited commitments around cattle include the lack of an accepted industry standard for certiication, a highly mobile commodity, a higher percentage of local consumption, and a limited share of beef that is exported to Europe or North America.
• The majority of pledges continue to come from companies that operate mainly downstream in the supply chain (manufacturers and retailers). Upstream palm oil producers in Southeast Asia and meat processers in Brazil have also started to make signiicant commitments.
• A large share (91%) of company commitments focus on deforestation hotspots. This is encouraging, as action in deforestation hotspots has the potential to establish a clear link between supply-chain eforts and reduced deforestation.
Commitments from companies to address deforestation in their supply chains are driven by consumer demands, by reputational, legal, and environmental pressures, and by the need for a more sustainable and stable supply of agricultural products. In 2010, Nestlé became the irst global food company to publicly make a deforestation-free pledge.(20) Since then a multitude of producers, traders, manufac-turers, and retailers have expressed intent or commitment toward deforestation-free products, with new commitments often peaking at high-level climate change events. Most recently, the 2015 Paris climate conference saw a series of new commitments, such as Unilever’s and Marks & Spencer’s “pro-duce-and-protect” announcement to preferentially source from jurisdictions engaged in REDD+ eforts, as well as the commitments of 42 major companies to remove commodity-driven deforestation from all supply chains by 2020 as part of the We Mean Business coalition’s Commit to Action platform.
Indicator 1.1: Deforestation-related commitments by companies
Since the Deforestation Resolution of the Consumer Goods Forum in 2010,(21) which led to the establish-ment of the Tropical Forest Alliance 2020, and since the adoption of the NYDF in 2014, the supply-chain movement has developed rapidly. According to Supply-Change.org, 415 (66%) of the 629 researched companies with exposure to deforestation risk have made at least one public commitment to elimi -nate or reduce deforestation from their supply chains. Since a peak in new announcements in 2014, the numbers have shown a steady although slightly slowing increase both in irst and renewed pledges (Figure 4).iii Over the last year, 108 additional companies made 212 new commitments.iv Based on our interviews, almost all (92%) NYDF endorsers and TFA 2020 member companies made public deforesta-tion-related commitments, in addition to signing up to the goals of these initiatives.
Box 3. Concepts and deinitions
Companies announcing commitments on and working toward deforestation-free supply chains use a wide range of deinitions of what constitutes forest and hence what constitutes deforestation. In addition, companies use diferent standards to determine what types of forest set-asides should be spared from development.
Gross vs Net Goals for Eliminating Deforestation
Zero (Gross) Deforestation (ZD) means that no forest areas are cleared or converted.(91) Companies, however, use
diferent concepts or may lack a clear deinition of what qualiies as a forest area in terms of land cover, tree height or density, and temporary exploitation.
Zero Net Deforestation (ZND)means that clearance or conversion of forests is allowed in one area as long as an equal area is replanted elsewhere, provided that the net quantity, quality, and carbon density of forests is maintained. (59)
Without deining the implications of their ZND commitment and the preservation of net quantity and quality of forest areas, there is a risk of wrongly equating the value of natural forests with that of plantations.
Forest Set-Aside Concepts
High Conservation Values (HCVs) are biological, ecological, social, or cultural values that are considered outstandingly signiicant or critically important at the national, regional, or global level.(58) In this concept, companies pledge to avoid
all development in HCV areas, which does not include developments and deforestation outside of HCV areas.
High Carbon Stock (HCS) distinguishes forest areas for protection from degraded lands with low carbon and biodiversity values that may be developed.(60) Companies applying this concept conduct a land cover assessment to identify areas for
Commitments (total and by commodity) and companies that made any
com-mitment
Source: Climate Focus graph based on data from Supply-change.org, 2016
Figure 4. Number of commitments and companies (total and by commodity) that have made commitments.(3) 0 200 400 600 800 0 100 200 300 400 500
2012 2013 2014 2015 2016
N u m b e r o f c o m m it m e n ts N u m b e r o f c o m p a n ie s 415 companies 391 313 193 135 701 commitments 644 489 277 187 Timber and pulp Palm oil Soy
Cattle General
According to Supply-Change.org, only 43 (10%) out of the 415 companies with commitments have set company-wide targets that cover all commodities relevant to the company’s portfolio. Similarly, Forest 500 found that in 2016 only 34 (14%) out of 250 “powerbroker”v companies have made company-wide zero gross or other no deforestation commitmentsvi across all forest-risk commodities. Most corporate
commitments relate to a particular commodity and many relate to a geographic region—for example, excluding sourcing of soy or beef from the Amazon region. Companies adopt and implement defor -estation-related commitments selectively in response to reputational, legal, and environmental risk on one hand and to operational feasibility on the other. Our interviews conirm that the availability of standards for a particular commodity, high level of integration in the local supply chain, costs, and NGO pressure all play into the decision to adopt commitments.
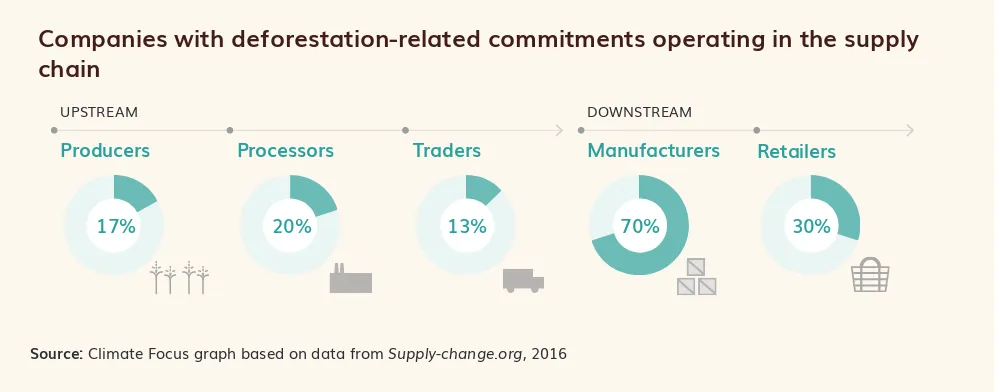
Consumer-goods companies generally deal with a large numbers of suppliers and therefore have the potential to trigger change along the whole supply chain. However, eventual impact on deforestation depends on producer companies taking action, as they are the ones managing the land and have a direct impact on land-use change.(3) Most of the companies that made commitments operate down-stream in the supply chain, with 67% in manufacturing and 30% in retail (Figure 6). At the same time, we see an increase in upstream companies (producers, processors, and traders) with ambitious de-forestation-free commitments, in particular in Southeast Asia. Meat processors and slaughterhouses in Brazil are also actively seeking to reduce deforestation from their operations. Yet the numbers of upstream company commitments are still relatively low (17%, 20%, and 13% of producers, processors, and traders respectively), so there is still signiicant progress to be made within these types of compa -nies.
Companies active in commodity with at least one relevant commitment
Source: Climate Focus graph based on data from Supply-change.org, 2016
Figure 5. Share of companies (out of 415) active in commodity with at least one relevant commitment.(3)
Palm oil Timber/Pulp Soy Cattle
59% 53% 21% 12%
Companies with deforestation-related commitments operating in the supply
chain
Source: Climate Focus graph based on data from Supply-change.org, 2016
Figure 6. Share of companies (out of 415) with deforestation-related commitments operating at diferent levels of supply chains.(3)
17% 20% 13% 70% 30%
Producers Processors Traders Manufacturers
UPSTREAM DOWNSTREAM
According to Supply-Change.org data, most of the commitments (89%) come from companies head-quartered in the European Union, North America, and Australia. Environmentally sensitive markets with a proactive consumer base and civil society movements can therefore exert a large inluence over the supply chain.
COMMITMENTS IN DEFORESTATION HOTSPOTS
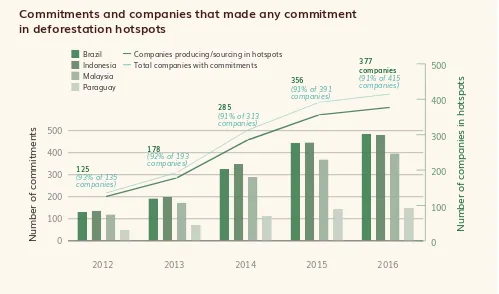
Interestingly, 91% of commitments come from companies sourcing or producing from deforestation hotspots (Figure 7),ix with the largest shares targeting Brazil and Indonesia (32% respectively), followed
by Malaysia (26%) and Paraguay (10%). These indings suggest that risk mitigation is a large driver in addressing deforestation in supply chains. Concentration of supply (80% of palm oil is produced in Indonesia and Malaysia and 33% of soy is produced in Brazil and Paraguay) may also be a key driver.(22) The country distributions are relatively in line with the share of commitments by commodity (higher in countries producing palm oil and wood, lower in soy and cattle), with the exception of Brazil. However, while Brazil is largely a producer of soy and cattle, it is also a major producer of wood (10% market share) and is expanding its palm oil production.(22)
Commitments and companies that made any commitment
in deforestation hotspots
0 100 200 300 400 500 0 100 200 300 400 500
2012 2013 2014 2015 2016
N u m b e r o f c o m m it m e n ts N u m b e r o f c o m p a n ie s i n ho ts p o ts 356 285 178 125 377 companies (91% of 415 companies) (91% of 391
companies)
(91% of 313 companies)
(92% of 193 companies)
(93% of 135 companies)
Indonesia Brazil
Total companies with commitments Companies producing/sourcing in hotspots
Paraguay Malaysia
Source: Climate Focus graph based on data from Supply-change.org, 2016
Figure 7. Number of commitments and companies sourcing / producing in deforestation hotspots that have made com-mitments. Note that there will be overlap in the number of commitments since a company may source/produce from
Box 4. Sustainable pastures: Zero-deforestation beef
The production of livestock is the main source of greenhouse gas (GHG) emissions in the agricultural sector and is a major source of total global emissions.(14) In addition to driving forest conversion for pastures and feed-crop cultivation
(e.g. soy and maize), beef and dairy cattle produce GHG emissions through enteric fermentation, manure management, feed production and energy consumption, adding up to about 65% of global agricultural GHG emissions.(94; 19) The
demand for livestock products has grown dramatically over the last ifty years, and changing diets, increased wealth, and a growing population make further growth likely, in particular in developing countries.(96) Consequently, cattle ranching
is expected to continue to pressure into forest land. In recent years, supply-chain eforts promoting zero-deforestation beef have grown substantially, but pledges on beef are lagging behind other commodities, in particular palm oil and wood products. While the contexts and circumstances vary among geographies, there are a number of reasons for the comparative lack in progress on pledges:
• A mobile commodity. Cows are often not only transferred from calving ranches to fattening farms but are also bought and sold by
var-ious additional traders before they arrive at the slaughterhouse.(61) Tracking often stops at the level of the last direct supplier, making
monitoring of deforestation links challenging.
• High levels of informality. Signiicant parts of the cattle sector are informal or even clandestine. In most countries, meat production is
subject to sanitary and veterinary regulation. Such regulation is however not always enforced or does not extend to non-food produc -tion (e.g. in Brazil hides and leather are not covered by food safety standards).(95) Enforcement is diicult where beef production does
not go through slaughterhouses that comply with food safety standards or is largely serving local markets (e.g. in Colombia).
• Lack of incentives. It has proven diicult to shift farmers’ culturally engrained practices. At the Latin American forest frontier, logging,
soy production, and ranching has for the longest time been politically supported and rewarded. The ‘frontier rancher’ continues to be culturally approved across many communities. Proit margins on ranching are low, but deforestation still leads to de-facto land acquisition in some places, which adds value to frontier ranching. While in some countries there are incentive payments for adherence to food-safety standards (e.g. in Colombia to dairy farms for compliance with veterinary and good practice standards), few systems reward the absence of deforestation from beef production. This situation is aggravated by the lack of coherent sectoral policies in many countries.
• Delay in engagement. Today there is no global industry standard for certiication of sustainable beef. Cooperative eforts to deine
standards for beef producers started late, with the Global Roundtable for Sustainable Beef becoming operational as late as 2013, almost ten years after the Roundtable for Sustainable Palm Oil.
Despite these challenges and the comparatively low number of deforestation-related pledges in the cattle sector, recent years have seen a push towards reducing land conversion driven by cattle production. In particular in Brazil a number of policies, iscal incentives (subsidies and tax breaks), projects and investments have been implemented to address forest conversion driven by agriculture. Supply chain actors have been key in implementing collaborative sector agreements and in facilitating investments into pasture management, technological improvements:
• The three largest meatpackers (JBS, Marfrig, Minerva) have signed agreements with the Federal Public Prosecutor’s Oices in various states stating that they would stop purchasing directly from ranches that would clear more land than legally permitted.
• In the Brazilian State of Pará nearly 90% of the federally inspected slaughterhouses have signed agreements with Greenpeace that commit them to avoid purchases of cattle from ranches with deforestation.(90)
• Such agreements are complemented by an increasing number of projects that support sustainable intensiication and management of pastures, such as the Novo Campo project in the Brazilian State of Matto Grosso. Novo Campo seeks to improve the economic, social and environmental performance of cattle ranching.(62) The Novo Campo pilot project has recently attracted international investors
to scale the program’s implementation beyond the piloting phase,(89) and large oftakers, such as McDonald’s Brazil, have agreed to
purchase meat from the Novo Campo or similar programs.
• The Field-to-Table programs co-sponsored by Walmart Brazil, Marfrig, and The Nature Conservancy is a similar program that aims further scaling of sustainable pasture programs.(88)
The Brazilian beef market is dominated by a few companies that control meat processing, and characterized by a comparatively high level of sophistication and capacities, an increase in supporting legal agreements and legislation, and a direct link to international export markets; all factors that make supply-chain eforts easier to implement than in neighboring countries with more local and informal markets. But there are promising initiatives emerging in other countries as well. An example is Colombia’s “Ganadería Sostenible” program which has started to make additional payments for farmers who combine sustainable practices with forest protection.(63) Leading supermarket chains, such
Criterion 2: Implementation of private-sector forest commitments
• Most companies are making headway in adopting policies to reduce their exposure to deforestation. They often favor a selective and step-wise approach of piloting the
implementation of their commitments with only select commodities or in priority geographies. Their choices are driven by, among other factors, reputational risk and civil society pressure, legal risk management, and operational feasibility to implement pledges.
• Despite some progress in the implementation of supply-chain commitments, many companies still cannot report compliance to their deforestation policies, and it cannot be conirmed whether available systems and policies are adequate in reaching the ambition presented in Goal 2 of the New York Declaration on Forests.
• The majority of companies opt to limit procurement to certiied products rather than deining their own company product standards. Implementation of global supply-chain commitments is generally more advanced in commodities with widely recognized certiication standards and integrated supply chains, which provide easy and accessible options toward sustainability. In line with our indings on commitments, progress toward increasing certiied production and sourcing has worked well for wood products and palm oil, but less so for soy and beef.
• Most companies have monitoring systems to trace the origin of their commodities, but they report inding the process challenging. Traceability to the production level is only achieved by a small percentage of companies – particularly for soy and palm oil. The tracking of cattle sales to its various owners and farms comes with its own challenges. However, encouraging new technological developments will help move tracing of commodities further upstream to the level of production and will help tie them to local forest impact.
• Companies producing or sourcing from deforestation hotspots are more advanced in
operationalizing their commitments than those with less exposure to these highly deforesting regions. Companies are likely more active on policies and monitoring in deforestation hotspots to mitigate risks.
• NYDF endorsers and TFA 2020 member companies are leading the way in adopting
commitments and translating them into actions. Companies that are engaged in these initiatives show signiicant progress in adopting policies and systems to implement their commitments. A selection bias, however, suggests that more advanced companies are more likely than companies that are lagging to disclose information on progress.
exposure to deforestation, their role in the supply chain, the countries in which they operate, and their company structure eventually deine their strategy to address deforestation and promote sustainability in their supply chains, resulting in a multitude of diferent implementation strategies.
Indicator 2.1: Adoption of deforestation-related policies to implement commitments
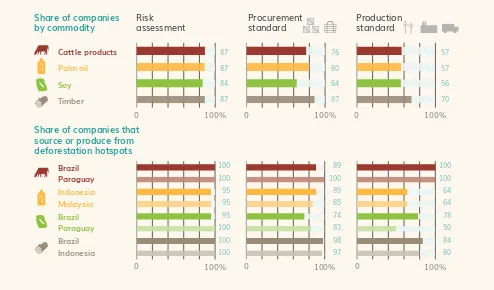
Across data sources, almost all companies assessed have begun to operationalize their commitments. According to CDP data, a large majority of companies (84–87%, depending on the commodity) have assessed their deforestation risks and opportunities (Figure 8). The majority of upstream (56–70%) and downstream companies (64–87%) have also taken steps toward implementation by adopting produc-tion or procurement standards. Producproduc-tion standards refer to company-deined environmental safe -guards or requirements for the production of raw materials for the selected commodity. Procurement standards, in contrast, deine quality requirements for the acquisition of commodities from suppliers. They can deine positive (e.g., preferential sourcing of certiied products) or negative (e.g., moratoria on purchases from deforested lands) criteria.Companies that have adopted speciic forest-related policies/strategies
0 100% 0 100% 0 100%
Risk assessment
Share of companies by commodity
Share of companies that source or produce from deforestation hotspots Production standard Procurement standard Palm oil Cattle products Soy Timber
0 100% 0 100% 0 100%
Indonesia Brazil Malaysia Brazil Paraguay Brazil Indonesia Paraguay 100 100 64 64 78 50 84 80 89 100 89 85 74 83 98 97 100 100 95 95 95 100 100 100 87 87 84 87 76 80 64 87 57 57 56 70
Source: Climate Focus graph based on data from CDP, 2015
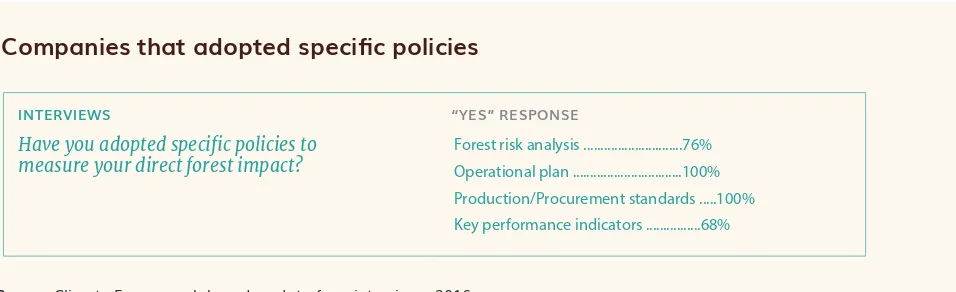
All NYDF and TFA 2020 companies interviewed have adopted operational plans and standards for pro-curement or production (Figure 9). Often these apply only to select commodities or geographies. Many companies further up the supply chain rely on certiication systems that provide a standard that sets requirements for production, forest conversion, and veriication and monitoring of compliance (Box 5). A large majority of companies interviewed also associate certiication standards with credibility. Two-thirds (68%) of the interviewed companies also use measurable values that demonstrate how efective -ly they are in achieving their targets. Such Key Performance Indicators (KPIs) related to deforestation are often tied to shares of certiied commodity produced or sourced or to a supplier’s compliance with set-aside and protection requirements. Several companies are also in the process of deining corporate KPIs tied to local forest impacts. Establishing a common understanding on relevant metrics and deini -tions across supply-chain actors, geographies, and commodities remains challenging, however. Eforts are also complicated by a lack of data—for instance, for establishing a company-wide baseline of de-forestation and relevant indicators to measure progress.
“Setting up common deinitions and goals for deforestation policies remains a challenge both within companies and in communication with suppliers and other stakeholders. We have developed comprehensive deforestation policies but integrating these into KPIs has proved diicult.”
- NYDF endorser/TFA member interviewee
Companies that adopted speciic policies
Source: Climate Focus graph based on data from interviews, 2016
Figure 9. Share of companies (out of 26 NYDF endorsers/TFA 2020 members) that adopted speciic policies based on interviews with NYDF endorsers and TFA members.
Forest risk analysis ...76% Operational plan ...100% Production/Procurement standards ...100% Key performance indicators ...68%
INTERVIEWS “YES” RESPONSE
Box 5. The role of certiication
Certiication standards specify requirements that suppliers may be required to meet relating to a wide range of sustainability criteria, including biodiversity and forest conversion. They govern an increasing global market share in certain commodities, including cofee (40%), cocoa (22%), and palm oil (22%).(44; 92) Since 2008, standards deined by the
Roundtable on Sustainable Palm Oil (RSPO), Sustainable Agriculture Network (SAN), and UTZ experienced a signiicant growth in compliant areas, increasing 30-fold, 9-fold, and 6.5-fold respectively.(44) The global market share of certiied
timber and pulp (11%), sugar (3%), and soybeans (2%) have however remained relatively low.(44; 92) There are small
volumes of beef being certiied by Rainforest Alliance (through SAN) and the Global Roundtable on Sustainable Beef does not have a global certiication standard but rather promotes regional initiatives. The global market share numbers are relected in the type of commodities companies are seeking certiication for, with companies primarily focusing on palm oil and wood and paper products.
SHARE OF CERTIFIED KEY COMMODITIES IN TROPICAL DEFORESTATION HOTSPOTS
PALM OIL (RSPO) SOY (RTRS/PROTERRA) PRODUCTIVE FORESTS (FSC/PEFC)
Brazil 40% 3.7% 1.8%
Indonesia 19% – 2%
Malaysia 23.1% – 23.1%
Paraguay –- 0.4% 1%
Source: (44; 46; 47)
While certiication standards are a central component of private sector commitments to reduce deforestation and forest degradation, there is little empirical evidence regarding their large-scale and long-term impacts on forests.
(48) A report in 2012 acknowledged that, in the near term, certiication standards have resulted in short-term positive
ecological impacts, but these are on a case-by-case basis and not universal across and within all certiication schemes.
(48) Geographically focused studies concluded that RSPO certiication led to reduced deforestation in Indonesian oil palm
plantations, (53) and that FSC certiication had no efect on deforestation in Mexico(50) but it decreased deforestation
in certiied forests in Chile(51) and Indonesia.(52) There are currently no empirical studies on the efects of deforestation
leakage from certiication.
In addition to the elements listed above, there are measures that certiication proponents take to address forest loss. Agricultural certiication standards can ensure direct impact by setting cutof dates for deforestation suiciently far in the past and by accurately identifying production areas, forests, HCV, and other important ecosystems to prevent conversion during plantation establishment.(45) Some certiication standards, like RSPO, Roundtable on Sustainable Soy
(RTRS), SAN, and UTZ, allow ofsetting of past unsustainable practices by protecting or restoring an equivalent area of land originally deforested.(45) Other agricultural certiication standards, like Naturland, increase their direct impact
by restoring degraded and deforested areas or by establishing minimum forest cover on certiied areas.(45) Similarly,
some forest certiication standards enhance their forest-related impacts by working with governments in locating their plantations next to HCV or primary forests, so as to provide a bufer for these areas.(49)
A major limitation of certiication schemes is their lack of inluence over the “bottom of the market”.(48) In situations
without an overarching forest protection framework, other actors may continue to clear and degrade forests in these areas. Certiication schemes exert greater inluence over production when a large proportion is consumed in environmentally sensitive markets, as in the case of premium certiied cofee exported to the North America and the European Union, for example.(48) Inluencing the late adopters, however, will require a combination of public policies and
enforcement, inancial incentives, and civil society movement in less environmentally sensitive markets.
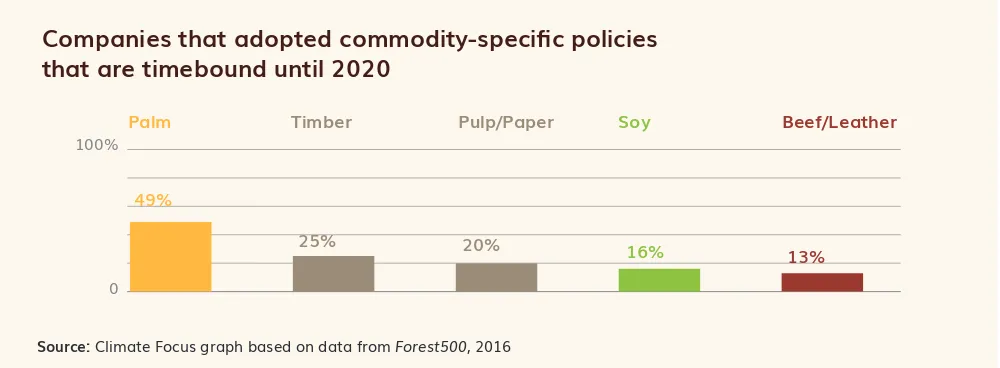
It also cannot be conirmed whether these systems and policies are adequate in reaching the ambition presented in Goal 2 of the New York Declaration. According to 2016 Forest 500 data (Figure 10), only around half (49%) of all companies assessed had introduced time-bound, commodity-speciic opera -tional plans to guide the implementation of their commitments on palm oil. For all other commodities, the shares were lower, at 43% for pulp/paper, 14% for timber, 21% for soy, and 11% for beef/leather.
Companies that adopted commodity-speciic policies
that are timebound until 2020
Palm Timber Soy Beef/Leather
49%
25%
Pulp/Paper
20% 16%
13% 100%
0
Source: Climate Focus graph based on data from Forest500, 2016
Figure 10. Share of companies (out of 250) that adopted commodity-speciic policies that are time-bound until 2020.(24)
Related to the adoption of procurement standards, CDP’s forests program notes in the 2015 Global Forests Report that of the companies that use certiication to ensure security and continuity of their palm oil supply, 64% encourage and 18% prefer rather than require (18%) certiication from suppliers.
(23) Company standards and guidelines also often remain general and few companies provide adequate guidance and support for staf and suppliers to implement policies. For instance, in the same CDP report, only ive companies explicitly reported that they train their procurement staf on the application of standards, and only one-quarter (26%) of manufacturers and retailers run workshops or provide trainings for their suppliers on sustainable commodities.(23)
Box 6. Musim Mas and CORE
In the palm sector, soon after the NYDF was signed companies started to act on their forest and social policies diferently, depending upon their business culture, suppliers, customers, and other market or political pressures, in ways supportive of the declaration’s goals. In Southeast Asia, the big irms growing, processing, and trading palm oil or its derivatives and their co-products have turned to conservation and human rights non-proit organizations as well as for-proit consulting companies to advise on strategy, design policies or plans for action, assess risk or identify gaps, and even audit the performance of supply chain actors.
In Indonesia, for example, an alliance of Proforest, the Rainforest Alliance, and Daemeter Consulting is working together as the Consortia of Resource Experts (CORE). By working in a consortium, the organizations are able to draw on one another’s complementary skills and respond more completely to the needs of plantation companies and independent smallholders. CORE has worked with Musim Mas, Unilever, and Astra Agro Lestari, and other companies are in the pipeline. One central aspect of the work is the inclusion of smallholder growers, who produce up to 40% of Indonesia’s palm oil and thus play an important role in achieving corporate goals of the NYDF.
In 2015, CORE was engaged by a leading palm oil company, Musim Mas—headquartered in Singapore and with operations throughout Indonesia, the Asia-Paciic region, Europe, and the Americas—to support the implementation of the company’s sustainable palm oil policy. The scope of work began with traceability veriication to a small number of reineries. The company engaged CORE to irst conduct bio-physical risk assessments for the top 100 mills (out of over 600) that supply Musim Mas. Emphasizing risks within key provinces, such as Riau, Central Kalimantan, and North Sumatra, enabled the company to target eforts on priority landscapes and suppliers. Further, Musim Mas has undertaken traceability assessments and also HCS, HCV, and social assessments of smallholders and independent mills.
CORE applies an approach to veriication that includes standardized methodologies for mill-level veriication criteria, veriication assessments, and reporting, which includes recommendations for continuous improvement. An important element in its approach is supplier workshops, which enable Musim Mas to explain to its key suppliers (mill owners or head managers of small holder producer groups) the purpose of third-party veriication audits, to communicate its policy commitments, and to discuss the practical implications for their operations and ways to implement the commitments.
CORE has carried out three on-site veriications for palm oil mills in the Musim Mas supply chain. Seven more are planned. These veriications determine irst-hand how well suppliers are doing in meeting its purchasing policies, identify the main issues for improvement, and monitor implementation of company policy on traceability to speciic mills, a precursor of monitoring traceability to plantations. Some issues can be implemented by suppliers alone, while others will need additional support from Musim Mas, and still others will require actions at a scale of support including other companies or government. In addition, as a Palm Oil Innovation Group (POIG) member, Musim Mas asked Rainforest Alliance for an evaluation of the Group’s operations using the POIG veriication indicators and an RSPO NEXT Gap Analysis.
Companies like Musim Mas have turned to specialist practitioners, such as Proforest, the Rainforest Alliance, and Daemeter, as one part of their strategy for responsible production and sourcing, especially where that may help them resolve any issues they have in getting suppliers to be compliant with their policies. The example here is a risk-based approach to analyze and target implementation of corporate p