T
he wild crucifer Arabidopsis thalianahas become an important model system because it allows genetics to combine with mol-ecular biology (i.e. it has a short generation time, a small genome and is easily transformed)1. TheArabidopsisgenome is esti-mated to contain ~25 000 protein-coding genes, of which it is thought that nearly 40% will have unknown cellular roles, and only ∼5% will have an established phenotypic function2. Therefore, finding func-tions for these genes will be a major challenge for the next decade.
Genetic variation is required for the functional analysis of the Arabidopsis genome
Laboratory-induced mutants
Currently, the functional analysis of Arabidopsisgenes and the dissection of complex traits are based largely on the phenotypic characterization of mutants selected by forward and reverse gen-etics in a few laboratory ‘wild-type’ genotypes. The inbred strains generally used are Landsberg erecta(Ler), Columbia (Col) and Wassilewskija (Ws), originally collected from the wild by the pioneers of Arabidopsisresearch, Friedrich Laibach and colleagues3. These forward and reverse genetic approaches using classical (physical or chemical) and insertional (biological) mutagens have proven their usefulness1. The possibility of identifying genotypes with an insertion in a gene of known nucleotide sequence, inde-pendently of the presence of a phenotype, has led to large-scale proj-ects for disrupting most of theArabidopsisgenes1,4. In addition, sophisticated mutant screens are continuously being developed. However, the definition of gene functions using these procedures will be limited by the small number of genetic backgrounds analysed, because the type of mutant phenotypes that can be identified ultimately depends on the wild-type genotype. For example, first, mutant phenotypes of genes, for which the wild type carries a functionally null allele (either mutated or silenced) or a weak allele, might not be detected. Secondly, epistatic interactions (as a consequence of, for example, redundancy of either gene functions or of genetic pathways) will ensure that some phenotypes appear only in certain genetic backgrounds.
Naturally occurring variants: new times for an old resource As an alternative to generating laboratory-induced mutants, another source of genetic variation can be found among and within
naturally occurring populations of Arabidopsis (Fig. 1). In the earliest stages of Arabidopsisresearch, the phenotypic characteri-zation of plants collected from different geographical regions (in relation to traits presumed to be ecologically important for adap-tation to different environments) revealed considerable genetic variation3,5–7. Because
Arabidopsis is predominantly a selfing species, most collected plants represent inbred lines that are prac-tically homozygous. These wild homozygous lines are referred to commonly as ecotypes – a term originally defined as distinct races of a species genetically adapted to particular habitats8. However, as has been noted previously9, the use of this word with regard to Arabidopsisdoes not conform strictly to its ecological definition. At present, its ecological meaning has been lost; therefore we use the term accession, as this is often used in germplasm collec-tions to refer to a plant genotype of a species collected at a specific location.
Exploitation of the genetic variation among accessions has been limited because of its mostly quantitative (continuous) nature, in contrast with the commonly studied mutants, which pro-vide qualitative (discrete) variation. This dichotomy is defined basically by the number of loci and the environmental effect underlying the variation under study, which determine the tools used for its analysis. Only in the past decade, with the advent of efficient molecular marker technologies and specific statistical methods, has the map position and the effects of quantitative trait loci (QTL) been established10–12. Recently, the study of variation among Arabidopsis accessions has been renewed by the appli-cation of methods that were developed and extensively used in crop plants. In contrast with larger genomes, the characteristics of Ara-bidopsisallow these genetic analyses to be followed up efficiently to the molecular level, and thus it is becoming a model organism for quantitative genetics. Several recent reviews have summarized the current status of these studies to either address questions related to the molecular basis of quantitative variation and adap-tation and its application to domesticated crops2,13–15; or to address ecological questions related to population structure, plasticity and ultimately to the evolution of Arabidopsis and its relatives9. In this review, we focus on the systematic exploitation of the naturally occurring variation as a complementary resource for the func-tional analysis of the Arabidopsisgenome.
Naturally occurring variation in
Arabidopsis: an underexploited
resource for plant genetics
Carlos Alonso-Blanco and Maarten Koornneef
Wealth of naturally occurring variation Arabidopsis is distributed widely in the world7: many accessions have been col-lected from wild populations growing throughout the Northern hemisphere in Europe, Asia and Africa; from northern Scandinavia at 688 to the Cape Verde Islands at 168; from sea-level in The Netherlands to the high western Himalayan region. It has also been found in North America, Australia and Japan, where prob-ably it was introduced from Europe (Fig. 2). This broad geographic distribution embraces substantial variation in growth environments, hence, phenotypic variation among accessions is expected to reflect the genetic variation that is important for adap-tation to specific conditions (Fig. 1; Table 1). Considerable variation has been found for potentially adaptive traits, such as resist-ance (measured as plant survival or damage)
to biotic stresses (pathogens), including insects, fungi, bacteria and viruses16; or tolerance to abiotic stress parameters, such as high temperature, freezing, drought, metals, carbon dioxide and ozone6,17–20. Variation has also been described for many other characters including:
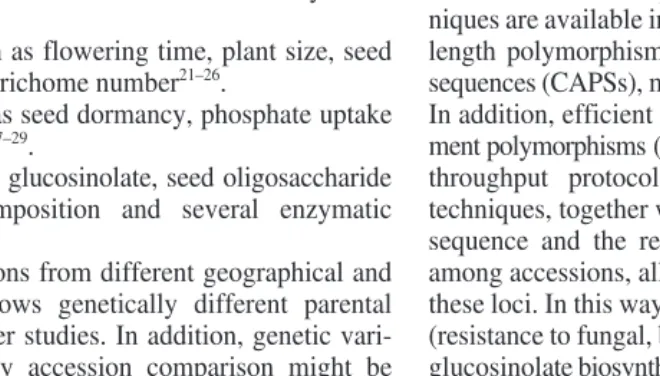
• Developmental traits, such as flowering time, plant size, seed size, venation pattern and trichome number21–26.
• Physiological traits, such as seed dormancy, phosphate uptake and water-use efficiency5,27–29.
• Biochemical traits, such as glucosinolate, seed oligosaccharide or epicuticular wax composition and several enzymatic activities30–33(Table 1).
Thus, comparison of accessions from different geographical and ecological environments allows genetically different parental lines to be selected for further studies. In addition, genetic vari-ation that is undetectable by accession comparison might be revealed when analysing segregating
popu-lations derived from crosses between accessions. This is the case when segregat-ing individuals have phenotypes outside of the parental range of variation (transgres-sion). Therefore, segregating populations provide a better estimate of the variation present between two accessions. Trans-gressive segregation has proven to be use-ful particularly for the analysis of homeostatic traits, such as the circadian period34, or for viability loci detected by the segregation distortion observed in most mapping populations35–37.
Forward genetic analysis of naturally occurring variation
Mapping large-effect loci from qualitative variation: mendelian mapping
The variation in a particular trait between two accessions is, in some cases, because of the major effect of allelic variation at one or two loci. This gives rise in experi-mental segregating populations to pheno-typic distributions that can be classified in discrete classes and fitted to monogenic or digenic segregations (Fig. 3). Classical
mendelian genetic analysis of these large-effect alleles has been performed in a similar manner to that used with induced mutants, because the genotype of an individual at the segregating loci can be inferred from its phenotype. Several molecular marker tech-niques are available in Arabidopsis, including restriction fragment length polymorphisms (RFLPs), cleaved amplified polymorphic sequences (CAPSs), microsatellites and duplex analysis markers1,38. In addition, efficient multilocus procedures, such as amplified frag-ment polymorphisms (AFLPs), have been applied37and new high-throughput protocols are being developed39. These marker techniques, together with the availability of the complete genome sequence and the relatively high frequency of polymorphisms among accessions, allow a rapid and accurate linkage mapping of these loci. In this way, many Arabidopsisdisease resistance genes (resistance to fungal, bacterial or viral pathogens16,40,41) and several glucosinolate biosynthesis loci30,31have been identified (Table 1). In Fig. 1. Naturally occurring variation in Arabidopsis thaliana. Plants from two wild populations, (a) and (b), illustrate the variation existing between and within (b) populations, even at the level of overall morphological appearance. (c) When inbred lines collected from different populations (accessions) are grown together under the same experimental environment, pheno-typic variation among lines reflects genetic variation. For instance, the plants of seven acces-sions presented in (c) differ in several traits of the vegetative growth phase, such as trichome density, leaf production rate and leaf colour, size and shape. Scale bar 52 cm.
Fig. 2.Geographical distribution of Arabidopsis thaliana. Shaded areas correspond to a slightly updated distribution that has been described previously7. The 240 accessions
col-lected from different locations, which are available currently through the Arabidopsisstock centres, have been plotted as green dots. Most sampling has been performed in Europe and therefore there is a lack of publicly available samples from various regions, such as Africa and, especially, Central Asia, which is a region rich in populations and variability66. Data
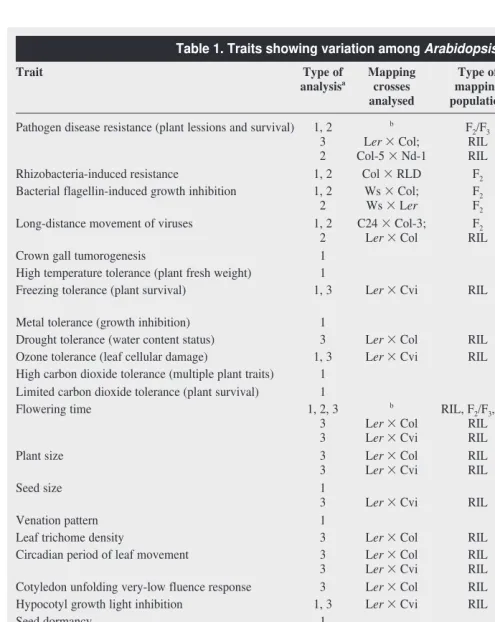
Table 1. Traits showing variation among Arabidopsis accessions
Trait Type of Mapping Type of Number of Ref.
analysisa crosses mapping loci
analysed population identifiedb
Pathogen disease resistance (plant lessions and survival) 1, 2 b F
2/F3 .18b 16
3 Ler3Col; RIL 3 59 2 Col-5 3Nd-1 RIL 1 40 Rhizobacteria-induced resistance 1, 2 Col 3RLD F2 1 41 Bacterial flagellin-induced growth inhibition 1, 2 Ws 3Col; F2 1 60 2 Ws 3Ler F2 1 60 Long-distance movement of viruses 1, 2 C24 3Col-3; F2 1 61 2 Ler3Col RIL 1 61
Crown gall tumorogenesis 1 62
High temperature tolerance (plant fresh weight) 1 6
Freezing tolerance (plant survival) 1, 3 Ler3Cvi RIL 2 J.M. Martinez-Zapater and J. Salinasc
Metal tolerance (growth inhibition) 1 17 Drought tolerance (water content status) 3 Ler3Col RIL N. Vartanianc
Ozone tolerance (leaf cellular damage) 1, 3 Ler3Cvi RIL 1 18; I. Aguilar and K.R. Davisc
High carbon dioxide tolerance (multiple plant traits) 1 19 Limited carbon dioxide tolerance (plant survival) 1 20 Flowering time 1, 2, 3 b RIL, F
2/F3, BC .15b 21
3 Ler3Col RIL 12 22,47 3 Ler3Cvi RIL 8 48
Plant size 3 Ler3Col RIL 2 22
3 Ler3Cvi RIL 4 23
Seed size 1 24
3 Ler3Cvi RIL 11 23
Venation pattern 1 25
Leaf trichome density 3 Ler3Col RIL 1 26 Circadian period of leaf movement 3 Ler3Col RIL 2 34 3 Ler3Cvi RIL 4 34 Cotyledon unfolding very-low fluence response 3 Ler3Col RIL 2 63 Hypocotyl growth light inhibition 1, 3 Ler3Cvi RIL H. Smithc, J. Maloofd
Seed dormancy 1 5,27
3 Ler3Col RIL 14 49
3 Ler3Cvi RIL 7 C. Alonso-Blanco, L. Bentsink and M. Koornneefd
Tissue culture and transformation 1 62,64 Phosphate uptake and root mass 1 28
Water use efficiency 1 29
Cytokinin-induced inhibition of root growth 1 D.E. Hankec
Auxin-induced growth 1 K. Sogac
Epicuticular wax composition 1 32
Aliphatic glucosinolates 1, 2 Ler3Col RIL 2 30,31 2 Limburg-5 3H51 F2/F3 1 31 Seed oligosaccharide content 1, 3 Ler3Cvi RIL 4 L. Bentsink and
M. Koornneefd
Enzyme activities 3 Ler3Col RIL 1–3 per enzyme 33 Sugar-induced b-amylase 2 Ler3Col F2 1 65 Viability (segregation distortion) 3 Nd 3Ler F2 1 35
2 Ler3Cvi RIL 2 C. Alonso-Blanco and M. Koornneefd
aTwo sorts of studies have been performed: searches of genetic variation among accessions (indicated as ‘1’ in the second column) and genetic mapping analyses.
Genetic mapping analyses are classified as mendelian (indicated as ‘2’ in the second column) or quantitative trail loci (indicated as ‘3’) analyses.
bDisease resistance and flowering time are the most studied traits and have been previously reviewed in Refs 16 and 21. The minimum number of loci identified in
the various crosses detailed in those references is given. For the remaining traits, the number of loci identified in each cross is provided.
cPersonal communication. dUnpublished.
Fig. 3. A comparison of qualitative and quantitative variation and mapping. Qualitative variation for a trait, defined by a phenotypic distribution that can be classified in discrete classes in a segregating population, is caused mostly by the major effect of allelic variation at one or two loci. This is found, for example, in crosses between Arabidopsisaccessions differing in pathogen disease-resistant genes (a), and in crosses between near-isogenic lines (NILs) differing in a single flowering time quantitative trait locus (QTL) called EDI(early, day-length insensitive) (b). In (b), the geno-type of the parental NILs is depicted in the inset, the EDIphenotype is depicted in light grey and the Ler(Landsberg erecta) phenotype is depicted in white. (c) Because the genotype of an individual at the segregating locus can be inferred from its phenotype, classical mendelian genetic analysis and linkage mapping of these loci can be performed. Recombination frequencies with SEs are estimated directly between the locus of interest and the marker loci, thus defining its map position. For a given population size, the accuracy of the mapping is limited by the marker availability in the locus region. Quantitative variation, defined by a continuous phenotypic distribution in a segregating population, is caused by the combined effects of allelic variation at several segregating loci (multigenic) and the environment, such as is found among accessions for flowering time (d). The genotype at these loci (so-called QTL) cannot be directly known from the single phenotypic value of a plant, but this can be inferred indirectly from linked marker loci in a QTL mapping analysis. First, this requires a genome-wide molecular genetic map of the mapping population. Secondly, associations between the genotypes at the markers and the phenotypes of the trait are searched to identify the closest linked markers to QTL, which will split the pheno-typic distribution in significantly different but overlapping sub-distributions. (e) The distribution from (d) has been classified according to the alleles at the AXRmarker, linked to the QTL EDI [recombinant inbred lines (RILs) carrying AXR-Leralleles are depicted in white and those carrying
AXR-Cvi (Cape Verde Islands) alleles are depicted in light grey]. These associations are searched by means of statistical methods10–12that apply the
addition, large-effect alleles have been found for flowering time (an otherwise typically quantitative trait), as shown with the allelic variation at the loci FRI, FLC and ART, which are largely responsible for the differences in flowering behaviour and the vernalization requirement between late and early accessions42–45.
Mapping loci from quantitative variation: quantitative trait loci mapping
Most of the variation among accessions is of a quantitative nature because of the effects of allelic variation at several loci (multigenic), which, combined with the environmental effect, determines a continuous pheno-typic distribution of the trait in segregating populations. The genotype at these loci cannot be directly known from the sin-gle phenotypic value of a plant determined by the various loci and the environment, but this can only be inferred indirectly from linked marker loci (Fig. 3). The detection and location of the loci underlying this quanti-tative variation (so-called QTL) requires first the gener-ation of a segregating popu-lation (Fig. 4) and its characterization for molecular markers (i.e. the obtainment of its genome-wide genetic map). Secondly, after scoring the trait of interest, associ-ations between the genotypes at the molecular markers and the phenotypes of the trait are searched by means of specific statistical methods (reviewed in Refs 10–12). These methods use the information from flank-ing markers, resultflank-ing in the indirect estimation of the posi-tion and effect of QTL along the different linkage groups.
The quality of QTL mapping (the number of QTL detected and the accuracy of their map position and effect estimates) depends, among others, on the overall heritability of the trait, the magnitude and location of the QTL and the amount of observed recombination in the segregating population. In addi-tion, it is affected by the follow-ing manipulable experimental parameters:
• Size and type of mapping population.
• Coverage of the molecular genetic map.
• Statistical QTL mapping method employed.
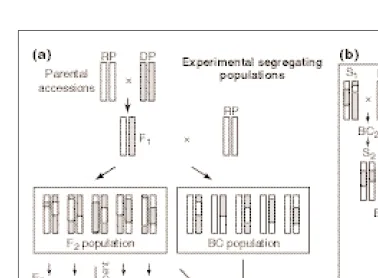
In Arabidopsis, relatively large populations can be grown in a small area, under controlled environments, and mapping popu-lations can be obtained in a relatively short period of time. Although any type of mapping population can be used, recombinant inbred lines (RILs) offer unique advantages46 (Fig. 4), mainly because Fig. 4. The production and use of experimental segregating populations and near isogenic lines (NILs).
The graphical genotype of individual plants is depicted for a representative single pair of chromosomes. (a) To detect and locate quantitative trait loci (QTL) any type of experimental segregating population can be used, such as the common backcross (BC) or F2populations (for other designs see Ref. 67). However,
recombinant inbred lines (RILs) are the usual choice in Arabidopsisbecause, although they take longer to be produced, they offer unique advantages46. RILs are derived by successively selfing single plants from
the progeny of individual F2plants (single-seed descent method) until homozygosity is achieved at the F8
generation. Because they are homozygous, well characterized RIL populations can be permanently propa-gated and used indefinitely without further genotyping. A trait can be analysed on several sister plants per line, which minimizes the environmental variation and improves the accuracy of the QTL mapping; a trait can be measured in the same population grown in different environments, which allows the detection of QTL that cause genotype 3environment interactions; the same population can be studied for different traits, enabling the identification of putative QTL with pleiotropic effects. Nevertheless, in contrast with F2populations, RILs and BC do not allow the degree of dominance at the detected QTL to be estimated.
(b) NILs differing in the alleles around a single QTL can be obtained by producing either introgression lines (ILs) or heterogeneous inbred families (HIF). ILs, which contain a genomic region from a donor parental accession, into the genetic background of one of the laboratory strains are more useful because they are in a reference genetic background. They are obtained by recurrent backcrossing and selection, starting from a plant chosen on the basis of its phenotype and/or genotype (such as an accession, an F2
individual, a characterized RIL or another IL), and, hence, are also referred to as recombinant backcross lines or backcross inbred lines (BILs). Selection can be based on the phenotype [when large-effect QTL are of interest (backcross breeding)] and/or on the genotype by marker-assisted selection (MAS), which reduces the number of generations needed51. Depending on the dominance of the alleles of interest,
pheno-typic selection might be done on the BC progenies, avoiding selfing generations. Final genotyping of the ILs should establish the regions containing the alleles for which selection was performed and for which single QTL ILs are derived subsequently. Alternatively, NILs can be produced from inbred lines that are not entirely homozygous (so-called heterogeneous inbred families) derived by continuing selfing until the F5generation (single-seed descent). Analysis of HIF with molecular markers around the QTL of interest
(MAS) allows selection of heterozygous lines in this region50. The phenotypic examination of further
they are homozygous. Well characterized RIL populations are permanent and can be used indefinitely without further genotyping, allowing their simultaneous analysis by any laboratory. Furthermore, the availability of the molecular marker techniques described above make it relatively easy to generate genome-wide genetic maps. QTL mapping experiments have been performed for various traits in Arabidopsis, mainly using three RIL populations36,37,40(Table 1). Analyses under several different environmental conditions have identified QTL causing genotype 3environment interactions for flowering time47,48and seed dormancy49. Moreover, analysis of sev-eral related traits in the same RIL population, which aimed to iden-tify QTL with pleiotropic effects, have been performed for seed size23, flowering time22,23and enzyme activities of primary and sec-ondary metabolism33. The number of QTL detected in these studies varies between one and 14 loci depending on the experimental set up and on the complexity of the trait (Table 1). Importantly, most of these studies have identified loci whose absolute effects are suffi-ciently large to allow further analysis, their allele effects being com-parable to the effect of laboratory mutant alleles. Nevertheless, the number of detected QTL and the estimation of their effect and pos-ition remain subject to considerable statistical error and bias12. The confidence intervals for the position of the QTL in the populations studied (usually not more than 200 individuals) are ~10 cM (centi-Morgans) for large-effect loci, which might correspond to several closely linked loci, their effect estimates being biased towards larger values. In addition, small additive effect and/or epistatic loci are either not detected or require confirmation in further analyses. Comparison of map positions among the QTL identified and the mutant or genes known to affect a trait have indicated that some of the QTL correspond to loci of previously unknown function26,49. In particular, the identification of loci at novel map positions has allowed the rapid identification of new function loci for traits that are not exhaustively analysed, for which only a few mutants have been previously isolated. Examples are laborious traits, such as enzyme activities33, seed oligosaccharide content (L. Bentsink
et al., unpublished) or the circadian period34. For traits for which more knowledge is available, apparent co-location is often found, sug-gesting that QTL identify new naturally occurring alleles at par-ticular candidate loci or genes. However, these rough co-locations must be interpreted with caution given the low resolution of QTL mapping and the complexity of many traits for which known mutants and genes affecting the trait are scattered throughout the genome. Further phenotypic characterization of the QTL of interest and finer mapping are needed to determine whether the trait variation is because of mutation(s) at a single locus or several tightly linked loci and its/their effect(s). The eventual molecular isolation of the gene should establish the molecular nature of the allelic variation.
Mendelizing quantitative trait loci
To characterize an individual QTL it must be separated from the rest of the segregating loci (i.e. to obtain genotypes that will give rise to monogenic segregation in subsequent progenies). Com-monly, this process is referred to as mendelization of a QTL (Figs 3 and 4). The mendelization of a QTL is best accomplished by constructing near-isogenic lines (NILs), ideally differing only for the alleles in a small genomic region spanning a few cM around the QTL of interest. Once NILs with monogenic segregation are obtained, their comparison enables the phenotypic and genetic characterization of a QTL in a similar way to that performed with mutants. The genetic characterization includes the analysis of the dominance relationships between the two alleles under study and, in some cases, complementation tests between QTL alleles and known mutant alleles at candidate loci. In addition, NILs allow for further fine mapping and chromosome walking towards the locus.
NILs for a particular QTL can be obtained by producing either introgression lines (ILs), or heterogeneous inbred families (HIF)50 (Fig. 4). ILs (containing a genomic region from a donor parental accession) into the genetic background of one of the laboratory strains are more useful because NILs are in a reference genetic background. These lines are obtained by recurrent backcrossing and their production can be facilitated using marker-assisted selection (MAS), which reduces the number of required generations51. Alterna-tively, when only relatively large-effect alleles are of interest, backcross breeding (without MAS) can be applied, such as has been done for flowering time48. In this case, extreme phenotypic selection is performed during several recurrent backcross generations, intro-gressing simultaneously most of the large-effect alleles at the existing QTL (Ref. 52). Final genotyping of the ILs should establish the regions containing the alleles for which selection was per-formed and for which single QTL NILs are derived subsequently. Such breeding can be performed without previous knowledge of QTL locations, thus obtaining simultaneously the map position of large-effect QTL and the advanced material needed for further analysis. The characterization of Arabidopsislarge-effect QTL isolated in ILs has been reported for loci involved in flowering time43,44,48, circadian period34and seed dormancy (C. Alonso-Blanco
et al., unpublished ). In addition, the availability of sets of ILs with differ-ent introgressed regions that together cover the differ-entire genome has provided a useful tool for QTL mapping and analysis in several crops species53,54, but has not yet been developed in
Arabidopsis.
Molecular isolation and characterization of loci responsible for the naturally occurring variation
The molecular characterization of the allelic variation requires that the respective genes are cloned. In the past few years, several genes involved in disease resistance have been isolated using the existing variation among accessions16. In addition, the cloning of two flowering time genes, FLC (Ref. 55) and FRI(C. Dean, pers. commun.), with large-effect allelic variation, has been accom-plished recently. This progress has proven the feasibility of isolat-ing the genes responsible for wild variation, and to establish the phenotypic function, previously unknown, of important genes. To date, only large-effect loci of ‘qualitative’ effect have been iso-lated, but this research has established the methods that can be applied to identify molecularly the QTL of smaller relative effect, detected in continuous distributions. Thus, the cloning of several QTL, identified in the Ler 3 Cvi RIL population is currently underway, including loci that affect the photoperiodic induction of flowering, seed dormancy (M. Koornneef et al., unpublished), freezing tolerance (J.M. Martinez-Zapater and J. Salinas, pers. commun.) and circadian period (A. Millar, pers. commun.).
be accelerated by including easily scorable flanking morphologi-cal markers in the parental lines. Thus, the locus of interest can be positioned within a few kilobases by analysing between 2000 and 5000 segregating gametes. In contrast with the analysis of induced mutants, evidence that a cloned gene is responsible for the observed variation of a trait is limited when working with the nat-ural variation among accessions. This is because various nucleotide changes are probably present in the mapped region and, therefore, genomic sequence polymorphisms and RNA differences for length or expression level cannot be unambiguously argued. The identifi-cation of the locus carrying the mutation(s) that cause the phenotypic variation, mainly relies on complementation by plant transfor-mation of one of the parental accessions with a genomic clone from the other parent. The availability of sequence data in a small genomic region might expedite this process by finding ‘candidate’ genes with which to generate transgenic plants. Nevertheless, the large-effect alleles of the resistance genes and FLChave made it easy to select induced mutations16,55, which has facilitated their identification. As an alternative to chromosome walking, the availability of efficient insertional mutagenesis systems and of large collections of lines with known insertion positions1,2,4could contribute, in the near future, to the isolation of tagged mutants at specific QTL. This has been shown elegantly in maize using a transposon approach to tag and to isolate the teosinte branched 1gene (which is a major locus involved in the evolution of apical dominance during the domes-tication of maize56). Similar tagging strategies can be applied even when no candidate mutant locus exists. For instance, a line with a transposon in the vicinity of the locus of interest can be the starting material for transferring this element by recombination into the appropriate IL. In addition, mutagenesis experiments in a particular IL background might also produce mutants of other genes that could be undetectable because of epistasis in the original ‘wild-type’ accession. Furthermore, when the corresponding QTL has been fine mapped, existing lines with the insertion in the region of interest might be used for detailed phenotypic analysis of the trait by search-ing for small effects that would provide a candidate tagged gene.
Recently, further exploitation of the naturally occurring allelic variation at the functional level of RPS2 (the first Arabidopsis re-sistance gene to be cloned) has been attempted57. Alleles of this locus have been sequenced in various accessions that differ in their resistance phenotype, to link molecular polymorphisms with their phenotypes. Such functional analyses will be interesting for QTL for which functional naturally occurring allelic series exist. This is suggested by the QTL mapping in different crosses, where some QTL are located at similar positions but have different allele effects, as shown for traits such as flowering time48or circadian period34. It is thought that these studies should help to elucidate molecular mechanisms that underlie the function of genes, which otherwise might be undiscovered if the analysis was based on laboratory-induced alleles generated by the current methods, as illustrated by the work examining the clock gene periodof Drosophila58.
Concluding remarks and prospects
Recent progress in locating and isolating Arabidopsisgenes that account for naturally occurring variation among accessions shows that the analysis of this resource complements the use of labora-tory mutants for the dissection of complex traits and the functional characterization of genes:
• Genes whose phenotypic functions cannot be detected by the current mutant approaches in the standard laboratory strains (owing, for example, to the presence of a null or weak allele, lethality or redundancy) are identified.
• Naturally occurring variation appears as an efficient alternative when laborious or expensive assays are needed to identify mutants.
• New functional alleles of known function genes, which could reveal important information about the molecular mechanisms involved in the function of those genes might be identified. The exploitation of this source of variation will increase and become more systematic and efficient with the development of more permanent mapping populations between distant accessions (including NIL populations), high-throughput automated genotyp-ing (marker) technologies, improved QTL mappgenotyp-ing statistical methods, and more precise assays for phenotype analysis. Thus, not only large-effect alleles, but also smaller ones and natural allelic series, might be available for functional analysis in the future. In addition, the molecular identification of the actual loci and alleles affecting important adaptive traits that have been selected in nature under particular environments should provide a unique source of information to understand gene functions at the supra-organism level. In other words, by knowing the selection experience of nature we should have a greater understanding of the molecular basis of adaptation and of quantitative variation, and we might be able to manipulate the important agronomic traits more effectively.
Acknowledgements
Our thanks to Dr Jose M. Martinez-Zapater for helpful comments on the manuscript, and to our colleagues for providing unpublished information. C.A-B. was supported by a salary contract from the Ministerio de Educación y Cultura of the Spanish government.
References
1Meinke, D.W. et al.(1998) Arabidopsis thaliana: a model plant for genome analysis. Science282, 662–682
2Bevan, M. and Murphy, G. (1999) The small, the large and the wild; the value of comparison in plant genomics. Trends Genet.15, 211–214
3Laibach, F. (1951) Über Sommer und Winterannuelle Rasse von Arabidopsis thaliana(L.) Heynh. Ein Beitrag zur Atiologie der Blutenbildung. Beitr. Biol. Pflantzen28, 173–210
4Maes, T. et al.(1999) Plant tagnology. Trends Plant Sci.4, 90–96
5Kugler, I. (1951) Untersuchungen über das Keimverhalten einiger Rassen von
Arabidopsis thaliana (L.) Heynh. Ein Beitrag zum Problem der Lichtkeimung.
Beitr. Biol. Pflantzen28, 211–243
6Langridge, J. and Griffing, B. (1959) A study of high temperature lesions in
Arabidopsis thaliana. Aust. J. Biol. Sci.12, 117–135
7Rédei, G.P. (1970) Arabidopsis thaliana(L.) Heynh. A review of the genetics and biology. Bibliogr. Genet.20, 1–151
8Briggs, D. and Walters, S.M. (1997) Plant Variation and Evolution, Cambridge University Press
9Pigliucci, M. (1998) Ecological and evolutionary genetics of Arabidopsis.
Trends Plant Sci.3, 485–489
10Tanksley, S.D. (1993) Mapping polygenes. Annu. Rev. Genet.27, 205–233 11Jansen, R.C. (1996) Complex plant traits: time for polygenic analysis. Trends
Plant Sci.1, 89–94
12Kearsey, M.J. and Farquar, G.L. (1998) QTL analysis in plants; where are we now? Heredity80, 137–142
13Griffing, B. and Scholl, R.L. (1991) Qualitative and quantitative genetic studies of Arabidopsis thaliana. Genetics129, 605–609
14Mitchell-Olds, T. (1995) The molecular basis of quantitative genetic variations in natural populations. Trends Ecol. Evol.10, 324–328
15Scholl, R. et al.(1994) Quantitative genetics. In Arabidopsis (Meyerowitz, E.M. and Somerville, C.R., eds), pp. 121–136, Cold Spring Harbor Laboratory Press 16Kunkel, B.N. (1996) A useful weed put to work: genetic analysis of disease
resistance in Arabidopsis thaliana. Trends Genet.12, 63–69
17Murphy, A. and Taiz, L. (1995) A new mesh transfer technique for metal-tolerance studies in Arabidopsis.Ecotypic variation and copper-sensitivity mutants. Plant Physiol.108, 29–38
19Zhang, J. and Lechowicz, M.J. (1995) Responses to CO2enrichment by two
genotypes of Arabidopsis thalianadiffering in their sensitivity to nutrient availability. Ann. Bot.75, 491–499
20Sharma, R.K. et al.(1979) Variation among races of Arabidopsis thaliana(L.) Heynh for survival in limited carbon dioxide. Theor. Appl. Genet.54, 11–15 21Koornneef, M. et al.(1998) Genetic control of flowering time in Arabidopsis.
Annu. Rev. Plant Physiol. Plant Mol. Biol.49, 345–370
22Mitchell-Olds, T. (1996) Genetic constraints on life history evolution: quantitative trait loci influencing growth and flowering in Arabidopsis thaliana. Evolution50, 140–145
23Alonso-Blanco, C. et al.(1999) Natural allelic variation at seed size loci in relation to other life history traits of Arabidopsis thaliana. Proc. Natl. Acad. Sci. U. S. A.96, 4710–4717
24Krannitz, P.G. et al.(1991) The effect of genetically based differences in seed size on seedling survival in Arabidopsis thaliana(Brassicaceae). Am. J. Bot.78, 446–450 25Candela, H. et al.(1999) Venation pattern formation in Arabidopsis thaliana
vegetative leaves. Dev. Biol.205, 205–216
26Larkin, J.C. et al.(1996) The control of trichome spacing and number in
Arabidopsis. Development122, 997–1105
27Ratcliffe, D. (1976) Germination characteristics and their inter- and intra-population variability in Arabdopsis. ArabidopsisInf. Serv.13, 34–45 28Krannitz, P.G. et al. (1991) Correction for non-linear relationships between root
size and short term Pi uptake in genotype comparisons. Plant Soil133, 157–167
29Nienhuis, J. et al.(1994) Variance for water-use efficiency among ecotypes and recombinant inbred lines of Arabidopis thaliana(Brassicaceae). Am. J. Bot.81, 943–947
30Magrath, R. et al.(1994) Genetics of aliphatic glucosinolates. I. Side chain elongation in Brassica napusand Arabidopsis thaliana. Heredity72, 290–299 31Mithen, R. et al.(1995) Genetics of aliphatic glucosinolates. III. Side chain
structure of aliphatic glucosinolates in Arabidopsis thaliana. Heredity74, 210–215 32Rashotte, A.M. et al.(1997) Epicuticular wax variation in ecotypes of
Arabidopsis thaliana. Phytochemistry45, 251–255
33Mitchell-Olds, T. and Pedersen, D. (1998) The molecular basis of quantitative genetic variation in central and secondary metabolism in Arabidopsis.
Genetics149, 739–747
34Swarup, K. et al.(1999) Natural allelic variation identifies new genes in the
Arabidopsiscircadian system. Plant J.20, 67–78
35Mitchell-Olds, T. (1995) Interval mapping of viability loci causing heterosis in
Arabidopsis. Genetics140, 1105–1109
36Lister, C. and Dean, C. (1993) Recombinant inbred lines for mapping RFLP and phenotypic markers in Arabidopsis thaliana. Plant J.4, 745–750 37Alonso-Blanco, C. et al.(1998) Development of an AFLP based linkage map
of Ler, Col and Cvi Arabidopsis thalianaecotypes and construction of a Ler/Cvi recombinant inbred line population. Plant J.14, 259–271
38Hauser, M-T. et al.(1998) Generation of co-dominant PCR-based markers by duplex analysis on high resolution gels. Plant J.16, 117–125
39Ponce, M.R. et al.(1999) High-throughput genetic mapping in Arabidopsis thaliana. Mol. Gen. Genet.261, 408–415
40Deslandes, L. et al.(1998) Genetic characterization of RRS1, a recessive locus in Arabidopsis thalianathat confers resistance to the bacterial soilborne pathogen Ralstonia solanacearum. Mol. Plant–Microbe Interact.11, 659–667 41Ton, J. et al.(1999) Identification of a locus in Arabidopsiscontrolling both the
expression of Rhizobacteria-mediated induced systemic resistance (ISR) and basal resistance against Pseudomonas syringaepv. tomato.Mol. Plant–Microbe Interact.12, 911–918
42Clarke, J.H. and Dean, C. (1994) Mapping FRI, a locus controlling flowering time and vernalization response in Arabidopsis thaliana. Mol. Gen. Genet.242, 555–564
43Koornneef, M. et al.(1994) The phenotype of some late-flowering mutants is enhanced by a locus on chromosome 5 that is not effective in the Landsberg
erectawild-type. Plant J.6, 911–919
44Lee, I. et al.(1994) The late-flowering phenotype of FRIGIDAand mutations in LUMINIDEPENDENSis suppressed in the Landsberg erectastrain of
Arabidopsis. Plant J.6, 903–909
45Grbic, V. and Bleecker, A.B. (1996) An altered bodyplan is conferred onArabidopsis
plants carrying dominant alleles of two genes. Development122, 2395–2403 46Burr, B. and Burr, F.A. (1991) Recombinant inbreds for molecular mapping in
maize. Trends Genet.7, 55–60
47Jansen, R.C. et al.(1995) Genotype by environment interaction in genetic mapping of multiple quantitative trait loci. Theor. Appl. Genet.91, 33–37 48Alonso-Blanco, C. et al.(1998) Analysis of natural allelic variation at
flowering time loci in the Landsberg erectaand Cape Verde Islands ecotypes of Arabidopsis thaliana. Genetics149, 749–764
49van der Schaar, W. et al.(1997) QTL analysis of seed dormancy in Arabidopsis
using recombinant inbred lines and MQM mapping. Heredity79, 190–200 50Tuinstra, M.R. et al.(1997) Heterogeneous inbred family (HIF) analysis: a
method for developing near-isogenic lines that differ at quantitiative trait loci.
Theor. Appl. Genet.95, 1005–1011
51Ribaut, J-M. and Hoisington, D. (1998) Marker-assisted selection: new tools and strategies. Trends Plant Sci.3, 236–239
52Hill, W.G. (1998) Selection with recurrent backcrossing to develop congenic lines for quantitative trait loci analysis. Genetics148, 1341–1352
53Eshed, Y. and Zamir, D. (1995) An introgression line population of
Lycopersicon pennelliiin the cultivated tomato enables the identification and fine mapping of yield-associated QTL. Genetics141, 1147–1162
54Ramsay, L.D. et al.(1996) The construction of a substitution library of recombinant backcross lines in Brassica oleraceafor the precision mapping of quantitative trait loci. Genome39, 558–567
55Michaels, S.D. and Amasino, R.M. (1999) FLOWERING LOCUS Cencodes a novel MADS domain protein that acts as a repressor of flowering. Plant Cell11, 949–956 56Doebley, J. et al.(1997) The evolution of apical dominance in maize. Nature
386, 485–488
57Caicedo, A.L. et al.(1999) Diversity and molecular evolution of the RPS2resistance gene in Arabidopsis thaliana. Proc. Natl. Acad. Sci. U. S. A.96, 302–306 58Sawyer, L.A. et al. (1997) Natural variation in a Drosophilaclock gene and
temperature compensation. Science278, 2117–2120
59Buell, C.R. and Somerville, S.C. (1997) Use of Arabidopsisrecombinant inbred lines reveals a monogenic and a novel digenic resistance mechanism to
Xanthomonas campestrispv. campestris. Plant J.12, 21–29
60Gómez-Gómez, L. et al. (1999) A single locus determines sensitivity to bacterial flagellin in Arabidopsis thaliana. Plant J.18, 277–284 61Mahajan, S.K. et al.(1998) Identification and characterization of a locus
(RTM1) that restricts long-distance movement of tobacco etch virus in
Arabidopsis thaliana. Plant J.14, 177–186
62Nam, J. et al. (1997) Differences in susceptibility of Arabidopsisecotypes to crown gall disease may result from a deficiency in T-DNA integration. Plant Cell9, 317–333 63Yanovsky, M.J. et al.(1997) The vlfloci, polymorphic between ecotypes
Landsberg erectaand Columbia, dissect two branches of phytochrome a signal transduction that correspond to very low fluence and high irradiance responses. Plant J.12, 659–667
64Morris, P.C. and Altmann, T. (1994) Tissue culture and transformation. In Arabidopsis (Meyerowitz, E.M. and Somerville, C.R., eds), pp. 173–222, Cold Spring Harbor Laboratory Press
65Mita, S. et al. (1997) Mutants of Arabidopsis thalianawith pleiotropic effects on the expression of the gene for b-amylase and on the accumulation of anthocyanin that are inducible by sugars. Plant J.11, 841–851
66Price, R.A. et al.(1994) Systematic relationships of Arabidopsis: a molecular and morphological perspective. In Arabidopsis (Meyerowitz, E.M. and Somerville, C.R., eds), pp. 7–19, Cold Spring Harbor Laboratory Press 67Lynch, M. and Walsh, B. (1998) Genetics and Analysis of Quantitative Traits, Sinauer
Carlos Alonso-Blanco is at the Centro Nacional de Biotecnología, Departamento de Genética Molecular de Plantas; Campus Universidad Autonoma, Cantoblanco, 28049-Madrid, Spain; Maarten Koornneef*is at the Graduate School Experimental Plant Science, Laboratory of Genetics, Wageningen University, Dreijenlaan 2, 6703 HA Wageningen, The Netherlands.
*Author for correspondence (tel 131 317 482 150; fax 131 317 483 146;
![Fig. 3. A comparison of qualitative and quantitative variation and mapping. Qualitative variation for a trait, defined by a phenotypic distribution thatCvi (Cape Verde Islands) alleles are depicted in light grey]](https://thumb-ap.123doks.com/thumbv2/123dok/1038920.929880/4.858.49.556.77.508/comparison-qualitative-quantitative-variation-qualitative-variation-phenotypic-distribution.webp)