A Professor Like Me
The Influence of Instructor Gender on College
Achievement
Florian Hoffmann
Philip Oreopoulos
a b s t r a c t
Many wonder whether teacher gender plays an important role in higher education by influencing student achievement and subject interest. The data used in this paper help identify average effects from male and female college students assigned to male or female teachers. We find instructor gender plays only a minor role in determining college student achievement. Nevertheless, the small effects provide evidence that gender role models matter to some college students. A same-sex instructor increases average grade performance by at most 5 percent of its standard deviation and decreases the likelihood of dropping a class by 1.2 percentage points.
I. Introduction
Role model effects are frequently considered key for explaining gender differences in education.1There is rich evidence within the psychology liter-ature that girls and boys respond differently to mothers and fathers (for example, Brown 1990, Brown et al. 1986), and pick different celebrities and athletes to
Florian Hoffmann Ph.D. candidate in economics at the University of Toronto. Philip Oreopoulos is a professor of economics at the University of British Columbia and a research associate at the National Bureau of Economic Research, and Canadian Institute for Advanced Research. The authors are extremely grateful to Marianne Lynham, Matthew Hendrickson, Josie Lalonde, Rick Hayward, and Karel Swift for helping them obtain and work with the data used in this project, and to Rita Ahmadyar, Nicole Corbett, and Paul Ternamian for outstanding research assistance. They also thank seminar participants at University of California, Davis, the University of Toronto, and the Canadian Institute for Advanced Research. Oreopoulos thanks the Social Sciences and Research Council and the Canadian Labour Market and Skills Researcher Network for financial support. The data used in this article can be obtained beginning October 2009 through September 2012 from Philip Oreopoulos, #997 - 1873 The East Mall, Vancouver, British Columbia, Canada V6T 1Z1 <oreo@exchange.ubc.ca>.
½Submitted June 2007; accepted April 2008
ISSN 022 166X E ISSN 1548-8004Ó2009 by the Board of Regents of the University of Wisconsin System
T H E J O U R NA L O F H U M A N R E S O U R C E S d 4 4 d 2
emulate. Male and female teachers are also potential role models. Students spend large portions of weekdays interacting with them. Perhaps not coincidently, females still constitute the majority of teachers in elementary and secondary schools during the period when girls repeat grades less than boys and form views about going to college. Conversely, male teachers, especially in college, dominate fields in mathe-matics, engineering, and sciences while male students enroll in these subjects more (Freeman 2004).
Teachers may influence students in several ways. They may respond differently depending on the gender of a student, or students may respond differently depending on the gender of a teacher. In the first case, teachers discriminate, and exhibit bias with respect to how they engage or evaluate boys and girls in the classroom. The way teachers behave interacting with boys or girls may depend on whether teachers themselves are male or female. These effects may be conscious or unconscious. In the second case, students may see teachers more as role models if they are of the same sex, and exhibit greater intellectual engagement, conduct, and interest. Students may also react to teachers when they fear being viewed through negative ‘‘stereotype threats’’—for example, when female students are reminded about a belief they are not supposed to be good at math when being taught by a male teacher. In one study (Spencer, Steele, and Quinn 1999), for example, women underperformed men on a math test when told that the test produces gender differences but did not when told the opposite. Another possibility is that male and female students respond differently to male and female teaching styles. If girls and boys respond differently to teacher behavior rather than teacher gender per se, relative differences in academic achieve-ment could still arise.
At the primary and secondary school level, a number of recent studies have esti-mated effects from being taught by a same-sex teacher, without attempting to disen-tangle why such effects exist. Results have been mixed (for example, Nixon and Robinson 1999, Ehrenberg, Goldhaber, and Brewer 1995, Dee 2007, Holmlund and Sund 2005, Carrington and Tymms 2005, 2007, Lahelma 2000, and Lavy and Schlosser 2007). Few studies have examined gender interactions at the college level. Canes and Rosen (1995) used year-to-year variation in the proportion of female fac-ulty in a department and found no correlation with year-to-year variation in the pro-portion of females majoring in related subjects. On the other hand, Neumark and Gardecki (1998) found female graduate students in faculties with more women and with female advisors do better on the job, and Rothstein (1995) found that the probability a female college student obtains an advanced degree is positively associ-ated with the percentage of faculty at her undergraduate institution who are female. As with the earlier secondary school studies, many of these results are prone to pos-sible omitted variables bias and apply only to limited cases. Bettinger and Long (2005) improved on this earlier work by using within course and student variation. They examined the impact of same-sex instructors on the choice of major and course credits and find small positive effects for females. Their data, however, did not allow them to explore interaction effects on more immediate classroom outcomes, such as class dropout and grade.
do not grade students’ exams and students do not typically receive differential treat-ment from teachers, we can more confidently equate gender interaction effects with role-model effects. In addition, by focussing on college we examine the extent to which gender role model effects exist at later ages. Many social scientists wonder whether role model effects function mostly at young ages, and whether encounters at later ages can have any significant impact on social-economic success. Lastly, our paper speaks directly to the debate about increasing female representation in male-dominated fields. There have been many widely publicized efforts by the gov-ernment, companies, and schools to increase female representation in math and sci-ence. This paper estimates the impact of male and female undergraduates’ exposure to same sex teachers and whether such exposure can affect student achievement and subject interest.
II. Data and Statistical Methodology
Our study uses detailed student and instructor administrative data from the University of Toronto’s Arts and Science Faculty. The data cover the Fall and Winter school year terms between 1996 and 2005. We focus on the 34,352 stu-dents that entered into full-time undergraduate programs from Ontario high schools, and were 17 to 20 years old on September 1 in the year of entry. We also focus on the 88 largest first year courses with at least 50 students in a class.2This sample includes 85 percent of all first-year classes. Focussing on large classes minimizes the possi-bility that results depend on small and anomalous circumstances, and helps speed statistical computation.3
We have enrolment data that include gender, date of birth, mother tongue, citizen-ship, entering program of study, and high-school grades. We also have data for reg-istration status at the start of each Fall and Winter term, the number of credits students are enrolled in, financial status with the university, cumulative and current Grade Point Average (GPA), program of study, and graduation status. Our course data contain information on courses enrolled in and credits received for each year and each course. The data distinguish between enrolment status on September 1, No-vember 1, January 1, March 1, and the most current status. An advantage of this file is that it allows us to match to classes that students enrolled in before their first day of class, regardless of whether they completed the class or not. The data also includes class information and final grade received, and is matched to instructors. We also use a number of objective and subjective teacher quality measures such as instructor rank and average evaluation score.4
2. To be clear, a course is a program of instruction in a particular subject, like economics. A class is a group of students meeting regularly to study a course under the guidance of an instructor. Instructors teach courses. Students take classes. We do not break the data into tutorial sections, taught by tutorial assistants within a class.
3. We also explored gender interaction effects for smaller classes. The small class results are generally con-sistent with our large class results, however the standard errors were higher. In most cases we cannot rule out larger effects, yet we cannot rule out no effects either.
4. See also Hoffmann and Oreopoulos (2006) for more description of related data.
We first estimate gender interactions for male and female students separately. Our initial empirical model takes on the following specification:
yikt¼bf instructorikt+di+dk+dt+uikt
ð1Þ
whereyiktis a classroom or subject-specific outcome for studentitaking coursekin
school yeart,f instructoriktis an indicator variable for whetheri’s teacher for course
k in school yeartis female,di;dk, anddt are fixed effects for student, course, and
year respectively, anduikt is the error term.bmeasures the average effect from
as-signment to a female versus male instructor, and captures both a gender interaction effect and an instructor quality effect (if males and females teach differently). The difference between thebcoefficient for the female sample compared to male sample is the relative gender difference predicted from assignment to a female versus male instructor.
To explore the importance of unobserved student and teacher characteristics, we replace student fixed effects with individual controls. We also explore the sensitivity of these estimates when including female indicators instead of fixed effects, and time-of-day controls. Remaining potential selection biases are mitigated by focusing on large courses with multiple classes where the final instructor allocation is not in-dicated in course calendars, and by focusing on first year students that have limited flexibility in choosing courses. We also explore (and find similar) results from using courses with only one instructor per year. This further removes students’ ability to target particular courses.
Our data also allow for class fixed effects using the following specification: yic¼df studenticf instructoric+ukg+di+dc+uic
ð2Þ
where yic is a classroom or subject-specific outcome for student i in class c,
f studenticis an indicator variable for whether a student is female,di, anddcare fixed
effects for student and class respectively, andukg are course by gender fixed effects.
These last controls allow gender differences in performance that are not attributable to teacher differences to vary across subjects courses. These are necessary to account for the possibility that the courses in which males and females tend to perform dif-ferently are also the courses in which instructors tend to be more likely male or more likely female.5The coefficientdreflects the average outcome gain for females, rel-ative to males, from assignment to a female versus male instructor or, conversely, the average outcome loss for males, relative to females, from assignment to a female ver-sus male instructor.
Focusing on first-year students helps minimize gender-based course selection for two reasons. First-year students cannot easily identify instructors, and especially gender of instructors, prior to enrollment. Course calendars at the University of
5. An example might be women’s studies, where female students are more likely to complete the course and female instructors are more likely to teach the course. Another example is sociology, with more female students going on to major in sociology and more female sociology instructors. In both cases, restricting the estimation model to include course fixed effects only (and not course-by-gender fixed effects) biases the gender interaction results upwards. Indeed, when we use only course fixed effects with our baseline sample, our estimated gender interaction effects are larger.
Toronto usually do not indicate the instructor teaching the class, and when they do, only first initials are included. Second, first year students are inexperienced about teacher allocation mechanisms of the university and cannot rely either on their own or on peer groups’ past experience. We also restrict our sample to full year and first semester courses. Dropping courses taken in the second semester further minimizes opportunities for selecting courses by instructor. Students are matched to classes chosen before the first week of school. For purposes of comparison, we also include in the appendix separate and pooled results using second year classes. The possibility of selecting classes based on instructor is greater in second year, but the variety of courses and instructors teaching them is greater.
For our main sample, we tested for evidence of gender-specific selection by regressing the fraction of female students in a class on whether an instructor was female, conditioning on course or course-by-year fixed effects. There was no signifi-cant relationship.6The proportion of females in a class was consistently uncorrelated with the gender of the instructor under all specifications we tried. In addition, we esti-mated Equation 2 with a student’s high school grade as the outcome variable, and with-out student fixed effects. As expected in the absence of gender specific sorting, we found no relative differences in high school grades between males and females within classrooms.7 We use three student outcome variables at the student by course level: Whether students dropped the course (‘‘Dropped Course’’), the grade received for students that completed the course (‘‘Grade’’), and the number of additional courses students take in the same subject in all subsequent years (‘‘Subject Course, Subsequent Years’’).8‘‘Dropped Course’’ is a binary variable. ‘‘Grade’’ and ‘‘Subject Course, Sub-sequent Years’’ are standardized for each course to have mean zero and standard deviation one.
Table 1 presents summary descriptive statistics for the sample of entering first year full time students between 1996 and 2004. The main dataset has one observation per student-class. Each student takes an average 4.2 half and full-year classes. After restricting the sample to large full year and first semester classes, and dropping clas-ses co-taught by male and female instructors, the average number of clasclas-ses per stu-dent in our sample is 2.6. Sixty percent of first-year stustu-dents are female. Fourteen percent of them take classes in math (usually calculus) compared to 17 percent of males. Sixteen percent of females take classes in chemistry and physics, compared to 15 percent of males. Notably, substantially fewer females compared to males take classes in business, economics, and computer science, but more take classes in psy-chology and sociology. Twenty-three percent of first-year instructors are female (24 percent, on average, per course). There are 1,450 classes within 88 courses over this
6. The coefficient from regressing the fraction of female students in a first year classroom on whether an instructor was female, with course and year fixed effects is 0.004, with a standard error of 0.006. Results were similar when using course by year fixed effects or adding instructor and student background character-istics as controls.
7. The coefficient from regressing high school grade average (in a student’s last year) on the interaction between being a female student and attending class with a female instructor, with female student, course-by-female-student, and classroom fixed effects is 0.03 percent, with a standard error of 0.16. 8. The results using subsequent credits received in the same subject in all subsequent years are virtually the same as the results using subsequent courses. The difference between the two outcomes is that to receive a credit requires both taking a course and passing it.
Table 1
Descriptive Statistics
Full Sample Female Male
Variable Mean SD Sample Size Mean SD Sample Size Mean SD Sample Size
Panel A: First-year students
High school grade 85.2 5.8 34,061 85.5 5.6 20,714 84.6 6.0 13,347 Dropped course 0.112 0.316 98,861 0.110 0.313 58,592 0.115 0.319 40,269 Grade 68.9 14.0 87,775 68.8 13.3 52,121 68.9 15.0 35,654 Subject courses, subsequent years 1.443 2.916 98,861 1.370 2.814 58,592 1.550 3.055 40,269 Female Teacher 0.246 0.431 574 0.248 0.432 569 0.241 0.428 568
Panel B: Second-year students
High school grade 85.5 5.7 24,734 85.8 5.5 15,027 85.1 5.9 9,707 Dropped course 0.119 0.324 56,744 0.115 0.319 33,751 0.126 0.332 22,993 Grade 70.4 12.6 49,966 70.6 12.0 29,873 70.1 13.4 20,093 Subject courses, subsequent years 2.371 3.128 56,744 2.376 3.059 33,751 2.364 3.225 22,993 Female teacher 0.24 0.43 577 0.24 0.43 574 0.24 0.43 575
484
The
Journal
of
Human
nine-year period, with 16.8 classes on average per course, and 2.4 classes on average per course in each year. The table indicates that course dropout and performance does not differ noticeably by gender across first year courses. Second year statistics are presented for comparison. By second year, female students are slightly less likely to drop courses, have higher average grades, and acquire less course credits than their male fellow students.
III. Results
Table 2 presents estimates of Equation 1 separately for male and fe-male students. In the first two columns we regress student achievement on whether an instructor is female, controlling for course and school year. For females, we esti-mate no significant difference in the likelihood of dropping a class based on whether the instructor is male or female. Males, on the other hand, are about 1.8 percentage points more likely to drop a course when beginning a course with a female instructor. The difference between the female and male student effects is the predictedrelative effect between gender groups from facing a female instead of male instructor.9Thus, our results point towards male students negatively reacting to female teachers rather than female students positively reacting to female teachers. This result is consistent with Dee (2007). The second set of columns shows results from including student controls for students’ last year of high school average grade, program of study, and age, and the third set of columns shows results from including student fixed effects across courses. Neither of these alternative specifications alters the point esti-mates by very much.
Without conditioning for student background, males perform slightly better, on av-erage, with male instructors. The estimated relative gain to male students from as-signment to a male instructor is about 5 percent of a standard deviation, without student controls. This translates into a 0.6 percentage point increase in expected grade (out of 100 percent). When student controls or fixed effects are added, the es-timated effect falls further, and we cannot reject that the eses-timated effect is zero. The relative effect falls and becomes statistically insignificant when student fixed effects are added, in part because the estimated effect from females with a female instructor is slightly negative.
Table 3 presents estimates of Equation 2 after pooling males and females in the same regression. All regression use course-by-gender fixed effects instead of course fixed effects. Column 1 shows the coefficient estimates of the female-student-female-instructor interaction when student background controls are included. They show the expected change in average achievement for femalesrelativeto males from assign-ment to a female instructor. This can also be interpreted as the expected relative loss
9. To test if the gender difference is significant, we pooled male and female students together while allow-ing for gender-specific coefficients on each coefficient. The table shows the coefficient estimate for the student-instructor gender interaction, interacted with a female dummy variable. This coefficient is the same as the difference between the female and male gender interaction coefficients estimated separately by gen-der. Standard errors are clustered by class.
Table 2
Estimated Effect Of Female Instructor Assignment, By Gender
Female Male Difference Female Male Difference Female Male Difference
Dropped course 0.002 0.018 20.016 0.001 0.015 20.014 20.01 0.01 20.017 [0.008] [0.008]** [0.008]** [0.008] [0.008]* [0.008]* [0.006] [0.007] [0.008]** Standardized 20.03 20.076 0.047 20.009 20.035 0.026 20.02 20.002 20.014
grade [0.027] [0.030]** [0.028]* [0.025] [0.024] [0.024] [0.016] [0.016] [0.018] Standardized number of subject
courses in subsequent years
20.01 20.046 0.036 20.008 20.041 0.033 20.02 20.039 0.019 [0.018] [0.020]** [0.022]* [0.018] [0.020]** [0.022] [0.018] [0.019]** [0.023]
Course FE Yes Yes Yes
Student FE No No Yes
Student controls No Yes No
Notes: Each cell reports the coefficient of the student-teacher gender interaction from a separate linear probability regression. The standardized grade and number of subject courses in subsequent years variables have mean zero and standard deviation one. Regressions without individual FE include fixed effects for academic year. Student controls are gender, high school grade average and fixed effects for age. One, two, and three asterisks indicate statistical significance at the 10, 5, and 1 percent levels respectively. The male and female full sample sizes are 40,249 and 58,562 respectively. The male and female grade sample sizes are 35,654 and 52,121 respectively.
486
The
Journal
of
Human
Table 3
Estimated Effects on Student Performance from Same-Sex Instructor Assignment: Full Sample and by Background Characteristics
Dropped Course Standardized Grade
Standardized Number of Same-Subject Courses Taken in Later Years
(1) (2) (3) (4) (5) (6) (7) (8) (9) (10) (11) (12)
Model 1
Same-sex 20.015 20.017 20.01 20.011 0.023 20.014 0.038 0.001 0.034 0.019 0.034 0.02
[0.008]* [0.008]** [0.008] [0.007] [0.024] [0.018] [0.023]* [0.017] [0.022] [0.023] [0.022] [0.023]
Model 2
Same-sex 20.014 20.015 20.009 20.011 0.033 20.002 0.044 0.014 0.038 20.002 0.044 0.015
[0.010] [0.010] [0.010] [0.010] [0.033] [0.021] [0.031] [0.020] [0.028] [0.029] [0.027] [0.029] Same-sex 20.002 20.003 20.002 20.002 20.015 20.02 20.009 20.023 20.008 0.029 20.016 0.004
*English mother tongue [0.010] [0.009] [0.010] [0.010] [0.031] [0.021] [0.029] [0.021] [0.028] [0.028] [0.028] [0.028]
Model3
Same-sex 20.009 20.012 20.025 20.015 0.056 20.007 0.071 0.036 0.059 0.059 0.065 0.03
[0.010] [0.009] [0.011]** [0.011] [0.038] [0.028] [0.035]** [0.026] [0.027]** [0.029]** [0.033]** [0.037] Same-sex 20.011 20.011 0.027 0.005 20.062 20.014 20.06 20.071 20.048 20.08 20.055 20.022
*
Math or science course [0.015] [0.011] [0.016]* [0.015] [0.051] [0.035] [0.047] [0.033]** [0.034] [0.033]** [0.044] [0.050]
Model4
Same-sex 20.016 20.018 20.008 20.011 0.007 20.028 0.025 20.013 0.068 0.053 0.067 0.054
[0.009]* [0.008]** [0.009] [0.008] [0.024] [0.017] [0.025] [0.018] [0.028]** [0.030]* [0.029]** [0.030]*
Same-sex 0.002 0.003 20.005 20.002 0.036 0.032 0.029 0.027 20.071 20.072 20.069 20.077
*Below high school median grade [0.008] [0.007] [0.008] [0.007] [0.029] [0.019] [0.028] [0.019] [0.038]* [0.040]* [0.039]* [0.041]*
Course FE Yes Yes No No Yes Yes No No Yes Yes No No
Student FE No Yes No Yes No Yes No Yes No Yes No Yes
Classroom FE No No Yes Yes No No Yes Yes No No Yes Yes
Student controls Yes No Yes No Yes No Yes No Yes No Yes No
Notes: Each model reports the coefficients of the student-teacher gender interaction from a separate regression. Model 2 allows for an additional interaction same-sex and English as mother tongue (versus not). Model 3 includes an additional interaction for same-sex in Mathematics and Science courses versus other courses. Model 4 includes an interaction between same-sex and having a high school grade average below the entry median, versus above the median. All regressions include course-by-gender fixed effects. Student controls are high school grade average and fixed effects for academic year, age, mother tongue, and program enrolled. One, two, and three asterisks in-dicate statistical significance at the10, 5, and 1 percent levels respectively.
Hof
fmann
and
Oreopoulos
in average male achievement from assignment to a female instructor. The coefficient in Column 2 for the full sample is the same one listed in Column 9 of Table 2 from including student fixed effects instead of student controls.
Pooling males and females together allows for the inclusion of class fixed effects. With class fixed effects and student controls in Column 3, females are about one per-centage point less likely than males in the same class to drop a course in a class with a female instructor. Conversely, males are one percentage point less likely than females to drop a class if the instructor is male. The estimate is about the same when including both class and student fixed effects. Thus, adding class fixed effects causes the coefficient to fall by about one-third. Thep-values fall from about 4 percent to 12 percent.
Turning to grade outcomes, with class fixed effects and student controls, the aver-age difference between female and male performance is 3.8 percent of a standard deviation higher (0.4 percentage points) with a female instructor. With both class and student fixed effects, the estimated effect is zero. On the other hand, the relative differences in male and female likelihood of taking related courses in subsequent years appear generally unaffected by whether a female or male teaches a first-year class.
The remaining rows present the results when we interact our same-sex indicator with indicator variables for subpopulations characterized by mother tongue, subject the students are majoring in, and high school grades. The point estimates provide some evidence that the estimated same-sex instructor effects are larger for social sci-ence courses than for math and scisci-ence courses. Furthermore, the gender interaction effects on taking subsequent courses in the same subject are larger among the stu-dents with high school grade averages above the median.10
IV. Sample Selection for Grade Outcomes
Estimation of gender-interaction effects in college on grades is pos-sible only for the sample of students that write the final exam. Tables 2 and 3 suggest that the propensity to drop a course is significantly affected by gender interactions. This creates a sample selection problem, formally described by the following set of equations:
10. The results in Table 3 are from regressions run separately for each type of triple interaction. When add-ing the triple interactions all together, the standard errors are a little higher. We also estimated the model for each sub-population separately, with very similar results, except that in some specifications they are mar-ginally significant when looking at the population of students with English as the mother-tongue.
Gradekc¼1½Dropoutkc$0 Gradekc:
ð5Þ
Equations 3 and 4 replicate Equation 2 for ‘‘Grade’’ and ‘‘Dropped Course’’ as outcome variable, while Equation 5 accounts for the potential selection bias. OLS-estimates of the parameter of interest,dgrade, is biased ifddroppedis different from zero. Our earlier analysis indicates that female students are indeed less likely to drop a course, relative to male students, when the class is taught by a female teacher (and vice versa).
Correcting for sample selection is difficult in our case since any variable affecting dropout behavior arguably also affects potential grades. Without exclusion restric-tions, identification in a standard Heckman-selection model is solely based on the non-linearity of the correction term. Instead of relying on this source of variation we estimate upper bounds ofdgrade using a procedure similar to the ones described by Krueger and Whitmore (2002) and Lee (2005).
In general, OLS-estimates are downward biased if relatively more students stay to complete a course when the instructor is of the same sex, and if these marginal students are from the left tail of the grade distribution. We can therefore estimate an upper bound of dgrade when applying OLS to a sample without the
(ddropped*100) percent worst female students (relative to males) from female-taught classes.
We therefore apply the following procedure: In the first step we estimate drop-out equations following the same specifications as in Table 2. This provides us with an estimate ofddropped, the female-male student difference in dropout
behav-ior when taught by a female teacher. We then calculate the (ddropped*100) percen-tile of the female-grade distribution for every class taught by a female teacher and drop all female students with a final grade lower than this percentile. Since we are focusing on selection due to therelativedifference from having a female versus a male instructor between female and male students we do not need to trim marginal male students. In the second step we use this restricted sample to estimate the same equation as in the first step, but with final grade replacing the dropout vari-able.11
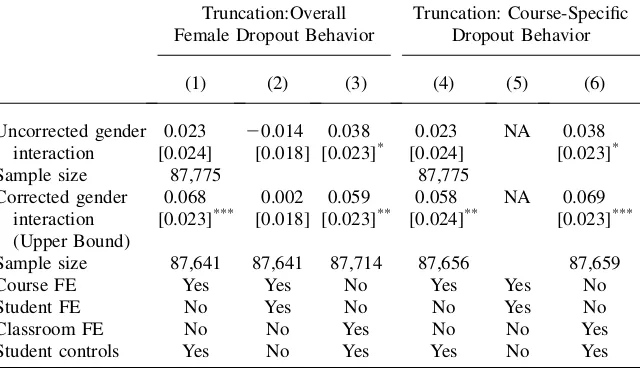
The first set of columns in Table 4 presents these results. The upper bound ef-fect on relative grade performance by gender is about 5 to 7 percent of a standard deviation. Thus, if same-sex instructors increase course completion for students at the bottom of the class, accounting for this selection leads to a small, but no lon-ger insignificant gender interaction effect on grades. Expected grades may in-crease by up to 0.6 to 0.8 percentage points from being matched to a same-sex instructor.
11. We also tried using non-parametric bounds suggested by Angristet al.(2006). We first computed the average dropout rates for females and males separately, but only for courses taught by female teachers (for the same reason as explained in the text). With a fractionuFof female students and a fractionuMof male students dropping from female-taught courses we drop theuM2uFworst male students from the distribu-tion of male students in female-taught classes. We then ran our regressions on the remaining sample, yield-ing the upper bound estimates. The results were very similar to those presented here. This is not surprisyield-ing since the procedure used in this paper corrects the difference ofuM2uFwithin female-taught classes by including various sets of fixed effects in our first-stage regression.
In the second set of columns in Table 5, we repeat the same selection analysis, but from estimating the first-stage regression for each course separately. This yields course-specific estimates of (ddropped*100), which are then used to trim the female-taught grade distributions within the same course. Since every student is allowed to take every course only once, a specification including individual fixed effects is not identified in this case. Table 5 reveals that the upper bound effect on grade per-formance is similar: assignment to a same sex instructor, leaving out students that finished the course because of same-sex assignment, increases relative grade per-formance by about 5 percent of a standard deviation (0.6 percentage points). These results suggest that, under conservative estimates that account for course completion effects, assignment to a same-sex instructor improves expected grade performance, but not by an amount that would substantially impact a student’s GPA.
Table 4
Effects on Grade Performance from Same-Sex Instructor Assignment with Correction for Sample-Selection
Truncation:Overall Female Dropout Behavior
Truncation: Course-Specific Dropout Behavior
(1) (2) (3) (4) (5) (6)
Uncorrected gender 0.023 20.014 0.038 0.023 NA 0.038 interaction [0.024] [0.018] [0.023]* [0.024] [0.023]*
Sample size 87,775 87,775
Corrected gender 0.068 0.002 0.059 0.058 NA 0.069 interaction [0.023]*** [0.018] [0.023]** [0.024]** [0.023]*** (Upper Bound)
Sample size 87,641 87,641 87,714 87,656 87,659
Course FE Yes Yes No Yes Yes No
Student FE No Yes No No Yes No
Classroom FE No No Yes No No Yes
Student controls Yes No Yes Yes No Yes
Notes: The table shows uncorrected and sample-selection corrected estimates for the gender interaction when grade is used as outcome variable. We first estimate the gender-interaction in dropout-regressions (not shown in table). The estimate provides us with the x-percentage difference of the propensity to drop the course between female and male students when taught by a female teacher. We calculate x-percentage quintiles of the female grade distribution in female taught classes and drop all female students with grades below this quintile. Our upper-bound estimates come from regressions on the restricted sample. The first three rows show estimates when we trim the overall female grade distribution in female-taught classes. The last three rows repeat the analysis when we trim course-specific distributions instead. In this case, the specification with individual fixed effects is not identified. Each cell reports the coefficient of the student-teacher gender interaction from a separate linear probability regression. All regressions include course-by-gender fixed effects. Student controls are high school grade average and fixed effects for aca-demic year, age, mother tongue, and program enrolled. One, two, and three asterisks indicate statistical sig-nificance at the 10, 5, and 1 percent levels respectively.
V. Conclusion
In this paper, we address the importance of gender interactions be-tween teachers and students at the college level to explain educational performance and subject interest. Using within class variation for students taking multiple courses, we find that students react marginally to an instructor’s gender. Students taught by a same-sex instructor are about one percentage point less likely to drop a course (a 10 percent change from the mean). Relative grade performance is about 1 to 5 percent of a standard deviation better for students with a same-sex instructor. The small effects appear driven more by males performing worse when assigned to a female instructor, with females performing about the same. They also appear more due to social science courses than math or physical science courses. Students with English as their mother tongue and taking social science courses are some-what more likely to take subsequent courses in related subjects taught by a same-sex instructor.
Our grade score estimates are generally smaller than the 5 to 10 percent standard deviation effects reported by Dee (2007) at the primary school level (using similar methodology), but not by much. Two possibilities may explain the difference. First, same-sex instructors may matter more at earlier ages, when development of cognitive and non-cognitive ability occurs more rapidly. Second, reactions from students over the gender of a teacher may matter less than reactions from teachers over the gender of a student. College instructors do not typically interact on a one-on-one basis with students in large first year classes and do not typically grade tests, so there is less chance for instructor bias to influence performance. Our results are also not likely due to students being reminded of particular stereotypes about themselves due to in-structor gender, since there are many students of both sexes in the large classes we examine. Gender interactions at the college level are most likely due to role model effects. Another result that matches some of Dee’s findings is that our gender inter-actions stem more from male students performing worse with female instructors, while female performance appears unaffected.
We interpret these findings to suggest instructor gender plays only a minor role in determining college student achievement.12Nevertheless, on the criteria that influ-encing achievement is difficult, some may still find our small effects from manipu-lating only instructor gender impressive.13 Instructor gender appears to affect the behavior of at least some students, especially with respect to course completion. It should also be noted that all the estimates in this paper relate to cases where one in-structor is replaced at the margin for another who differs by gender. There may exist additional nonlinear effects from more dramatic changes in the proportion of male or female faculty in a department or institution.
12. The results are consistent with our earlier research½Hoffmann and Oreopoulos, 2006, which finds that observable instructor characteristics, such as rank, experience, and salary, do not explain large differences in student performance. Subjective instructor quality, however, does predict these differences, although overall instructor effects are small. Hard-to-measure instructor qualities may matter more in predicting achievement, even for instructors that exhibit the same age, salary, rank, and gender.
13. Prentice and Miller (1992) discuss various methods for interpreting small effects.
Table A1
Estimated Effects on Student Performance From Same-Sex Instructor Assignment by Background Characteristics, Second Year Students
Dropped Course Grade Subject Courses Subsequent Years
(1) (2) (3) N (1) (2) (3) N (4) (5) (6) N
Model1
Same-sex 20.011 20.001 20.007 56,744 0.007 0.054 20.013 49,966 0.048 20.011 0.022 56,688
[0.009] [0.010] [0.009] [0.032] [0.026]** [0.032] [0.032] [0.033] [0.033]
Model2
Same-sex 20.006 0.005 20.003 37,778 20.002 0.051 20.015 33,867 0.012 20.032 20.002 37,759
[0.013] [0.014] [0.013] [0.039] [0.032] [0.038] [0.042] [0.040] [0.041] same-sex 20.006 20.009 20.006 18,966 0.012 0.005 0.004 16,099 0.045 0.038 0.041 18,929
*English mother tongue) [0.011] [0.012] [0.011] [0.036] [0.028] [0.036] [0.035] [0.030] [0.036]
Model3
Same-sex 20.007 0.003 20.007 8,221 0.002 0.043 20.01 7,202 0.027 20.013 0.019 8,221
[0.010] [0.010] [0.010] [0.033] [0.026] [0.032] [0.036] [0.034] [0.035]
Same-Sex 20.069 20.067 20.006 48,523 0.084 0.203 20.039 42,764 0.298 0.126 0.093 48,467
*Math or science course [0.023]*** [0.032]** [0.027] [0.073] [0.070]*** [0.145] [0.069]*** [0.088] [0.096]
Model4
Same-sex 0 0.008 0.005 29,317 0.02 0.045 20.008 25,336 0.026 20.014 0.004 29,287
[0.011] [0.011] [0.011] [0.034] [0.028]* [0.034] [0.037] [0.037] [0.036]
Same-sex 20.02 20.018 20.023 27,427 20.026 0.018 20.009 24,630 0.033 0.016 0.041 27,401
*below high school median grade [0.010]** [0.010]* [0.010]** [0.028] [0.025] [0.028] [0.028] [0.030] [0.028]
Course FE Yes Yes No Yes Yes No Yes Yes No
Student FE No Yes No No Yes No No Yes No
Classroom FE No No Yes No No Yes No No Yes
Student controls Yes No Yes Yes No Yes Yes No Yes
Notes: Each model reports the coefficients of the student-teacher gender interaction from a separate regression. Model 2 allows for an additional interaction same-sex and English as mother tongue (versus not). Model 3 includes an additional interaction for same-sex in mathematics and science courses versus other courses. Model 4 includes an interaction between same-sex and having a high school grade average below the entry median, versus above the median. All regressions include course-by-gender fixed effects. Student controls are high school grade average and fixed effects for academic year, age, mother tongue, and program enrolled. One, two, and three asterisks in-dicate statistical significance at the 10, 5, and 1 percent levels respectively. N inin-dicates the sample size used in the regression.
492
The
Journal
of
Human
Table A2
Estimated Effects on Student Performance from Same-Sex Instructor Assignment by Background Characteristics, First-and Second-Year Students
Dropped Course Grade Subject Courses Subsequent Years
(1) (2) (3) N (1) (2) (3) N (4) (5) (6) N
Model1
Same-sex 20.014 20.01 20.009 155,555 0.016 20.003 0.022 137,741 0.035 0.029 0.03 155,555
[0.006]** [0.006] [0.006] [0.019] [0.015] [0.019] [0.019]* [0.019] [0.019]
Model2
Same-sex 20.012 20.007 20.007 103,897 0.023 0.008 0.027 93,242 0.022 20.012 0.02 103,897
[0.008] [0.008] [0.008] [0.026] [0.020] [0.025] [0.024] [0.024] [0.023] Same-sex 20.003 20.004 20.004 51,658 20.011 20.016 20.008 44,499 0.006 0.044 0.004 51,658
*English Mother Tongue [0.008] [0.007] [0.008] [0.025] [0.019] [0.024] [0.023] [0.023]* [0.024]
Model3
Same-sex 20.005 20.001 20.016 34,749 0.024 20.008 0.03 31,118 0.022 0.025 0.025 34,749
[0.008] [0.007] [0.007]** [0.025] [0.020] [0.025] [0.023] [0.023] [0.024]
Same-sex 20.024 20.026 0.017 120,806 20.023 0.014 20.021 106,623 0.011 20.022 20.007 120,806
*Math or science course [0.014]* [0.011]** [0.014] [0.041] [0.029] [0.039] [0.035] [0.034] [0.037]
Model4
Same-sex 20.012 20.009 20.005 79,208 0.005 20.012 0.01 68,901 0.04 0.032 0.035 79,208
[0.007] [0.007] [0.007] [0.020] [0.015] [0.021] [0.023]* [0.024] [0.023]
Same-sex 20.004 20.001 20.009 76,347 0.022 0.018 0.025 68,840 20.027 20.03 20.025 76,347
*below high school median grade [0.006] [0.006] [0.006] [0.021] [0.016] [0.020] [0.027] [0.031] [0.027]
Course FE Yes Yes No Yes Yes No Yes Yes No
Student FE No Yes No No Yes No No Yes No
Classroom FE No No Yes No No Yes No No Yes
Student controls Yes No Yes Yes No Yes Yes No Yes
Notes: Each model reports the coefficients of the student-teacher gender interaction from a separate regression. Model 2 allows for an additional interaction same-sex and English as mother tongue (versus not). Model 3 includes an additional interaction for same-sex in mathematics and science courses versus other courses. Model 4 includes an interaction between same-sex and having a high school grade average below the entry median, versus above the median. All regressions include course-by-gender fixed effects. Student controls are high school grade average and fixed effects for academic year, age, mother tongue, and program enrolled. One, two, and three asterisks in-dicate statistical significance at the 10, 5, and 1 percent levels respectively. N inin-dicates the sample size used in the regression.
Hof
fmann
and
Oreopoulos
References
Angrist, Joshua, Eric Bettinger, and Michael Kremer. 2006. ‘‘Long-Term Educational Consequences of Secondary School Vouchers: Evidence from Administrative Records in Colombia.’’American Economic Review96(3):847-62.
Bettinger, Eric, and Bridget T. Long. 2005. ‘‘Do Faculty Serve as Role Models? The Impact of Instructor Gender on Female Students.’’American Economic Review95(3):152-57.
Canes, Brandice, and Harvey Rosen. 1995. ‘‘Following in Her Footsteps? Faculty Gender Composition and Women’s Choices of College Majors.’’Industrial & Labor Relations Review48(3):486-504. Carrington, B., P. Tymms, and C. Merrell. 2008. ‘‘Role Models, School Improvement and the ‘‘gender
gap’’—Do Men Bring Out The Best In Boys And Women The Best In Girls?’’British Educational Research Journal, Forthcoming.
DiPrete, Thomas A., and Claudia Buchmann. 2006. ‘‘Gender-Specific Trends in the Value of Education and the Emerging Gender Gap in College Completion.’’Demography43(1):1-24.
Dee, Thomas. S. 2004. ‘‘Teachers, Race, and Student Achievement in a Randomized Experiment.’’The Review of Economics & Statistics86(1):195-210.
Dee, Thomas S. 2005. ‘‘A Teacher Like Me: Does Race, Ethnicity or Gender Matter?’’American Economic Review95(2):158-65.
__________. 2007. ‘‘Teachers and the Gender Gaps in Student Achievement,’’Journal of Human Resources, 42(3): 528-544.
Ehrenberg, Ronald G., Daniel D. Goldhaber, and Dominic J. Brewer. 1995. ‘‘Do Teachers’ Race, Gender, and Ethnicity Matter? Evidence from the National Education Longitudinal Study of 1988.’’Industrial and Labor Relations Review48(3):547-61.
Freeman, Catherine E. 2004. ‘‘Trends in Educational Equity of Girls & Women: 2004’’ National Center for Education Statistics Working Paper # 2005–016, U.S. Department of Education, National Center for Education Statistics. Washington, DC: GPO.
Hoffmann, Florian, and Oreopoulos, Philip. 2008. ‘‘Professor Qualities and Student Achievement.’’
Review of Economics and Statistics.Forthcoming.
Holmlund, Helena, and Krister Sund. 2005. ‘‘Is the Gender Gap in School Performance Affected by the Sex of the Teacher?’’ Swedish Institute for Social Research, Stockholm University Working Paper No. 5, 2005.
Jacobs, Jerry A. 1996. ‘‘Gender Inequality and Higher Education.’’Annual Review of Sociology 22:153-85.
Krueger, Alan, and Dianne Whitmore. 2002. ‘‘Would Smaller Classes Help Close the Black-White Achievement Gap?’’ InBridging the Achievement Gap, ed. John E. Chubb and Tom Loveless. Washington, D.C.: Brookings Institute Press.
Lahelma, E. 2000. ‘‘Lack of Male Teachers: A Problem for Students or Teachers?’’Pedagogy, Culture and Society8(2):173-85.
Lavy, Victor. 2004. ‘‘Do Gender Stereotypes Reduce Girls’ Human Capital Outcomes? Evidence from a Natural Experiment.’’ NBER Working Paper No. 10678.
Lavy, Victor, and Analia Schlosser. 2007. ‘‘Mechanisms and Impacts of Gender Peer Effects at School,’’ NBER Working Paper No. 13292.
Lee, David. 2005. ‘‘Training, Wages, and Sample Selection: Estimating Sharp Bounds on Treatment Effects,’’ NBER Working Paper #11721.
Neumark, David, and Rosella Gardecki. 1998. ‘‘Women Helping Women? Role Model and Mentoring Effects on Female Ph.D. Students in Economics.’’Journal of Human Resources33(1):220-46.
Nixon, Lucia A., and Michael D. Robinson. 1999. ‘‘The Educational Attainment of Young Women: Role Model Effects of Female High School Faculty.’’Demography36(2):185-94.
Prentice, Deborah A., and Dale T. Miller. 1992. ‘‘When Small Effects Are Impressive.’’Psychological Bulletin112(1):160-64.
Rothstein, Donna S. 1995. ‘‘Do Female Faculty Influence Female Students’ Educational and Labor Market Attainments?’’Industrial and Labor Relations Review48(3):515-30.
Spencer, S. J., C. M. Steele, and D. M. Quinn, D. M. 1999. ‘‘Stereotype Threat and Women’s Math Performance,’’Journal of Experimental Social Psychology35(1):4-28.