R
E
-A
SSESSING
C
ASUAL
E
MPLOYMENT
IN
A
USTRALIA
IANWATSON∗
T
he increased number of casuals in the Australian workforce has generated consid-erable concern about a proliferation of inferior jobs in the labour market. Critics of casualisation have pointed to poor outcomes associated with casual work: job insecurity, lack of training and career paths, marginalisation in the workplace and so forth. Those who defend casualisation argue that non-standard employment provides greater choice within the labour market, and that casual employees are no less dissatisfied with their jobs than permanent employees. In this paper, I re-assess this debate by examining a recent analysis of job satisfaction among casual employees by Wooden and Warren in 2004. I argue that findings of contentment among casual employees are subject to both methodological and philosophical weaknesses. In place of subjective measures of job satisfaction, I argue that the quality of jobs should be directly assessed by objective criteria like remuneration. Following this, I fit earnings equations to the HILDA data and find that part-time casual employees earn only a modest premium over permanent full-time employees. When the loadings, which casuals are paid, are taken into account, I find that part-time casual employees are actually penalised by virtue of working as casuals. I conclude that casual jobs are inferior jobs, irrespective of the satisfaction levels of their incumbents.INTRODUCTION
Over the last 20 years, the presence of casuals in the Australian workforce has been increasing steadily, with dramatic changes evident during the 1990s. Between 1990 and 2000, casual density overall rose from 19% to 27%, while among the full-time workforce it doubled from 6% to 12% (Campbell & Burgess 2001: 103). Although the presence of casuals has always been a feature of the employment landscape in industries like retail and hospitality, their increased presence in industries like manufacturing, communications and finance and insurance has been a notable development during the last 20 years. Between 1985 and 2002, the proportion of casuals in manufacturing doubled, while in communications and finance and
insurance, the proportion more than trebled (Watsonet al.2003: 69).
At least two responses to these developments have emerged. On the one hand, the critics of casualisation are concerned that these trends erode labour market
∗
ACIRRT, University of Sydney, Sydney, NSW 2006, Australia. Email: i.watson@econ.usyd.edu.au This paper has benefited considerably from the comments of John Buchanan, Alison Preston, Iain Campbell, Jan O’Leary and Humphrey McQueen. Useful feedback was also provided by my colleagues as ACIRRT and the participants at the RMIT Centre for Applied Social Research Workshop on ‘The Quality of Part-time Work’ held in July 2004.
standards. In their view, casualisation means a growth in the proportion of inferior jobs in the labour market. Research has shown that casual jobs are associated with low levels of training, poor career opportunities and adverse occupational health
and safety outcomes (e.g. ACIRRT 1999; Hallet al.2000; Campbell 2001).
More-over, casuals themselves appear to be particularly disadvantaged. In the labour market, they are more likely to have experienced ‘job churning’, where people cy-cle in and out of work without finding a long-term secure job (ABS 1997; Burgess
& Campbell 1998a).1 In the workplace, they can find themselves marginalised,
particularly when it comes to workplace decision-making and access to career
paths (Pococket al.2004). As Hallet al.(1998: 77) concluded:
contingent work (particularly casual part-time work) continues to be characterised by low pay, limited control and discretion, relative exclusion from workplace decision-making, a lack of task diversity and a high level of dissatisfaction with the amount of work provided by employers.
For critics like Burgess and Campbell (1998b), Campbell and Brosnan (1999)
and Watsonet al.(2003), it is the precarious nature of casual employment which
is most distinctive: the concern that casual jobs do not measure up well on many of the dimensions of security, which Guy Standing argued constitute decent work
(Standing 2002). Similarly, Pocock et al.(2004) are concerned that the lack of
rights for casual workers means they do not enjoy full workplace ‘citizenship’. Not only do the critics of casualisation emphasise these shortcomings, but they also point with alarm to the growth of casualisation among the full-time work-force, and its increasing spread into industry sectors not traditionally associated
with casual work, such as manufacturing (Watsonet al.1999). Their concern is
not just with the increased numbers of casuals at work, but with the process of casualisation, particularly the conversion of existing non-casual jobs into casual jobs. This is linked with other changes in the way labour is deployed, such as the spread of outsourcing and the recruitment of workers through labour-hire firms. In discussing the process of casualisation, Buchanan (2004: 4) argued:
Australian casualisation does not necessarily entail cuts in wages or the universal im-position of crude forms of hours flexibility. It is, however, integral to a new approach to managing labour that boosts labour productivity by pushing many of the costs and risks of employment onto workers.
For critics like Buchanan, it is not simply a matter of whether casual workers are treated fairly or not, or whether they feel satisfied with their employment situation. Rather, it is the proliferation of inferior jobs which is at stake, and the erosion of labour market standards which is accelerated by this process of casualisation.
However, the defenders of casualisation take a different view. They contest the uniformly gloomy picture which the critics paint, arguing, for example, that:
with their jobs are those in part-time jobs, and it appears to matter little whether these workers were hired on a permanent, casual or fixed-term basis. (Wooden 2001a: 65)
Evidence for this view can be found in the Australian Workplace Industrial Relations Survey (AWIRS; Hall & Harley 2000; Wooden 2001a). Although these data have not overturned all of the negative aspects attached to casual employment, they have allowed researchers to assess many of the more subjective aspects of work, aspects which have been largely apprehended in the past through qualitative methods. The defenders of casualisation have come to rely heavily on these more subjective aspects of work, particularly measures of job satisfaction.
Despite some recognition of the negative aspects of casual employment, the defenders of casualisation argue that it represents greater choice within the labour market. They point to the large numbers of married women and students found among the part-time casual workforce as evidence that casual work provides a desirable form of employment for those seeking to balance work and non-work activities. From this point of view, the needs of both employers and workers for flexibility come together in the shape of casual jobs. Summing up his AWIRS findings on non-standard employment, Wooden concluded:
. . .the increased diversity in working arrangements associated with the shift away from the standard working time model has facilitated a better matching of worker preferences to the preferences of employers. (Wooden 2001a).
Despite its usefulness for exploring non-standard employment (Hallet al.1998;
Hall & Harley 2000; Wooden 2001a), the AWIRS data has become somewhat dated and it has now been replaced by the Household, Income and Labour Dy-namics in Australia (HILDA) survey as the main source for analysing workplace aspects of non-standard employment. Drawing on this source, Wooden returned to the defence of casual employment. In an important article, Wooden and Warren (2004) presented a comprehensive picture of casual and fixed-term employment in Australia and explored in some depth the issue of job satisfaction. They found that it was mostly male full-time casuals—who constituted just 4% of employees— who were most dissatisfied with their jobs. They concluded with sentiments which echoed Wooden’s earlier appraisal:
. . .the evidence presented in this analysis suggests that it is extremely misleading to characterise non-standard jobs as substandard jobs. It thus follows that initiatives intended to inhibit the diversity of employment options that are available to employers will often not result in changes in working arrangements that will be unambiguously preferred by employees. (Wooden & Warren 2004: 295)
those workers whose sentiments around job satisfaction overall are positive. This is not a particularly surprising result and is evident in Wooden and Warren’s own analysis of this survey item.
The core of my argument, therefore, lies elsewhere. I argue that measuring job satisfaction is an inadequate way to analyse casualisation, and that there are a range of methodological and philosophical reasons for not pursuing this strategy. Instead, I argue for the analysis of the objective conditions of casual employment, specifically remuneration. It is more fruitful to directly confront the question of whether casual jobs are inferior jobs by asking if casuals are paid adequately for their labour. I pursue this strategy by fitting earnings equations to the HILDA data and testing whether the earnings of casual workers—particularly the part-time casuals—are better or worse than full-part-time permanent workers, once a range of workplace and individual characteristics have been controlled for. The results from these equations suggest that casual workers are worse off and that their jobs are indeed inferior jobs when it comes to earnings.
DATA AND DEFINITIONS
For the analysis in this paper, I draw upon the unit record files from the HILDA survey, a national survey carried out by the Melbourne Institute on behalf of the
Federal Department of Family and Community Services.2HILDA is a
household-based panel survey whose first wave commenced in 2001 and which provides data on 13 969 individuals. The households for this survey were selected using
a complex sampling design, involving both stratification and clustering.3 The
great advantages of HILDA for labour market researchers are that it provides longitudinal panel data for a large representative sample of Australian households, and that it offers a rich collection of individual and labour market variables.
Recent debates in Australia about the classification of casuals have raised a number of questions:
1. Should casuals be defined by an absence of leave entitlements, or according to self-identification? (see, in particular, Murtough & Waite 2000)
2. Are estimates for the numbers of casuals in Australia inflated by the presence of owner-managers of incorporated enterprises, and are they deflated by the absence of dependent-contractors, sometimes called the ‘fake self-employed’? (see Campbell & Burgess 2001: 90)
3. How should workers on fixed-term contracts be categorised?
4. Should short-term casuals be distinguished from long-term casuals? (e.g. Owens 2001)
The exchange between Campbell and Burgess (2001) and Murtough and Waite (2001) ranged across these issues, and one clear point of agreement which emerged was that owner-managers of incorporated enterprises should be excluded from the
category of casuals.4Fortunately, the questions in HILDA allow one to distinguish
these ‘employees’ from the remaining employees, and this makes it feasible to exclude them from the category of casuals.
among permanent employees (because of their leave entitlements), but who have no expectation of ongoing employment. Although the definitional debate over self-identification is far from settled (Campbell & Burgess 2001), the practical consequences of this for data modelling are probably quite limited. As Wooden and Warren (2004: 282) showed, ‘access to leave entitlements is highly correlated with self-reported casual employment status’. The importance of distinguishing between permanent (or ongoing) employment, casual employment and
fixed-term contract employment has been evident in recent research (Hallet al.1998;
Hall & Harley 2000; Wooden 2001a). Therefore, in the following analysis I fol-low Wooden in employing the self-reported ‘contract of employment’ approach. Finally, the hours dimension to casual employment is critical, because differ-ences between part-time casuals and full-time casuals are evident in much of the research.
CONTENTED WORKERS?
According to Wooden and Warren (2003: 26) behind trade union campaigns to regulate casual work lies the questionable assumption that ‘casual employment and other types of non-standard employment necessarily involve inferior types of employment’. In order to test this supposed linkage between job quality and casual employment status, Wooden and Warren (2004) developed an analysis based on workers’ self-reported job satisfaction. They argued that it was too difficult to directly measure the quality of casual jobs because: first, there are a great many dimensions to jobs that contribute to overall worker well-being; and second, there is likely to be great variation across individual workers in the weight assigned to different jobs attributes (Wooden & Warren 2004: 282–3).
Their analysis relied, therefore, on subjective measures of job satisfaction, rather than the objective characteristics of jobs. Their multivariate analysis of HILDA data found that fixed-term employees were the most satisfied with their jobs, while casuals were the least satisfied. This was particularly so for men, and for those employed through labour-hire agencies. For women, the results were not statistically significant.
Although gender mattered, hours of work mattered even more. In a second specification (in which casual status was interacted with hours of work), Wooden and Warren found that ‘the negative associations between casual employment and job satisfaction are entirely restricted to those working 35 hours or more’ (2004: 293). In other words, the part-time casuals were not less satisfied than permanent employees; it was only the full-time casuals—particularly the men—who were more dissatisfied. In addition, the negative effects associated with employment through labour-hire agencies for men became a positive effect.
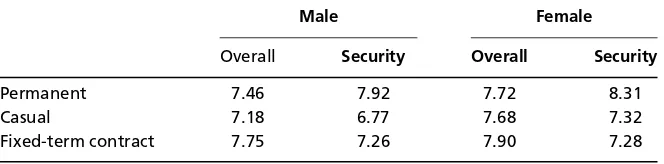
Table 1 Overall job satisfaction and satisfaction with job security, mean scores (0–10 scale)
Male Female
Overall Security Overall Security
Permanent 7.46 7.92 7.72 8.31
Casual 7.18 6.77 7.68 7.32
Fixed-term contract 7.75 7.26 7.90 7.28
Source:Wooden and Warren (2004: 284).
Although Wooden and Warren considered a range of satisfaction items in their univariate analysis—pay, job security, the work itself, the hours worked, job flexibility and overall job satisfaction—they chose only the last item for their multivariate analysis. However, it could be argued that casual workers may indicate that they are generally satisfied with their jobs, but this does not mean they are
satisfied with the fact that their jobs are casual (e.g. Pocock et al. 2004). It is
notable that the item which comes closest to measuring this aspect of their work— the question on job security—scores much lower among casual workers, both male and female, in the univariate analysis conducted by Wooden and Warren. Table 1
presents an excerpt from this analysis.5
In developing their model for job satisfaction Wooden and Warren followed the approach developed by Clark (1996; 1997), citing his comment that ‘job sat-isfaction may be as close as we are likely to come to a proxy measure of utility at work’ (Wooden & Warren 2004: 283). They also acknowledged Clark’s insights into the importance of expectations determining satisfaction, and they included a variable which measured the importance of paid work in the lives of their respon-dents. As they argued:
. . .those who expect less from their jobs would, for any given job, be more satisfied. . . If [non-standard] employment has traditionally been linked to relatively lowly-paid, unskilled jobs, then it seems reasonable to believe that workers who accept such jobs will not have high expectations of those jobs. (Wooden and Warren 2004: 289)
objectively changed between these two episodes in the day. Although this ex-perience does not eliminate episodes of absolute satisfaction, where the rewards from the work itself engender ‘well-being’, it does emphasise the significance of ‘positional satisfaction’.
The methodological implications of this are quite important. In the absence of knowledge of the context in which respondents assess their job satisfaction, how do we know if questionnaire items are tapping into ‘absolute satisfaction’ or ‘po-sitional satisfaction’? It is dilemmas like these which have led some sociologists to emphasise qualitative methodologies, such as in-depth semistructured interviews, as the most appropriate vehicle for gauging attitudes (e.g., the discussion of the ‘paradox of context’ in Watson 1994: 25–6).
Context matters not only in the expression of attitudes, but also in their forma-tion. It is well known that working time preferences are often interdependent— shaped by the exigencies of family life, for example—rather than the pure expression of a solitary individual. Similarly, young people’s predilections are often formed within the context of peer group activities and discussions. Clearly, both the expression and the formation of sentiments about workplace experiences will be strongly shaped by the social context in which individuals live and work. In picking a number to indicate their level of job satisfaction in a questionnaire, individuals are trying to summarise complex sentiments. For one worker: at this stage in my life, with my family commitments and my new mortgage, this job is
OK, but. . .While for another: among my network of friends, my job stacks up
pretty good and so on. The comparisons are also internal: better this job than
being unemployed, like I was this time last year. . .
Clark did not engage with the issue of context. However, he did discuss the objection that ‘the use of job satisfaction responses as measures of individual well-being is subjective and hence cannot be compared across individuals’ (1996: 193). He resolved this concern with the argument that behavioural outcomes, such as job quits, are highly correlated with satisfaction scores.
It may well be the case that there is some consistency in how individuals answer across a range of job satisfaction items, and it may be the case that individual behavioural outcomes correspond with levels of self-reported satisfaction as mea-sured in questionnaires. However, even if the methodological reservations around context could be assuaged, there remains an important philosophical problem in equating job satisfaction with job quality.
The key philosophical issue can be summed up in the distinction between the
job structure and the incumbents of that structure.6The incumbents may well be
satisfied with their jobs as individuals, but this does not mean that the job structure is composed of quality jobs. Within neoclassical economics this distinction is often ignored. The preoccupation with the Benthamite notion of utility erases the relevance of social structures, that is to say, the importance of supraindividual entities such as job structures. This is because all that matters for Benthamites is the summation of individual utilities to arrive at an aggregate measure of utility. In Bentham’s words:
then is, what?—the sum of the interests of the several members who compose it. (cited in Keen 2001: 26)
However, as a social structure, the job structure both predates the incumbents and survives after their departure. Like natural ecosystems, such structures are vulnerable to deterioration by the present incumbents whose indifference to those who follow them may induce short-sighted and self-interested activities. In the case of the job structure, present incumbents may trade away some of the core conditions of those jobs for the sake of immediate gain. Enterprise bargaining in Australia has witnessed this phenomenon (ACIRRT 1999). In the case of casual jobs, the key issue is not the contemporary contentment or otherwise of these incumbents, but the prospects for decent employment for tomorrow’s workers. If casual jobs are indeed inferior jobs—the argument I pursue in the next section— then their proliferation has serious implications for the overall integrity of the job structure. It is something of an irony that the defenders of casualisation emphasise ‘choice’, and see a variety of employment modes as equivalent to greater choice. Yet, a deterioration in the job structure means limited choices for society’s future workforce, in the same way that a poisoned biosphere limits the options for future
generations.7
INFERIOR JOBS?
Premium or penalty?
There are many aspects to the quality of employment, but only a handful is
ob-jectively measurable.8Sometimes this is because the aspect is difficult to quantify,
but more often because good data are not available. For example, of the many career-related aspects to casual employment, only access to training is regularly collected through the ABS 4-yearly surveys of training and education. Analysis of this data certainly suggests that casuals fare poorly when it comes to training out-comes. The scope for pursuing this line of analysis in HILDA is limited because
no training data was collected before Wave 3.9The data available with HILDA,
which is most unambiguous when it comes to assessing the objective quality of
casual jobs, is earnings data, specifically, hourly rates of pay.10The earnings data
from the first wave of HILDA has already been analysed by Rodgers (2002) who looked at the wages gap between full-time and part-time employees. In this section I also use the earnings data from the first wave of HILDA and I fit cross-sectional regression models to these data.
Wooden and Warren (2003: 12) argued that ‘it cannot be concluded that casual employees are necessarily poorly paid, especially given they tend be relatively less educated and skilled than other groups of workers’. However, by estimating their earnings and controlling for these characteristics (as well as others), one can indeed establish if they are poorly paid, relative to permanent full-time workers. In this section of the paper I follow this strategy, fitting multivariate regression models to the hourly rates of pay for employees in the HILDA data. The earnings equation fitted to the data takes the following form:
Table 2 Wage premiums and penalties for categories of employee (percentages)
Females Male
1 2 3†
Permanent: working less than 35 hours 4 3 1
Permanent: working 35–40 hours (reference) 1 −8 −8
Permanent: working 49 hours or more −6 −10 −9
Casual: working less than 35 hours 10 7 4
Casual: working 35–40 hours 2 0 0
Casual: working 41–48 hours 7 −6 −5
Casual: working 49 hours or more −4 1 −3
Fixed term: working less than 35 hours 1 1 0
Fixed term: working 35–40 hours 2 −5 −5
Fixed term: working 41–48 hours 3 −12 −11
Fixed term: working 49 hours or more −5 −13 −14
†Based on Heckman procedure.Note:Numbers 1, 2 and 3 refer to the models from which these figures
are derived. See Appendix 1. These percentages have been derived from the model coefficients using the formula 100(eγ−1) .
Source:HILDA Wave 1. Population: employees.
whereyjtakes the form of the natural log of hourly earnings for thejth individual,
αis the constant, xj is a vector of workplace and individual characteristics11for
thejth individual, empj(status and form of employment) captures the casual and
hours status of thejth individual, andεjis the usual error term. The casual and
hours status dummy variables follow the same (interacted) form used by Wooden
and Warren (2004). Interest centres on theγ for the part-time casual category,
because these are the casual jobs which predominate in the labour market. As we have seen, it is also the incumbents of part-time casual jobs who fare no worse than full-time permanent workers when it comes to job satisfaction. In essence, the earnings equations seek to determine if the wages of part-time casuals are better or worse than those of permanent workers on standard hours, the benchmark category. ‘Better’ or ‘worse’ can be expressed in terms of a wages ‘premium’ or ‘penalty’, which each category of employee earns relative to the benchmark category.
of pay, but derived rates of pay, based on the actual hours of work undertaken. Consequently, long hours of work which are formally unpaid have the effect of reducing the derived hourly rate of pay. In practice this means that the hourly rates for managers and professionals are likely to be understated in the data, as these occupational groups are more likely to work extended (unpaid) hours. Although this may bias downwards the estimates for fixed-term contractors—who are more likely to be drawn from the ranks of professionals—it should have little effect on the estimates for casuals. Although there are a considerable number of professionals among those casuals working in industries like education and health, the majority of casuals are working in sales, clerical and labouring occupations.
Although the regression results are likely to be accurate for male workers, there is a possibility that the results for female workers are less accurate due to selectivity bias. This arises because the wages of some women workers go unobserved because they were not working, and hence not earning, at the time of the survey. If participation in the labour force were purely random, this would not be a problem. In reality, participation is far from random, particularly for women with children. Women earning lower wages are more likely to be absent from the labour market, because the relative cost of using paid child care is much higher for them than for their better-paid counterparts. As a consequence, the sample of observed wages for women may be biased upwards (e.g. Gronau 1974). To resolve this problem I have followed the Heckman procedure of fitting a two-stage model, in which participation in the labour force is modelled first as a selection equation, and then the results of this are incorporated into the wages equation (Wooldridge 2002; Stata 2003a, volume 2: 64). As before, the earnings equation takes the form:
yj =α+xjβ+empjγ +ε1j (2)
However, as just noted, the dependent variable is not always observed. It will
be observed for thejth observation if
zjθ +ε2j >0 (3)
wherezis a vector of characteristics thought to influence women’s labour force
participation (e.g. age, education, marital status and number of children). Again,
the interest centres on theγ for part-time casuals in the earnings Equation (2),
though the results from both the earnings equation and the selection equation are shown together as model 3 in Appendix 1. The premium and penalty percentages for casuals from this modelling are shown in the last column in Table 2. These findings suggest that the initial regression results overestimated the extent of the part-time casual premium for women. Instead of the 7% advantage found in model 2, the results for the Heckman regression suggest a figure of 4%.
Effect of loadings
The vast majority of casuals are paid a loading in lieu of sick leave and holiday leave, to which they are generally not entitled. This loading can vary anywhere
between 15 and 331/
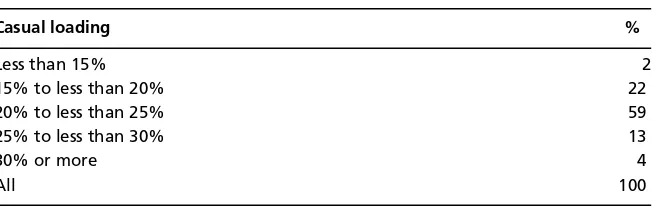
Table 3 Average casual loadings for enterprise agreements, Australia, 1994–2002
Casual loading %
Less than 15% 2
15% to less than 20% 22
20% to less than 25% 59
25% to less than 30% 13
30% or more 4
All 100
Source:Unpublished data from ACIRRT’s ADAM database. Population: all agreements with casual load-ings, 1994–2002 (n=2632).
Table 4 Typical casual loadings for awards, federal and state
Award %
Retail Distribution Centres (SDA Award 1995) 331/3
Retail Industry Minimum Wage Order (Victoria 1997) 25
Bi Lo Pty Ltd (Retail Award 2002) 22
Shop Employees (NSW State Award 2004) 15
Nationwide Venue Management (Employees Award 1999) 25
Restaurants and Employees (NSW State Award 2003) 20
Clerical & Administrative Employees (NSW State Award 2004) 20
Source: Federal and Victorian from wagenet.gov.au and NSW from Awards Online (www. industrialrelations.nsw.gov.au).
in ACIRRT’s ADAM database over the period 1994–2002 was approximately 21%. The range of these loadings is summarised in Table 3 and this shows that nearly three-quarters of these agreements had loadings in the range of 20–29%. In the award stream, casual loadings are upwards of 15% and in many cases 20%, with some typical loadings shown in Table 4. An audit of 50 awards by the Commonwealth Government found that 47 allowed for casual employment, and all but two of these provided pay loadings, typically approximately 20% (cited in Wooden 2001b: 877).
On the basis of casual loadings in both awards and agreements, one should expect in these earnings equations a premium of between 15% and 20% for part-time casual employees if they were being paid commensurate with comparable workers in permanent full-time positions. Instead, we find a wages premium of only 10% for men, and either 7% or 4% (Heckman) for women. If we wish to compare them with permanent part-time workers, on the grounds that this is a more relevant comparison, we find a wages premium of 5% for men, and either
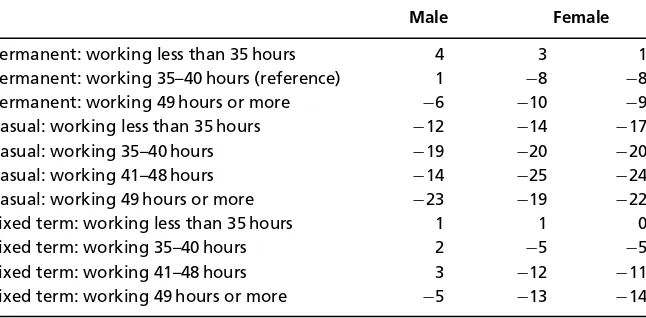
Table 5 Wage premiums and penalties for categories of employee where hourly earn-ings are discounted before modelling (percentages)
Male Female
Permanent: working less than 35 hours 4 3 1
Permanent: working 35–40 hours (reference) 1 −8 −8
Permanent: working 49 hours or more −6 −10 −9
Casual: working less than 35 hours −12 −14 −17
Casual: working 35–40 hours −19 −20 −20
Casual: working 41–48 hours −14 −25 −24
Casual: working 49 hours or more −23 −19 −22
Fixed term: working less than 35 hours 1 1 0
Fixed term: working 35–40 hours 2 −5 −5
Fixed term: working 41–48 hours 3 −12 −11
Fixed term: working 49 hours or more −5 −13 −14
Notes:Models follow same specifications as models 1, 2 and 3, but results not included (available from the author). Hourly earnings are discounted by 20% for casual employees. Second column for females based on Heckman procedure.
Source:HILDA Wave 1. Population: employees.
Is it possible to quantify this earnings deficit, the actual penalty which casu-als experience when we take loadings into account? In her analysis of low-paid workers, Dunlop (2000) adopted a strategy of discounting the earning of casual workers to take account of their loadings. I follow a similar strategy and discount the hourly rates of casuals by 20% in the data, and then re-estimate the earnings equations. The key results of this modelling are shown in Table 5 and show that male part-time casuals experience an earnings penalty of 12%, while females expe-rience a penalty of 14% (or 17% if the Heckman estimation procedure is adopted)
(the full results are shown as models 4, 5 and 6 in Appendix 1).13
CONCLUSION
As the modelling in this paper has shown, male part-time casuals earn a mod-est premium of approximately 10%, while female part-time casuals earn an even more modest premium of approximately 4%. If we take into account the loadings which casuals are paid, then both men and women are penalised by virtue of their employment status, with women worse off. The men are penalised by approxi-mately 12%; the women by approxiapproxi-mately 17%. In summary, from the point of view of earnings, part-time casual jobs appear to be inferior jobs.
To reconcile the contentment of casual workers with their location within inferior jobs requires much more incisive research into the construction of worker
subjectivity, a task that will need to move beyond simply looking at expectations.14
Such an agenda is more likely to bear fruit through in-depth qualitative research, rather than through attitudinal items in quantitative surveys. The field of life history and work history analysis (Bertaux 1981; Plummer 1983) is well suited to this agenda, and the work of sociologists like Connell (1991) has shown just how insightful this approach can be.
As for progress on the objective measures of job quality, the best prospects lie within surveys like HILDA through the inclusion of career-related items, items dealing with occupational health and safety, and items dealing with workplace decision-making. Although HILDA does contain some useful objective workplace items (such as promotions and supervisory status), the lack of career items remains a major shortcoming. Although the wish list for HILDA no doubt continues to grow, more objective workplace items would be a valuable addition to a rich data source.
ENDNOTES
1. Though research also suggests that for some unemployed workers, casual jobs can assist in gaining permanent employment (Gaston & Timcke, 1999; Chalmers & Kalb, 2000). 2. For details, see www.melbourneinstitute.com/hilda and Watson and Wooden (2002). 3. These sample design aspects of HILDA need to be taken into account when analysing the data
since they impact on the size of the standard errors. Fortunately, the HILDA dataset provides identifiers for this sample design allowing the design effect to be corrected for. The regression models in this paper were estimated using Stata’s survey regression estimators, procedures, which take account of the design effect. See Stata (2003b).
4. Wooden and Hawke (1998: 102) had earlier highlighted the likely bias in the ABS estimates for casuals due to the inclusion of owner-managers. They also pointed to a similar problem result-ing from the ‘cashresult-ing-in’ of leave entitlements by permanent employees as part of enterprise bargaining.
5. As noted, these results are for the univariate analysis. A model with the same specifications as the Wooden and Warren model was run against the same data using ‘satisfaction with job security’ as the dependent variable and it showed that satisfaction with job security was negative among both casual and fixed-term contractors, and among both part-time and full-time workers. Moreover, both female casuals and male casuals scored poorly when job security was the dependent variable. Results of this modelling are available from the author. 6. For the importance of this distinction in understanding the wages structure, see Galbraith
(1998) and for its relevance in understanding labour market segments, see Freedman (1976). 7. Problems with choice are already apparent for today’s workers. According to key informants
in Western Sydney, the situation already exists where unemployed blue-collar workers find that the only choice they have for gaining employment is through labour-hire recruitment. 8. For example, the ‘Quality of Work Life’ index developed by Considine and Callus (2002)
from a survey of employees, incorporated a range of workplace aspects which are objective in character, but which were assessed on a subjective basis (i.e. employee satisfaction with pay, job security, health and safety standards and so forth).
9. Training data was collected in Wave 3, but this only became available after the analysis in this article was completed. The earlier waves did contain an item in the self-completion survey, which asked if respondents were required to learn new skills in their jobs.
10. Hourly rates of pay is a derived variable, and there are some measurement problems here with the HILDA data, but they are minor. A number of observations had extreme values for hourly earnings as a result of a problem in the conduct of the survey (which is likely to be corrected in future waves). These observations have been recoded to more realistic values using imputation methods based on regression predictions. Details of this are available from the author. 11. The full list of variables entered into the model are listed in Appendix 1, and summary statistics
12. Results for earnings regression when permanent part time is the omitted category. Results not shown but available from the author.
13. John Buchanan (pers. comm.) points out that the issues of over-award payments and job clas-sifications have not been incorporated into this analysis. Although the range of workplace controls used in the modelling is quite extensive (see Appendix 1), it has not been possible to control for the impact of over-award payments on the hourly rates variable, nor to control for the level of job classification (though supervisory positions are included in the controls). Research suggests that casuals have less access to over-award payments and that they occupy lower job classifications within the broader occupational groupings (Hallet al.2000; Pocock et al.2004). This suggests that to be consistent with this discounting approach, the hourly rates for some permanent employees should also be reduced to take account of these factors. The size of such a discount is, however, very difficult to estimate, as is the scope of its application to the workforce. Nevertheless, its impact is likely to moderate the size of the wages penalty reported for this analysis.
14. Iain Campbell’s suggestion that cognitive dissonance should be explored in certainly one avenue worth exploring. (Suggestion made at the RMIT ‘Quality of Part-time Work’ workshop held in July 2004.)
REFERENCES
ABS (1997)Australia’s Employment and Unemployment Patterns 1994–1996. Cat. No. 6286.0. Can-berra: Australian Bureau of Statistics.
ACIRRT (1999)Australia at Work: Just Managing. Sydney: Prentice Hall.
Bertaux D (1981)Biography and Society, The Life History Approach in the Social Sciences. Sage Studies in International Sociology 23. Beverly Hills, CA: Sage Publications.
Buchanan J (2004)Paradoxes of Significance: Australian Casualisation and Labour Productivity. Working Paper No. 93. Sydney: ACIRRT, University of Sydney.
Burgess J, Campbell I (1998a) Casual employment in Australia: Growth characteristics, a bridge or a trap?The Economic and Labour Relations Review9: 31–54.
Burgess J, Campbell I (1998b) The nature and dimensions of precarious employment in Australia. Labour and Industry8: 5–22.
Campbell I (2001) Casual employees and the training deficit: Exploring employer calculations and choices.International Journal of Employment Studies9: 61–101.
Campbell I, Brosnan P (1999) Labour market deregulation in Australia: The slow combustion approach to workplace change.International Review of Applied Economics13: 353–94.
Campbell I, Burgess J (2001) A new estimate of casual employment?Australian Bulletin of Labour 27: 6–29.
Chalmers J, Kalb G (2000)The Transition from Unemployment to Work: Are Casual Jobs a Short Cut to Permanent Employment?Discussion Paper No. 109. Sydney: Social Policy Research Centre, University of New South Wales.
Clark AE (1996) Job satisfaction in Britain.British Journal of Industrial Relations34: 189–217. Clark AE (1997) Job satisfaction and gender: Why are women so happy at work?Labour Economics
4: 341–72.
Connell RW (1991) Live fast and die young: The construction of masculinity among young working-class men on the margin of the labour market.Australian and New Zealand Journal of Sociology 27: 141–71.
Considine G, Callus R (2002)The Quality of Work Life of Australian Employees—The Development of an Index. Working Paper No. 73. Sydney: ACIRRT, University of Sydney.
Dunlop Y (2000) Labour Market Outcomes of Low Paid Adult Workers. Occasional Paper (6293.0.00.005). Canberra: Australian Bureau of Statistics.
Freedman M (1976)Labor Markets: Segments and Shelters. Montclair, NJ: Allanhled, Osmun and Co. Publishers.
Galbraith JK (1998)Created Unequal: The Crisis in American Pay. Chicago: University of Chicago Press.
Gaston N, Timcke D (1999) Do casual workers find permanent full-time employment? Evidence from the Australian youth survey.The Economic Record75: 333–47.
Hall R, Bretherton T, Buchanan J (2000)‘It’s Not My Problem’: The Growth of Non-standard Work and Its Impact on Vocational Education and Training in Australia. Leabrook, SA: National Centre for Vocational Education Research.
Hall R, Harley B (2000) The location and characteristics of fixed-term and casual female workers in Australia: Analysis of AWIRS95.Australian Bulletin of Labour26: 18–37.
Hall R, Harley B, Whitehouse G (1998) Contingent work and gender in Australia: Evidence from the 1995 Australian Workplace Industrial Relations Survey.The Economic and Labour Relations Review9: 55–81.
Keen S (2001)Debunking Economics: The Naked Emperor of the Social Sciences. Annandale: Pluto Press. Murtough G, Waite M (2000)The Growth of Non-traditional Employment: Are Jobs Becoming More
Precarious. Productivity Commission Staff Research Paper, AusInfo.
Murtough G, Waite M (2001) A new estimate of casual employment?: Reply.Australian Bulletin of Labour27: 109–17.
Owens RJ (2001) The ‘long-term or permanent casual’—An oxymoron or a ‘well enough understood Australianism’ in the law?Australian Bulletin of Labour27: 118–36.
Plummer K (1983)Documents of Life: An Introduction to the Problems and Literature of a Humanistic Method. London: G. Allen & Unwin.
Pocock B, Prosser R, Bridge K (2004)‘Only A Casual. . .’: How Casual Work Affects Employees, House-holds and Communities in Australia. Labour Studies Report. Adelaide, SA: University of Adelaide. Rodgers JR (2002) Hourly wages of full-time and part-time employees in Australia.Australian
Journal of Labour Economics7: 231–54.
Standing G (2002)Beyond the New Paternalism: Basic Security as Equality. London: Verso. Stata (2003a)Stata Base Reference Manual. Texas: Stata Press (release 8th edn). Stata (2003b)Stata Survey Data Reference Manual. Texas: Stata Press (release 8th edn).
Watson I (1994) Class memory: An alternative approach to class identity.Labour History67: 23–41. Watson I, Briggs C, Buchanan J, Kinnear P (1999) New standards for new times: Regulating
non-standard employment in manufacturing. A report for the AMWU.
Watson I, Buchanan J, Campbell I, Briggs C (2003)Fragmented Futures: New Challenges in Working Life. Sydney: Federation Press.
Watson N, Wooden M (2002)The Household, Income and Labour Dynamics in Australia (HILDA) Sur-vey: Wave 1 Survey Methodology. HILDA Project Technical Paper Series No. 1/02. Melbourne: Melbourne Institute of Applied Economics and Social Research, University of Melbourne. Wooden M (2001a) Are non-standard jobs sub-standard jobs?Australian Social Monitor3: 65–70. Wooden M (2001b) How temporary are Australia’s casual jobs.Work, Employment & Society15:
875–83.
Wooden M, Hawke A (1998) Factors associated with casual employment: Evidence from AWIRS. Economic and Labour Relations Review9: 82–107.
Wooden M, Warren D (2003)The Characteristics of Casual and Fixed Term Employment: Evidence from the HILDA Survey. Working Paper No. 15/03. Melbourne: Melbourne Institute of Applied Economics and Social Research, University of Melbourne.
Wooden M, Warren D (2004) Non-standard employment and job satisfaction: Evidence from the HILDA survey.Journal of Industrial Relations46: 275–97.
APPENDIX1
EARNINGS EQUATIONS(DEPENDENT VARIABLE:LOG OF HOURLY EARNINGS)
(Model number) Population
(1) Males (2) Females (3) Females†
Earnings equations
Employment status interacted with hours (control=permanent working 35–40 hours)
Permanent: less than 35 hours 0.043 0.029 0.012
(0.043) (0.016) (0.016)
Permanent: 41–48 hours 0.009 −0.083∗ ∗ ∗
−0.079∗ ∗ ∗
(0.016) (0.018) (0.018)
Permanent: 49 hours or more −0.067∗ ∗ ∗
−0.101∗ ∗ ∗
−0.099∗ ∗ ∗
(0.019) (0.024) (0.024)
Casual: Less than 35 hours 0.093∗ ∗ ∗ 0.068∗ ∗ ∗ 0.041∗
(0.025) (0.020) (0.020)
Casual: 35–40 hours 0.016 0.003 0.000
(0.031) (0.030) (0.030)
Casual: 41–48 hours 0.069 −0.061 −0.049
(0.047) (0.046) (0.044)
Casual: 49 hours or more −0.041 0.009 −0.029
(0.053) (0.128) (0.121)
Fixed term: less than 35 hours 0.007 0.010 0.002
(0.069) (0.029) (0.029)
Fixed term: 35–40 hours 0.019 −0.047 −0.046
(0.033) (0.026) (0.026)
Fixed term: 41–48 hours 0.032 −0.124∗ ∗ −0.117∗
(0.037) (0.044) (0.046)
Fixed term: 49 hours or more −0.050 −0.134∗ −0.148∗
(0.041) (0.060) (0.061)
Employed through agency 0.079∗ 0.038 0.022
(0.039) (0.042) (0.040)
Age 0.031∗ ∗ ∗ 0
.025∗ ∗ ∗ 0 .022∗ ∗ ∗
(0.004) (0.003) (0.003)
Age squared (div by 100) −0.034∗ ∗ ∗ −0.030∗ ∗ ∗ −0.030∗ ∗ ∗
(0.005) (0.004) (0.004)
Location (control=metropolitan)
Inner regional −0.033∗ −0.034∗ −0.031∗
(0.015) (0.013) (0.013)
Outer regional −0.059∗ ∗
−0.028 −0.027
(0.022) (0.017) (0.018)
Remote 0.118∗ ∗
−0.011 −0.001
(0.042) (0.023) (0.025)
APPENDIX1 (Continued)
(Model number) Population
(1) Males (2) Females (3) Females†
Education (control=year 11 or less)
Degree or above 0.224∗ ∗ ∗
0.160∗ ∗ ∗
0.310∗ ∗ ∗
(0.025) (0.022) (0.026)
Diploma 0.107∗ ∗ ∗ 0.059∗ ∗ 0.168∗ ∗ ∗
(0.026) (0.021) (0.023)
Certificate 0.031 0.002 0.085∗ ∗ ∗
(0.017) (0.016) (0.018)
Completed year 12 0.089∗ ∗ ∗ 0
.044∗ 0 .127∗ ∗ ∗
(0.022) (0.019) (0.022)
Unknown 0.041 0.039 0.119∗ ∗ ∗
(0.043) (0.027) (0.029) Studying at school −0.228∗ ∗ ∗ −0.301∗ ∗ ∗ −0.272∗ ∗ ∗
(0.043) (0.034) (0.033) Tertiary or other post-school study −0.069∗ ∗ ∗
−0.012 −0.009 (0.017) (0.016) (0.016)
Union member 0.022 0.019 0.022
(0.014) (0.014) (0.014)
Supervisor 0.055∗ ∗ ∗ 0.028∗ ∗ 0.027∗ ∗
(0.014) (0.011) (0.010) Work schedule (control=regular day or evening)
Night 0.023 0.074 0.062
(0.046) (0.042) (0.041)
Rotating 0.115∗ ∗ ∗ 0.029 0.025
(0.022) (0.018) (0.018)
Split −0.010 0.003 0.022
(0.041) (0.031) (0.032)
On call 0.086 −0.005 −0.000
(0.045) (0.038) (0.035)
Irregular 0.036 −0.007 −0.018
(0.024) (0.021) (0.020) Firm size (control=5000 employees or more)
Less than 20 employees −0.142∗ ∗ ∗ −0.099∗ ∗ ∗ −0.094∗ ∗ ∗
(0.022) (0.017) (0.016) 20–99 employees −0.095∗ ∗ ∗ −0.067∗ ∗ ∗ −0.062∗ ∗ ∗
(0.020) (0.016) (0.015)
100–499 employees −0.023 −0.013 −0.013
(0.023) (0.020) (0.020)
500–999 employees −0.002 −0.022 −0.026
(0.025) (0.022) (0.022)
1000–4999 employees 0.027 −0.021 −0.021
(0.021) (0.020) (0.020)
APPENDIX1 (Continued)
(Model number) Population
(1) Males (2) Females (3) Females†
Firm size unknown −0.087∗ ∗ ∗
Education (control=year 11 or less)
Degree or above 1.050∗ ∗ ∗
P<0.001. †Heckman procedure. Estimation of earnings equations by
COEFFICIENTS FOR STATUS OF EMPLOYMENT INTERACTED WITH HOURS (EARNINGS EQUATIONS WITH DISCOUNTED EARNINGS)
(Note:OTHER COEFFICIENTS ARE THE SAME AS MODELS1, 2AND3)
(Model number) Population
(4) Males (5) Females (6) Females†
Earnings equations
Employment status interacted with hours (control=
permanent working 35–40 hours)
Permanent: less than 35 hours 0.043 0.029 0.012
(0.043) (0.016) (0.016)
Permanent: 41–48 hours 0.009 −0.083∗ ∗ ∗ −0.079∗ ∗ ∗
(0.016) (0.018) (0.018)
Permanent: 49 hours or more −0.067∗ ∗ ∗ −0.101∗ ∗ ∗ −0.099∗ ∗ ∗
(0.019) (0.024) (0.024)
Casual: less than 35 hours −0.130∗ ∗ ∗
−0.155∗ ∗ ∗
−0.183∗ ∗ ∗
(0.025) (0.020) (0.020)
Casual: 35–40 hours −0.207∗ ∗ ∗ −0.220∗ ∗ ∗ −0.223∗ ∗ ∗
(0.031) (0.030) (0.030)
Casual: 41–48 hours −0.154∗ ∗ −0.284∗ ∗ ∗ −0.273∗ ∗ ∗
(0.047) (0.046) (0.044)
Casual: 49 hours or more −0.264∗ ∗ ∗
−0.215 −0.253∗
(0.053) (0.128) (0.121)
Fixed term: less than 35 hours 0.007 0.010 0.002
(0.069) (0.029) (0.029)
Fixed term: 35–40 hours 0.019 −0.047 −0.046
(0.033) (0.026) (0.026)
Fixed term: 41–48 hours 0.032 −0.124∗ ∗
−0.117∗
(0.037) (0.044) (0.046)
Fixed term: 49 hours or more −0.050 −0.134∗
−0.148∗
(0.041) (0.060) (0.061)
R2 0.565 0.575
No. cases 3196 3099 7069
∗
P<0.05; ∗ ∗
P<0.01; ∗ ∗ ∗
P<0.001. †Heckman procedure. Estimation of earnings equations by
pseudomaximum-likelihood (Stata 2003b: 39). Robust standard errors (which take account of the de-sign effect) are in parentheses.Note:Earnings discounted by 20% for casual employees.
APPENDIX2
SUMMARY STATISTICS:MEANS AND STANDARD DEVIATIONS
Males Females Females†
Variable Mean SD Mean SD Mean SD
Permanent: less than 35 hours 0.038 0.191 0.187 0.390 Permanent: 35–40 hours 0.301 0.459 0.279 0.449 Permanent: 41–48 hours 0.173 0.379 0.089 0.285 Permanent: 49 hours or more 0.199 0.399 0.057 0.232 Casual: less than 35 hours 0.122 0.328 0.253 0.435
Casual: 35–40 hours 0.049 0.216 0.033 0.180
Casual: 41–48 hours 0.009 0.097 0.006 0.077
Casual: 49 hours or more 0.017 0.130 0.003 0.056 Fixed term: less than 35 hours 0.008 0.089 0.034 0.182 Fixed term: 35–40 hours 0.032 0.176 0.033 0.179 Fixed term: 41–48 hours 0.022 0.148 0.013 0.113 Fixed term: 49 hours or more 0.028 0.165 0.011 0.103 Employed through agency 0.039 0.193 0.034 0.180
Age 36.542 12.515 36.355 12.375
Age squared (div by 100) 14.919 9.748 14.748 9.407
Metropolitan 0.663 0.473 0.667 0.471
Inner regional 0.240 0.427 0.231 0.422
Outer regional 0.081 0.273 0.088 0.283
Remote 0.016 0.125 0.014 0.116
Degree or above 0.227 0.419 0.272 0.445
Diploma 0.085 0.278 0.101 0.302
Certificate 0.314 0.464 0.214 0.410
Completed year 12 0.143 0.350 0.147 0.354
Year 11 or less 0.218 0.413 0.226 0.419
Unknown 0.014 0.116 0.040 0.195
Studying at school 0.031 0.172 0.040 0.196
Tertiary or other post-school 0.162 0.369 0.151 0.358 study
Union member 0.327 0.469 0.289 0.453
Supervisor 0.522 0.500 0.418 0.493
Day or evening shift 0.761 0.427 0.761 0.426
Night 0.024 0.152 0.024 0.152
Rotating 0.100 0.299 0.090 0.286
Split 0.009 0.094 0.014 0.116
On call 0.022 0.148 0.022 0.148
Irregular 0.085 0.279 0.089 0.285
Less than 20 employees 0.229 0.420 0.242 0.428
20–99 employees 0.170 0.375 0.157 0.364
100–499 employees 0.140 0.347 0.108 0.311
500–999 employees 0.069 0.253 0.064 0.244
APPENDIX2 (Continued)
Males Females Females†
Variable Mean SD Mean SD Mean SD
APPENDIX2 (Continued)
Males Females Females†
Variable Mean SD Mean SD Mean SD
Construction 0.082 0.274 0.013 0.114
Wholesale trade 0.047 0.212 0.029 0.167
Retail trade 0.124 0.330 0.155 0.362
Accommodation 0.049 0.216 0.068 0.252 Transport and
storage
0.066 0.249 0.020 0.142
Communication services
0.036 0.186 0.017 0.128
Finance and insurance
0.033 0.178 0.052 0.223
Property and business services
0.097 0.295 0.108 0.310
Government 0.055 0.228 0.040 0.196
Education 0.059 0.237 0.151 0.358
Health and community services
0.044 0.204 0.211 0.408
Cultural and recreation services
0.030 0.171 0.023 0.150
Personal and other services
0.036 0.185 0.037 0.188
Married 0.604 0.489
Number children under 6
0.203 0.538
Number children between 6 and 18
0.443 0.888
Degree or above 0.174 0.379
Diploma 0.081 0.273
Certificate 0.202 0.402
Completed year 12
0.118 0.322
Year 11 or less 0.379 0.485
Unknown 0.045 0.207