Full Terms & Conditions of access and use can be found at
http://www.tandfonline.com/action/journalInformation?journalCode=cbie20
Download by: [Universitas Maritim Raja Ali Haji] Date: 17 January 2016, At: 23:48
ISSN: 0007-4918 (Print) 1472-7234 (Online) Journal homepage: http://www.tandfonline.com/loi/cbie20
Inflation targeting in Indonesia, 1999–2012: an
ex-post review
Lloyd R. Kenward
To cite this article: Lloyd R. Kenward (2013) Inflation targeting in Indonesia, 1999–2012: an ex-post review, Bulletin of Indonesian Economic Studies, 49:3, 305-327, DOI:
10.1080/00074918.2013.850630
To link to this article: http://dx.doi.org/10.1080/00074918.2013.850630
Published online: 05 Dec 2013.
Submit your article to this journal
Article views: 206
View related articles
ISSN 0007-4918 print/ISSN 1472-7234 online/13/030305-23 © 2013 Indonesia Project ANU http://dx.doi.org/10.1080/00074918.2013.850630
INFLATION TARGETING IN INDONESIA, 1999–2012:
AN EX-POST REVIEW
Lloyd R. Kenward*
Victoria, Canada
Around the end of 1999, Bank Indonesia (BI) adopted inlation targeting as part of its approach to monetary policy. This article reviews the experience up to 2012, examines BI’s performance in hitting its inlation targets and considers certain broader indicators of success. Overall, inlation targeting in Indonesia has been a messy, evolutionary process, and BI’s implementation record compares unfavour-ably with that of its peers. Yet Indonesia recorded a signiicant downward trend in inlation during this period and maintained strong economic growth. Also, almost all of its inlation-targeting arrangements are now in line with common interna-tional practice. Looking ahead, this article offers suggestions for sustaining pro-gress in inlation targeting, such as setting more ambitious targets in the outer years and implementing strong policies to reduce inlation further, including after large administrative price shocks.
Keywords: inlation targeting, monetary policy
INTRODUCTION
Indonesia has a well-known history of being prone to inlation (Hossain 2012:
111–17). Since independence, in 1945, the only extended period of reasonable
sta-bility was 1985–96, when the inlation rate, as measured by the consumer price
index (CPI), was generally in high single digits, averaging almost 8%.1 Against this background, three developments in the late 1990s foreshadowed change. First, in mid-1997 the authorities abandoned their ‘crawling band’ exchange-rate regime, substituting the IMF- and crisis-driven model of targeting base money to
reach desired rates of nominal GDP and, in effect, inlation. Second, in May 1999 the Indonesian parliament enacted Law 23/1999 on Bank Indonesia (BI), which deined relatively clearly the central bank’s objective2 and, in principle, granted
* The author wishes to acknowledge the many helpful comments of two anonymous referees. Their suggestions signiicantly improved the quality of this article.
1 Source: <http://databank.worldbank.org/ddp/home.do>.
2 Article 7 states that BI’s objective ‘is to achieve and maintain stability of the rupiah val-ue’. At the time, it was unclear whether this was intended to mean low inlation or stability in the exchange rate. BI’s mission and vision statements clearly prioritise low inlation (see the preface to any of BI’s annual or economic reports from 2001 to 2011).
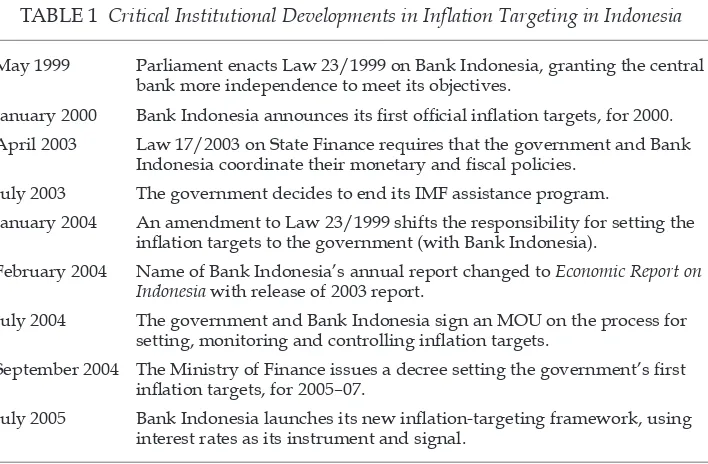
BI suficient independence to achieve it (Alamsyah et. al. 2001), with provisions for accountability (in chapter X of the law). And third, in 1999 BI adopted inlation targeting, and it announced its irst targets in early 2000 (table 1).
Indonesia has had 13 years’ experience with various forms of inlation target -ing, and there have been many changes during this period, including critical insti-tutional developments (table 1). This article examines this experience, providing international evidence and comparisons, where appropriate. It begins by
review-ing developments durreview-ing the inlation-targetreview-ing period to 2012, presentreview-ing BI’s targets and outcomes in ive distinctly different sub-periods. This portion of the
article includes a discussion of BI’s policy reactions at critical times, especially after it abandoned the growth rate of base money as its primary policy instru-ment, in 2005. The subsequent sections summarise BI’s record from two
perspec-tives: the irst is a narrow, technical analysis of the authorities’ success in hitting their targets; the second takes a broader view of BI’s accomplishments in inlation
targeting. The concluding section looks ahead and suggests ways of sustaining
Indonesia’s progress in managing inlation.
For analytical purposes, this article makes certain assumptions about oficial inlation targets, and the weaknesses of these assumptions should be noted at the outset. First, the analysis presents intra-year inlation targets as bands whose end-point is deined by the target and whose starting mid-point is deined by the actual December inlation (CPI) rate for the previous year. Oficial
inlation-targeting statements and analysis are rarely explicit about intra-year targets,
although examples of this article’s approach exist in oficial documents (see, for
example, BI 2007: 84, chart 3), as do references to ‘target corridors’ (italics added).3 Second, policymakers focus mainly on their year-end forecast in relation to the
year-end target, but it is dificult to gather reliable data on the evolution of BI’s year-end forecasts during most of this inlation-targeting period. Consequently,
this article’s comparison of CPI outcomes with the target in any given year should be interpreted only as a reasonable proxy for BI’s assessment of ongoing develop-ments at the time.
Nor is this article a primer on inlation targeting; it mentions the basics of the
policy only when necessary. A case in point concerns how BI responds to
dif-ferences between its targets and actual inlation. BI has been relatively clear on
this subject,4 and this article inds that BI has followed its announced approach, with only a few exceptions. For example, the decision to tighten policy (and
to what degree) depends in large part on BI’s forecast for inlation based on
unchanged policies, balanced against pressures to pursue other policy goals, such
3 See BI (2008: 120; 2009: xvii, 169; 2010: xx, xxi, xxv, 3). Table 11.9 in BI (2002: 215) presents an indicative, linear target path for 2003–06, which is consistent with this article’s analysis. 4 Namely, ‘Any change in the monetary policy stance is undertaken after evaluating whether future developments in inlation are on track with the established inlation tar-get …. At the operational level, the monetary policy stance is relected in the setting of the policy rate (BI Rate) with the expectation of inluencing money market rates and in turn the deposit rates and lending rates in the banking system. Changes in these rates will ultimately inluence output and inlation.’ See <http://www.bi.go.id/web/en/Moneter/ Kerangka+Kebijakan+Moneter/>. See also the discussion in the text, under ‘A new begin-ning: 2004–06’.
TABLE 1 Critical Institutional Developments in Inlation Targeting in Indonesia
May 1999 Parliament enacts Law 23/1999 on Bank Indonesia, granting the central bank more independence to meet its objectives.
January 2000 Bank Indonesia announces its irst oficial inlation targets, for 2000. April 2003 Law 17/2003 on State Finance requires that the government and Bank
Indonesia coordinate their monetary and iscal policies. July 2003 The government decides to end its IMF assistance program.
January 2004 An amendment to Law 23/1999 shifts the responsibility for setting the inlation targets to the government (with Bank Indonesia).
February 2004 Name of Bank Indonesia’s annual report changed to Economic Report on Indonesia with release of 2003 report.
July 2004 The government and Bank Indonesia sign an MOU on the process for setting, monitoring and controlling inlation targets.
September 2004 The Ministry of Finance issues a decree setting the government’s irst inlation targets, for 2005–07.
July 2005 Bank Indonesia launches its new inlation-targeting framework, using interest rates as its instrument and signal.
Note: MOU = memorandum of understanding.
as sustaining growth or maintaining inancial-sector stability.5 In addition, and as discussed later, the instruments for tightening policy have changed over the years and have on occasion invoked regulatory policy. Also, and most importantly for
this article, a central bank can reduce inlation with less impact on aggregate out
-put by lowering inlationary expectations. This is a well-known and simple idea: if a central bank is credible in its intentions to reduce inlation, disinlation is less costly, and it is easier to hold inlation down once it is low (Blinder 2000: 1430–
1). The operative word here, however, is credible; to gain credibility in its policy announcements, BI needs to establish a reputation for delivering its announced policies. And herein lies the main contribution of this article: namely, a detailed
review of BI’s record in inlation targeting.
STARTING THE PROCESS: 1999–2001
BI undertook inlation targeting at a juncture of considerable uncertainty (Cam
-eron 1999: 9–10). Inlation (as measured by the 12-month CPI) had been luctuat
-ing widely, ow-ing to the 1997–98 Asian inancial crisis, and peaked at more than 80% in the second half of 1998. In the inal months of 1999, when decisions were being made about the irst target within the context of Indonesia’s IMF program, inlation was decelerating sharply, restrained by a 50% rebound in the value of the
rupiah from its low point in mid-1998 (BI 1999: chart 3.9). In recognition, in early
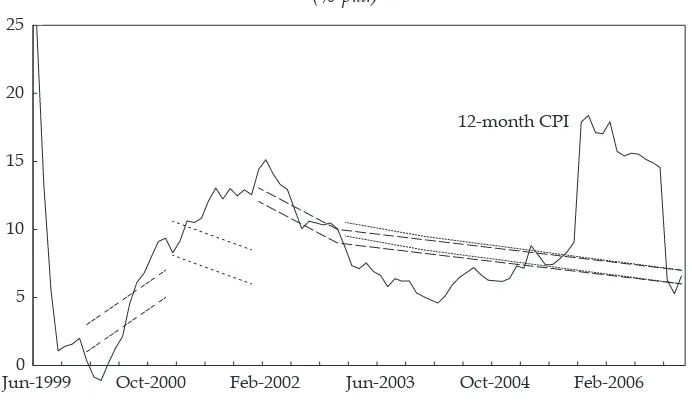
2000 BI put its irst target (igure 1 and appendix table A1) on a steeply rising path and for only one year – that is, for 2000. BI was targeting core inlation at this point (that is, inlation excluding the impact of the government’s price and income poli
-5 This is consistent with Alamsyah et. al. (2001).
FIGURE 1 Inlation and Bank Indonesia’s Upper and Lower Targets, 1999–2006
(% p.a.)
Jun-19990 Oct-2000 Feb-2002 Jun-2003 Oct-2004 Feb-2006 5
10 15 20 25
12-month CPI
Source: Appendix table A1.
cies (BI 2000: xiv, 155)). The targets in igure 1 use headline inlation, for the sake
of comparability with the actual CPI.
Determining the desirable time horizon for inlation targeting normally
involves assessing the lag between decisions on monetary policy and their impact
on inlation.6 One year looks too short to be credible. Still, countries commonly
set one-year targets, especially when using disinlationary strategies during the early stages of inlation targeting (Hammond 2012: 9; Roger 2009: 5), and in 1999 Indonesia was still in a disinlationary stage. But it is unconventional to announce a steeply rising target, which does little to contain inlationary expectations, espe
-cially when actual inlation overshoots the target, as it did in 2000 (igure 1). This combination made for an uncertain start to inlation targeting in Indonesia.
BI’s second target, for 2001, aimed at a declining rate of inlation (igure 1 and appendix table A1). It also widened the expected range for headline inlation by
0.5 of a percentage point (appendix table A1), which was appropriate because of
ongoing volatility. Like the 2000 target, however, the 2001 target set only a one-year time horizon. In the event, inlation rose steadily throughout 2001 (igure 1) and inished the year well above BI’s target.
After only two years, BI’s inlation-targeting regime was at risk. To be sure, it is not unusual for countries to have trouble achieving their inlation targets during the early years of inlation targeting (Roger 2009: 14). But international economet -ric evidence (Roger 2009: 16) shows that a central bank’s missing its targets during
disinlation weakens its policy credibility. This is consistent with the Indonesian
experience; these early years set the stage for the reforms of 2004, which would spread the responsibility more widely within the government.
6 BI research (BI 2000: 160) shows that monetary policy needs more than one year to affect the real economy. Seasonal or cyclical factors also need time to unwind, including those (such as Ramadan) that are not fully captured in a 12-month calculation of inlation.
Commenting on this uncertain start to inlation targeting, Syahril Sabirin, the
BI governor at the time, provided some insights in his foreword to BI’s Annual Report for 2001. To summarise, Indonesia was still reeling from the 1997–98 cri-sis, and the governor argued that, in such circumstances, BI could not be held responsible for its legal mandate ‘to achieve and maintain stability of the rupiah’s
value’. Yet this researcher found no oficial answer to why BI took on a major task such as inlation targeting at such a risky juncture.7 Perhaps it was deemed more important to begin the process than to achieve short-term results, which would be consistent with BI’s next steps.
A LONG-TERM PERSPECTIVE FOR A SHORT WHILE: 2001–03
Having had only limited success with one-year inlation targets, BI changed its
strategy, beginning with its targets for 2002. It moved to a more conventional,
gen-tly declining long-term target (igure 1 and appendix table A1) that incorporated several notable features. BI changed to targeting headline inlation for the sake of
transparency and in response to changing public expectations (BI 2001: ix), which brought Indonesia into line with international practice (Hammond 2012: 9). Also, BI set a longer-term target,8 from 2002 to 2006 (igure 1),9 but abandoned it in 2004. The 2006 target was only 6%–7%, which is not much lower than the 8% recorded
during the ive years of economic boom immediately before the 1997–98 crisis. BI
also narrowed the width of the target from two percentage points to one, for rea-sons that remain unclear. Few countries have used a target range as narrow as this (Hammond 2012: 9), and given BI’s record for 2000 and 2001 a wider range would have been a better choice.
Nevertheless, as 2002 unfolded, BI seemed to be making progress. Inlation came down quickly during the irst half of the year and even fell below BI’s targets for a short while (igure 1). By year-end, inlation was only slightly above target. For all practical purposes, BI had scored its irst success with inlation targeting.
This success continued throughout 2003 and most of 2004 (igure 1), but ques -tions soon arose about the exact targets. For example, BI’s economic report for 2002 states that BI stuck with its long-term perspective (of 6%–7% for 2006) but
reduced the time horizon from ive years to four years. Also, the target for the
7 The best answer was found in Goeltom (2007: 146) – namely, that a tight target speciied for a short, one-year time horizon would help to restore BI’s credibility, provided that the target could be achieved (italics added). In light of actual inlationary developments, Goel-tom argued that BI was constrained by both supply shocks (oil and electricity prices) and demand shocks (civil-service wage increases). This is consistent with the BI governor’s explanation noted in the text.
8 The cautious wording is notable: ‘In the next ive years Bank Indonesia has committed to gradually lowering the inlation rate to around 6%–7%’ (author’s translation from the Bahasa Indonesia version, BI 2001: ix).
9 This is surprisingly long, for several reasons. First, the jump from a one- to a ive-year time horizon is large. Second, ive years is considerably longer than the time required for monetary policy to have an impact (generally understood to be one to two years). And, third, few countries operate with a time horizon as long as ive years, although several use a ‘medium-term approach’ (interpreted as two years or more) or have an ‘at all times’ perspective (Hammond 2012: 9).
irst year was unchanged, but it was delayed by one year (from 2002 to 2003), and
the report is somewhat ambiguous about the width of the 2003 target.10 Notwith-standing its recent successes, BI was, in effect, announcing that it expected not
to accomplish much more during 2003 but to reduce inlation by another two to
three percentage points over the next three years.
Other important events were unfolding around this time, and these may have
reduced BI’s commitment to lowering inlation. For example, intense negotiations were underway about revising Law 23/1999 on BI, and about other matters, such as the recovery of Bank Indonesia Liquidity Assistance loans made to troubled
commercial banks during the 1997–98 crisis. BI acknowledged that these circum-stances hampered its performance of its duties (BI 2003: xxi), and they eventually erupted into a major scandal (Kong and Ramayandi 2008: 30–1). Also, national
elections were looming in the irst half of 2004, and policymakers were deferring
important decisions on fuel prices (Marks 2004: 165).
CONFUSION AND CHANGE: 2003–04
During 2003–04, Indonesia introduced many changes to its institutions and
pro-cesses, apparently in search of a more effective inlation-targeting system. The enactment of Law 17/2003 on State Finance, for example, required that the gov
-ernment and BI coordinate their iscal and monetary policies (Ginting 2003: 355). And, in June 2004, elucidation 4 to the amendment to Law 23/1999 shifted the responsibility for setting inlation targets from BI to the government.11 Inlation targeting was now, in effect, a joint exercise.
In implementation, in May 2004 BI submitted its proposed inlation targets to
the government (BI 2004a). Also, on 1 July 2004 the government (represented by the Minister of Finance) and the BI governor signed a memorandum of
under-standing (MOU) on the process for setting inlation targets and on monitoring and control. The MOU did more than simply set the inlation targets: it established a coordinating mechanism and deined the respective roles of the government and BI in targeting, monitoring and controlling inlation,12 in providing public
information and building public conidence, and in promoting transparency and
10 BI (2002) ‘sets the inlation target for 2003 at 9% with a 1% error margin’ (p. 18). It is un-clear whether this means 8.5%–9.5% or 8%–10%. The former looks more plausible, because it would have been consistent with the 2006 target of 6%–7% (the target presented in igure 1). BI (2003: 53) says that the target at the beginning of 2003 was 9% with a deviation of +/– 1%. This is strange, however, because it implies a narrowing target width from 2003 to 2006. In the event, it matters little – actual inlation remained well below both targets until they were superseded, in September 2004 (see later in the text).
11 Neither the amendment nor the elucidation is speciic about the means that BI must use to achieve this goal. They refer both to monetary targets and to other means, such as open-market operations, discount rates, bank reserve requirements and credit regulations. Elucidation 3 explicitly maintains the dichotomy (see footnote 2) that BI’s responsibility for maintaining the rupiah’s value includes both stable prices and a stable exchange rate. 12 The MOU provides wide leeway for certain details of the targets. They can be set in terms of headline or core CPI inlation, and they can be a range, a point or a point with deviation.
accountability in economic policy.13 The MOU also included a commitment from
the government to adopt an inlation target before the end of July. In the event,
this did not occur until September 2004 (table 1).
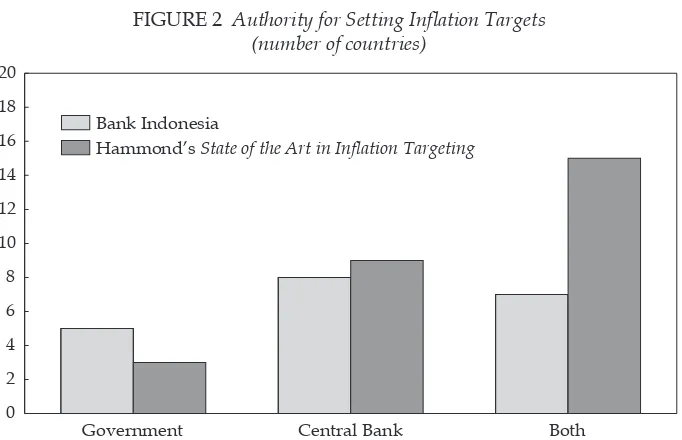
Broadening institutional responsibility was a healthy step forward (mainly
because of BI’s spotty record in inlation targeting up to that point) and sought to coordinate Indonesia’s monetary and iscal policies. It was – and, increasingly,
is – common international practice for a broader constituency to set a country’s
inlation targets (igure 2). There was also a matter of personalities. Some key indi -viduals involved in the MOU had worked both as central bankers and in other capacities, including as cabinet ministers. Consequently, they had a wider, cross-institutional perspective and were, therefore, more supportive of broader institu-tional responsibility.
Subsequent changes to inlation targeting were determined largely by the
MOU. Following its signing, the government and BI set up the interdepartmental
Inlation Control Team (Tim Pengendalian Inlasi, TPI; BI 2004: 20; BI 2005: 85),14 which was tasked with improving coordination between BI and the Ministry of
Finance at the technical level. Its role included recommending inlation targets,
13 The Ministry of Finance Decree of 6 September 2004 included, in article 3, an explicit provision for accountability: ‘Bank Indonesia and the government will openly explain to parliament and the public the causes of failing to achieve the inlation target’ (author’s translation).
14 The TPI seems to have started operating in 2005. In due course, members included BI, the Ministry of Finance, the Coordinating Ministry for Economic Affairs, the Ministry of Trade, the Ministry of Communications, the Ministry of Energy and Mineral Resources, the National Development Planning Agency, the Ministry of Agriculture, and the Ministry of Labour and Transmigration (BI 2010: 39).
FIGURE 2 Authority for Setting Inlation Targets
(number of countries)
Government Central Bank Both
0 2 4 6 8 10 12 14 16 18 20
Bank Indonesia
Hammond’s State of the Art in Inflation Targeting
Source: BI (2004: 19); Hammond (2012: 8).
evaluating sources of potential inlationary pressure and their implications for the
targets, advising on policies for achieving the targets, and disseminating
informa-tion to the public. In 2008, the TPI was expanded to include Regional Inlainforma-tion Control Teams (Tim Pengendalian Inlasi Daerah, TPIDs).15
Oficial statements about inlation targets continued to lack clarity, however,
with different targets and projections being cited at different times.16 For example, BI’s Economic Report on Indonesia for 2003 states that ‘monetary policy in 2004 will
continue to be directed at achieving the medium-term inlation target of 6% in
2006’ (BI 2003: 17).17 Yet, in a press release, BI (2004a) indicated that monitoring
and control of inlation for 2004 would be guided by BI’s inlation projection (italics
added) for that year. This projection is deined in BI’s Economic Report on Indonesia
for 2004 as 4.5%–6.5%, where it is sometimes referred to as ‘a target’ (BI 2004: xviii, 50).18 In the event, inlation soon accelerated, reaching 6.4% in December 2004, compared with 5.1% a year earlier.
A NEW BEGINNING: 2004–06
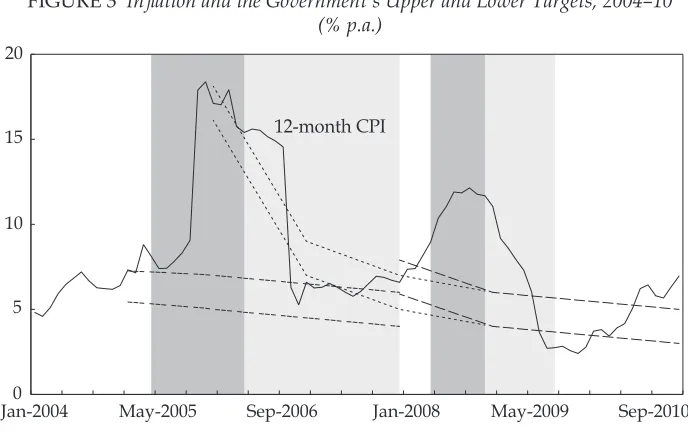
On 6 September 2004, the government issued its irst inlation target, for 2005–07 (igure 3). It adopted a mainstream approach to targeting headline CPI inlation
– namely, by setting a gently declining target path with a three-year time hori-zon, expressed as a point with a tolerance range of two percentage points, in line with common international practice (Hammond 2012: 9). This was promising, but
within months the new approach faced its irst test, as inlation quickly moved outside the target range (igure 3). Soaring international oil prices forced two large increases in domestic fuel prices, in March (McLeod 2005: 140) and October
(Sen and Steer 2005: 285). BI estimated the immediate impact on the CPI at 3.75
percentage points (BI 2005: 27), and inlation came under additional near-term
pressure from the exchange rate, especially after mid-2005 (BI 2005: 59). Yet the authorities responded well, using interest rates, supported by the aggressive use of regulatory policy,19 to contain follow-on inlationary pressures and demon
-strate their commitment to inlation targeting.
Amid this turbulence, BI took another important step in inlation targeting (BI
2004: 21). Following Indonesia’s decision in July 2003 to end its IMF program,
15 At irst, TPIDs were set up in only a few regions across Indonesia; by 2010, they were operating in 53 regions (BI 2010: 39), apparently with the aim of covering the 66 urban areas included in CPI calculations.
16 Given that there was no clear announcement for 2004, igure 1 does not include a formal target for that year. Appendix table A1 notes the informal target of 5.5% +/– 1%.
17 Previously, the target for 2006 had been 6%–7% (appendix table A1).
18 There was no mention of the old 2006 target of 6%–7%. The report does refer to a 2004 target of 6%–7% for core inlation (BI 2004: 51), but this looks more like a projection than a target. It seems coincidental that it is the same as the old target for 2006. Sarwono (2007) does not cite an oficial 2004 target but indicates a target range of 4.5%–6.5% in one of his charts. 19 Regulatory policy reduced banks’ net open positions and strictly limited derivative transactions (BI 2005: 70–2), mainly to protect the exchange rate. Also, the TPI was intro-duced (footnote 14), and there was ‘measured intervention’ in the foreign-exchange market (BI 2005: 5).
in July 2005 BI oficially moved from base money to interest rates as its opera -tional target.20 In principle, the mechanism is simple. The so-called BI rate is set as a ‘signal’ by BI’s board of governors,21 based on the performance of inlation relative to the targets (BI 2005: 101). As envisaged, changes in the BI rate are then
relected quickly in the overnight interbank rate, in due course in other interest rates (including bank lending rates), and ultimately in real activity and inlation.
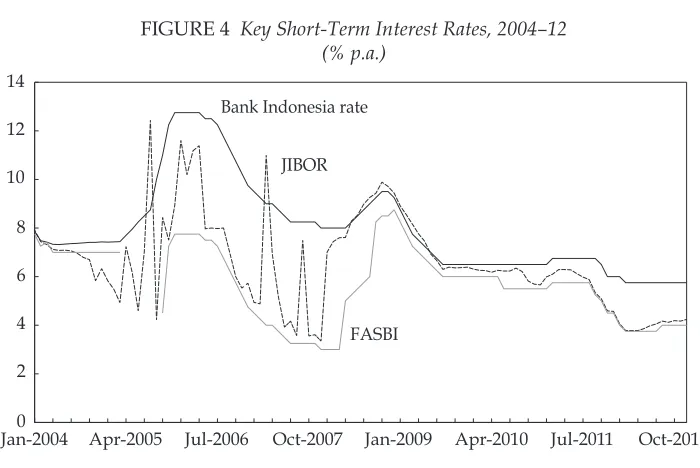
Figure 4 shows the path of three key interest rates over the inlation-targeting
period.22 All have similar proiles, although the JIBOR is much more volatile dur -ing extended periods of tight (or eas-ing) monetary policy. The broad stance of
mon-etary policy, as indicated by the path of the rates in igure 4, is summarised in table 2 and superimposed on igures 3 and 5, to show BI’s policy responses to inlation. The assessments in table 2 are relatively consistent with oficial BI statements, and
20 For a discussion of the considerations in choosing between base money and interest rates, see, for example, BI (2004: 21) and Hossain (2012: chapter 7).
21 As envisaged (BI 2005: 102), the BI rate would be set quarterly (in January, April, July and October), unless adjusted, in special circumstances, at other monthly BI board meet-ings. For all practical purposes, the BI rate has been set monthly.
22 The BI rate is a ‘signal’, as mentioned in the text; FASBI (Fasilitas Simpanan Bank In-donesia) is BI’s key short-term (overnight) policy rate; and JIBOR (Jakarta Interbank Over-night Rate) is a sensitive indicator of liquidity conditions in the interbank money market. The overnight FASBI was inactive between April and September 2005, which accounts for the gap in igure 4 (BI 2005: chapter 5). Figure 4 also uses the one-month Bank Indonesia Certiicate (Sertiikat Bank Indonesia, SBI) rate before July 2005 (when the BI rate was in-troduced), in line with BI’s convention (BI 2005: chart 5.17).
FIGURE 3 Inlation and the Government’s Upper and Lower Targets, 2004–10
(% p.a.)
Jan-20040 May-2005 Sep-2006 Jan-2008 May-2009 Sep-2010 5
10 15 20
12-month CPI
Source: Appendix table A1.
Note: The shaded bands represent the government’s implied stance on monetary policy (see also table 2), from tightening (dark grey) to easing (light grey) to neutral (unshaded) .
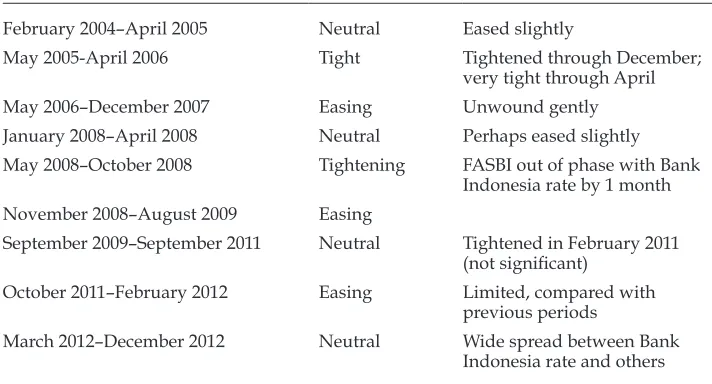
TABLE 2 Implied Stance of Monetary Policy
February 2004–April 2005 Neutral Eased slightly
May 2005-April 2006 Tight Tightened through December;
very tight through April
May 2006–December 2007 Easing Unwound gently
January 2008–April 2008 Neutral Perhaps eased slightly
May 2008–October 2008 Tightening FASBI out of phase with Bank Indonesia rate by 1 month November 2008–August 2009 Easing
September 2009–September 2011 Neutral Tightened in February 2011 (not signiicant)
October 2011–February 2012 Easing Limited, compared with previous periods
March 2012–December 2012 Neutral Wide spread between Bank Indonesia rate and others
Source: Author’s analysis of igure 5.
Note: FASBI = Bank Indonesia Deposit Facility.
policy adjustments tracked the CPI’s deviations quite well – especially after the increases in fuel prices in 2005. The main exceptions, in late 2007–08 and in 2010,
when inlation surged above target, are worth emphasising at this point. In 2007–
08, BI was slow to raise interest rates, owing to concerns over the international
inancial crisis; in 2010, BI held interest rates steady, arguing – correctly – that the
surge was caused by volatile food prices, which would unwind in due course. Much has been made of BI’s shift from base money to interest rates, including
calling it ‘fully ledged’ inlation targeting (Hossain 2012: 167; Hammond 2012: chart 1), and contrasting it with the previous regime of ‘inlation targeting lite’
(Hossain 2012: 277). This article has a less dramatic interpretation, in part because
BI continues to refer to it, accurately, as a shift to a ‘lexible inlation targeting
framework’ (BI 2011: 81; see also ‘A wider perspective’, below). BI essentially changed the instrument for achieving the same result, opting for the more trans-parent and easily understood instrument – interest rates.
Follow-up steps included setting a revised target for inlation for 2006–08,
which was announced on 17 March 2006 at a press conference called by the Eco-nomic Coordinating Minister. The new plan (appendix table A1) was to return
inlation within three years to the target envisaged before fuel prices had increased in 2005 (igure 3). Effectively, this represented a setback of one to two years for inlation targeting.
SETTLING IN: 2006–12
With the government’s strong policies in place, inlation came down quickly dur -ing 2006. By October that year, it had fallen below the government’s target, where
it generally stayed until mid-2007 (igure 3). As inlation fell, BI eased the BI rate (igures 3 and 4) to a low point of 8% in late 2007, which it maintained through early 2008 (igure 4). In early 2008, the government set the irst year of its targets
at a moderately higher level and put the outer years’ targets back on their earlier
trajectory (igure 3).
In hindsight, perhaps BI ran policy too loose for too long in late 2007 and early
2008. Inlation rose from its a low point of 5.8% in June 2007 (igure 3), but BI
continued to lower the BI rate for several more months, until April 2008, by which
time inlation had climbed back to 9% – way outside the targets. Inlation received
another boost, in May 2008, from a 29% increase in domestic fuel prices (BI 2008: 5), and only then did BI begin to tighten policy. In BI’s defence, this was a period
of international instability, being the depths of the global inancial crisis, and
domestically BI was coping with early stages of the Bank Century crisis (Patunru
and Von Luebke 2010: 10–12). This episode is an excellent illustration of BI’s bal
-ancing inlation targeting with other concerns, such as output luctuations and inancial-system stability (see ‘A wider perspective’, below). BI was correct to err
on the side of over-easing, but its actions did dilute the hard-won reputational gains of 2005 and 2006.
There were other notable developments during this settling-in period. For example, very little was said about targets in 2007 and 2009, although in due course BI indicated that its targets were unchanged from the preceding year (appendix table A1). BI continued to set policy on the basis of existing targets,
which in effect reduced the inlation-targeting time horizon from three years to
two for both 2007 and 2009.
In an unusual turn of events, both BI and the Ministry of Finance announced targets for 2010 and beyond, but they were not exactly the same (appendix table
A1). Yet nor were they inconsistent – indeed, they were identical for 2010 (igure
5), but the outer years were potentially confusing. For example, BI’s time horizon
was ive years (to 2014) versus the Ministry of Finance’s three (to 2012). With a
FIGURE 4 Key Short-Term Interest Rates, 2004–12 (% p.a.)
Jan-20040 Apr-2005 Jul-2006 Oct-2007 Jan-2009 Apr-2010 Jul-2011 Oct-2012 2
4 6 8 10 12 14
Bank Indonesia rate
JIBOR
FASBI
Source: Bank Indonesia.
Note: JIBOR = Jakarta Interbank Offered Rate; FASBI = Bank Indonesia Deposit Facility, which was inactive between April and September 2005.
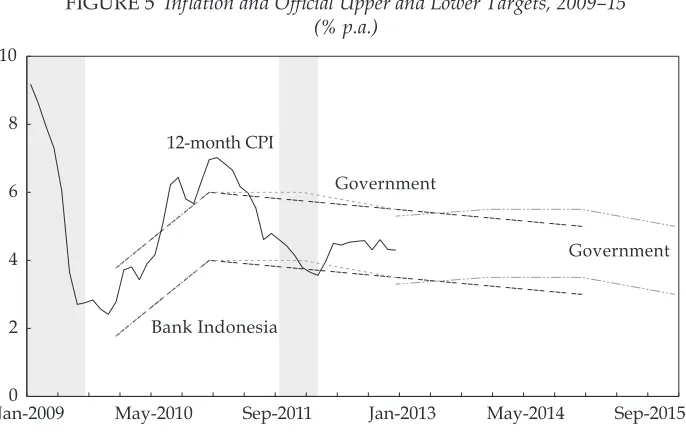
FIGURE 5 Inlation and Oficial Upper and Lower Targets, 2009–15
(% p.a.)
Jan-20090 May-2010 Sep-2011 Jan-2013 May-2014 Sep-2015 2
4 6 8 10
Bank Indonesia
Government Government
12-month CPI
Source: Appendix table A1.
Note: The shaded bands represent the government’s implied stance on monetary policy, from easing (light grey) to neutral (unshaded, to December 2012).
few exceptions,23 BI said little about targets between 2010 and 2014, but the differ-ence between its end-point and that of the Ministry of Finance implied that very little progress (only 0.5 of a percentage point) was expected during 2013–14. Also, these differences raise questions about the quality of institutional coordination, because the Ministry of Finance’s announcements did not refer to BI’s targets, which had been public for months.24
Overall, 2010–12 was a period of considerable stability, underwritten in part
by rising iscal costs to subsidise fuel and electricity prices (Burke and Resosu
-darmo 2012: 305). Inlation slipped outside the targets on occasion, on both the high and the low side, but only for relatively short intervals (igure 5). Relecting this relative stability in inlation, the BI rate went unchanged for extended periods and even showed a mild downward tendency (igure 4). Of special interest is the surge in inlation in 2010 (igure 5), which BI (2010: 3) attributed to volatile food prices. Noting that core inlation was steady, BI maintained a neutral policy stance
and waited for food prices to correct of their own accord.
The targets announced from 2010 to 2012 were all very much alike. Their
start-ing points change somewhat (dependstart-ing on the realised inlation rate), but the outer-year targets are almost the same (igure 5). All of the targets provide for only minor declines in inlation during the outer years, and none of the
outer-23 In June, July and August 2010, BI press releases (see <http://www.bi.go.id/web/en/ Ruang+Media/Siaran+Pers/>) mention a target of 4%–6% for 2010 and 2011. These press releases pre-date the Ministry of Finance decree of 24 August 2010.
24 BI’s target is cited in the governor’s foreword to the BI’s Annual Report for 2009, dated March 2010. The government’s announcement is dated 24 August 2010 (appendix table A1).
year targets differ much from the actual inlation rates recorded between early 2011 and the end of 2012. This message was clear: Indonesia’s inlation rates were
then about as low as can be expected for the next few years. This point is pursued towards the end of this article.
PERFORMANCE IN HITTING THE TARGETS
A central bank’s performance in inlation targeting helps determine its credibility and thereby its inluence on inlationary expectations. One simple, quantitative
method of measuring such performance is to compare outcomes with targets.
This approach presents dificulties, to be sure, such as choosing the time horizon and assessing inlation targeting’s contribution to some higher purpose, such as
a better economic performance overall (see Svensson 2009 and ‘A wider perspec-tive’, below).25 This section looks more carefully at Indonesia’s inlation-targeting performance. It begins by examining BI’s one-year-ahead record – which, as
men-tioned, looks too short to have any anti-inlationary effect26 – followed by BI’s record for two and three years ahead. It then makes observations on even longer time horizons.
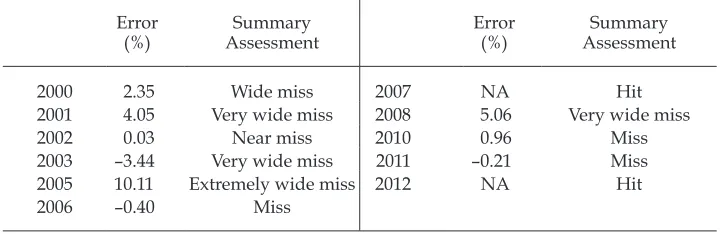
Of the 11 one-year-ahead targets on record, BI hit its targets only twice, in 2007 and 2012, with one near miss, in 2002 (table 3). If we count these three years as successes, then BI has a success rate of 27%, with misses recording an average absolute error of 3%. Indonesia’s misses are dominated by those on the high side of targets (six), with only three misses on the low side, which is consistent with international experience (Roger 2009: 15) .
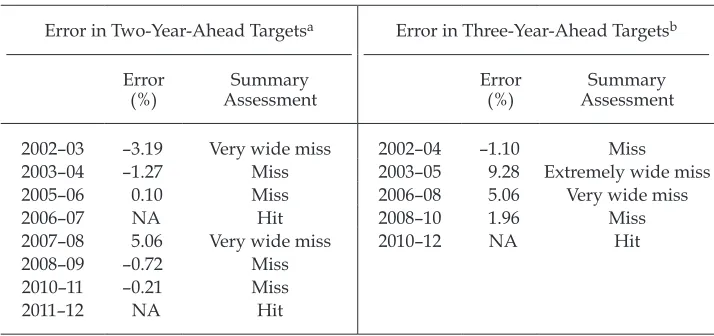
Extending the time horizon does not improve Indonesia’s record.27 Its perfor-mance is a little better over two years (table 4), in that the average absolute error is markedly lower (1.8% versus 3.0%), but the authorities hit their target slightly less frequently (25% versus 27%). A three-year time horizon sees the success rate slip to 20% and the average absolute error jump to 4.4%.
In looking at even longer-term (four- and ive-year) targets, there is a notable
irony: BI’s targets of 6%–7% for 2002–06 and for 2003–06 would have been hit in
2006 had the authorities persisted with them (igure 1). The gains in credibility would have been signiicant – doubly so had the authorities put those targets on a slightly latter, downward trajectory through 2012. The outcomes for 2011 and 2012 would then have been very close to those targets, despite the inlationary
episodes of 2005 and 2008.
Another quantitative indicator of (narrowly deined) performance is the fre -quency with which the monthly CPI was inside the target range. During 2000–12,
25 For example, Svensson (2009) points out that as the time horizon lengthens, the like-lihood increases of some change in circumstances rendering the initial policy settings inappropriate.
26 Still, it is the time horizon against which BI reports regularly; see <http://www.bi.go. id/web/en/Moneter/Inlasi/Bank+Indonesia+dan+Inlasi/penetapan.htm>.
27 Assessments of two- and three-year targets were not included if the initial target was superseded in any appreciable way by subsequent changes to the second- or third-year tar-get. For example, the three-year target for 2005-07 was not included in table 3, because the target for 2007 was raised by one percentage point in August 2007. See appendix table A1.
actual inlation was inside Indonesia’s target range only 27% of the time, with the
bulk of misses on the high side. During 2000–05 (before the government began to set the targets), the monthly CPI was inside the target range only 11% of the time.
This record compares unfavourably with that of Indonesia’s peers – that is, other ‘low income’ countries, according to Roger (2009: 15)28 – owing to its suc-cess rate of 27% versus 40% and an (annual) average absolute error of 3.0% versus 2.3%.29 Grenville and Ito (2010: 49) provide data on speciic regional comparators:
Thailand (which targets core inlation with a slightly wider range than most, 3%
versus an average of about 2.5%; Hammond 2012: 9) scores an outstanding 89%, Korea a respectable 50%–56% and the Philippines 14.5%.30
A WIDER PERSPECTIVE
This section looks at the broader picture of what has been accomplished in inla
-tion targeting in Indonesia, because BI is not concerned solely with inla-tion, notwithstanding its legal mandate and mission and vision statements. Like every institution tasked with inlation targeting identiied by Roger (2009: 13), BI practices ‘lexible inlation targeting’, that is, it weighs the beneits of lower inlation against the costs of not addressing other concerns.31 For BI, these other
concerns include output luctuations (see, for example, Alamsyah et. al. 2001 and
28 These data for Indonesia begin in July 2005 (Roger 2009: 6), which implies they consider only the government’s targets, and not those announced by BI.
29 These comparisons are slightly less unfavourable (at 33% and 2.4%, respectively) for Indonesia when compared with low-income countries in a ‘disinlation phase’.
30 For their sample, in 2002–10, Indonesia’s inlation rate was inside its targets 13% of the time.
31 To evaluate such a monetary-policy regime, Sevensson (2009) suggests analysing de-viations between inlation gaps and output gaps, and taking into account the information available when the policy decision was made. This would likely be a very challenging task for Indonesia, in that detailed data would be needed on the information (and its quality) available at BI board meetings. Grenville and Ito (2010) attempt a simpliied version of this for Thailand, by estimating a Taylor-rule reaction function.
TABLE 3 Indonesia’s Near-Term Record in Inlation Targeting, 2000–12
Error
2000 2.35 Wide miss 2007 NA Hit
2001 4.05 Very wide miss 2008 5.06 Very wide miss
2002 0.03 Near miss 2010 0.96 Miss
2003 –3.44 Very wide miss 2011 –0.21 Miss
2005 10.11 Extremely wide miss 2012 NA Hit
2006 –0.40 Miss
Source: Author’s calculations.
Note: NA = not applicable. Error on one-year-ahead targets. Average absolute error of misses = 3.0%. Error represents actual inlation less closest edge of target range. Targets were never oficially announced for 2004, 2009 or 2011.
BI 2011: xxiii); the exchange rate (as evidenced by wide swings in oficial interna
-tional reserves in recent years; BI 2011: table 4.1); and inancial-system stability
(mentioned in BI’s mission statement).
It is well beyond the scope of this article to review Indonesia’s macroeconomic policies during the past 13 years in order to isolate the contribution of monetary
policy and inlation targeting to growth and inancial stability. Nevertheless, there
is much that can be said and, in contrast with previous sections, much of it is positive.
Downward trend in inlation while high growth sustained
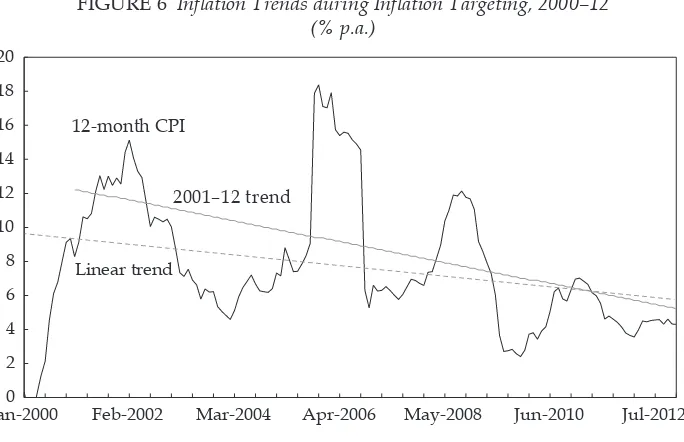
The most important outcome during Indonesia’s inlation-targeting period has been a pronounced downward trend in CPI inlation. This trend is statistically signiicant (igure 6),32 with a coeficient that implies a decline in the rate of inla -tion of 0.3% annually. The results are even more striking if the trend line begins in
2001 (that is, if it excludes the unconventional, rising inlation target for 2000).33
To be sure, inlation rates of the past few years have been restrained by rising gov -ernment subsidies (see ‘Important caveats’, below). Also, lower, more stable rates
of inlation have in recent years become more common across the Asia-Paciic
region (Filagro and Genberg 2010: 262), and internationally. Still, the pronounced downward trend in Indonesia is noteworthy because it is less apparent elsewhere
(IMF 2012: igure 1.10; BI 2011: charts 1.6, 6.6).
It is equally striking that inlation has come down so far while Indonesia has
sustained strong economic growth. Since 1999, GDP growth has averaged around
32 The t-statistic on the trend coeficient is 3.7.
33 The t-statistic rises to 7.2, and the implied drop-off in inlation is almost 0.65 per annum.
TABLE 4 Indonesia’s Medium-Term Record in Inlation Targeting, 2000–12
Error in Two-Year-Ahead Targetsa Error in Three-Year-Ahead Targetsb
Error (%)
Summary Assessment
Error (%)
Summary Assessment
2002–03 –3.19 Very wide miss 2002–04 –1.10 Miss
2003–04 –1.27 Miss 2003–05 9.28 Extremely wide miss
2005–06 0.10 Miss 2006–08 5.06 Very wide miss
2006–07 NA Hit 2008–10 1.96 Miss
2007–08 5.06 Very wide miss 2010–12 NA Hit
2008–09 –0.72 Miss
2010–11 –0.21 Miss
2011–12 NA Hit
Source: Author’s calculations.
Note: NA = not applicable. Error represents actual inlation less closest edge of target range.
aAbsolute error of misses = 1.8%.
bAverage absolute error of misses = 4.4%.
FIGURE 6 Inlation Trends during Inlation Targeting, 2000–12
(% p.a.)
Jan-20000 Feb-2002 Mar-2004 Apr-2006 May-2008 Jun-2010 Jul-2012 2
4 6 8 10 12 14 16 18 20
2001–12 trend
Linear trend
12-month CPI
Source: Bank Indonesia.
Note: CPI = consumer price index.
5.5% per annum, with slower growth in the post-crisis years, when inlation tar -geting was just starting. In the past six years, growth has exceeded 6% (excluding
2009, when it slipped to 4.5% during the global inancial crisis. Without doubt, the role of inlation targeting in this result is highly uncertain, especially because
some of Indonesia’s high-growth regional comparators (China and Malaysia, for example) have different monetary regimes. Nevertheless, it is impressive that
inlation has come down so far while strong growth has been maintained.
Other indicators of progress
Virtually all aspects of Indonesia’s inlation-targeting framework are now in line
with international ‘best practice’ (Hammond 2012; Roger 2009). These include the
target (headline inlation); the target range (two percentage points); the time hori -zon (three years); the authority for setting the target (the government in
coordi-nation with BI); the pursuit of lexible inlation targeting; close monitoring of the
target, especially by BI staff;34 frequent review periods (in effect, monthly); and accountability, including communication with the public.35 The only area where Indonesia could still be considered a fringe element concerns the mid-point of the target. Indonesia’s relatively high mid-point target, of 4.5%, versus an average
34 BI staff consistently distinguish among core inlation (which they believe is inluenced by monetary policy and accounts for about two-thirds of the CPI); volatile food inlation (which, by deinition, is considered to be temporary, with a weight of about 15% in the total CPI); and administered inlation (which is determined by governmental policy decisions, at least on timing, with a weight of less than 20% in the CPI).
35 BI reports regularly to parliament; it publishes quarterly reports on monetary policy and monthly reviews of monetary policy; and senior BI staff often speak with the press.
of 3.3%,36 raises the question whether the government and BI should be setting lower targets (discussed below, under ‘Sustaining progress’).
With only a few exceptions, BI’s policy decisions on interest rates have been
consistent with Indonesia’s inlation-targeting framework – and those exceptions
were necessary in the circumstances, as discussed above. BI’s response to the increases in fuel prices in 2005, for example, was particularly effective in
contain-ing secondary inlation, and inlation targetcontain-ing looks as though it proved a useful
framework for this purpose.37 BI’s response also gives conidence that Indonesia
will quickly be able to overcome future bursts in inlation stemming from large
changes in relative prices.
There have been other appropriate decisions, too. For example, broadening
the responsibility for setting inlation targets, in 2004, has added structure to the
IT process, and widened the constituency for coordination and for implement-ing sound policies (via, for instance, the TPI). At the time, this was not the most common model among other countries, but the international consensus has since
shifted towards broader constituencies (igure 2).
Indonesia’s move to inlation targeting has intensiied public and private focus on inlation in Indonesia, and the conduct of monetary policy is now more
transparent (see, for example, footnotes 13, 14, 15 and 35). Filardo and Guini-gundo (2008: 33) point out that greater transparency in central-bank intentions should reduce the dispersion of private-sector expectations and assist in the
con-trol of inlation. They ind evidence of this in reduced mode and dispersion of local inlation forecasts among professional private-sector forecasters in
inlation-targeting countries, including Indonesia (24–5).38
There has often been confusion in implementation of Indonesia’s
inlation-targeting regime, but it does seem to be on the decline. In 2003, for example, dif-ferent targets were cited at difdif-ferent times, and 2004 was particularly confusing, partly because in that year institutional responsibilities shifted from BI to the gov-ernment. There have also been abrupt changes in BI’s time horizon (appendix
table A1), and it is even dificult to identify BI’s targets for certain periods.39 As late as 2010, there was still some confusion; for example, the targets were unclear for 2011 and beyond, and BI (2011: xxxvii) refers to a target that does not seem to exist.40
36 Indeed, Indonesia’s target mid-point is lower than that of only Ghana (8.7%) and Tur-key (5%). Among regional comparators, Thailand and Korea are at 3% and the Philippines is at 4% (Hammond 2012: 9, including for the average mid-point in the text).
37 This is consistent with Roger’s (2009) tentative conclusion that inlation-targeters were better than non-targeters at coping with the inancial shocks of 2007–09.
38 Subsequent analysis by Filardo and Genberg (2010: 259, 271) found a drastic reduction in the mode of private-sector inlation forecasts for inlation-targeters in the region but less evidence of reduced dispersion among the forecasters, including in Indonesia.
39 By way of example, an anonymous referee questioned two of the targets in an early draft of this article. One of them looks like a translation error (see the following footnote and appendix table A1 for 2012–13). The other is correct, as evidenced by a statement in the governor’s foreword to BI’s Economic Report for 2009.
40 This article does not include this target in its analysis, because the Bahasa Indonesia version of BI (2011) does not refer to it as a target such (sasaran). There appears to have been a translation error in the English version of the report. See appendix table A1.
Important caveats
It is hard to deny that Indonesia enjoyed favourable macroeconomic outcomes
during its irst 13 years of inlation targeting, even allowing for the complications posed by administrative prices. Still, a question of attribution remains – lower inla
-tion during inla-tion targeting is hardly evidence that inla-tion targeting brought inlation down. Indeed, looking across the Asia-Paciic region, Filardo and Gen -berg (2010: 258) conclude that improvements in price stability do not appear to
correspond with inlation-targeting decisions. They distinguish between a greater focus on inlation control (which has translated into a more stable inlationary
environment across the region) and any differences between countries with
agen-cies tasked with explicit inlation targeting and countries without. Applying their thinking to this discussion, greater attention to inlation in the past 13 years may have been more important than inlation targeting, per se, in reducing inlation in Indonesia. In that case, the main contribution of inlation targeting may have been as a framework within which to address inlationary concerns.
Marshalling more econometric evidence on this topic for Indonesia would be a worthy follow-up exercise. But, for the time being, this article takes the
posi-tion that successes through to the end of 2012 have been striking, and that inla -tion targeting contributed to them (although the extent of its contribu-tion remains unclear).
As another caveat, inlation targeting in Indonesia has yet to be fully tested. During the period under review, there can be little doubt that Indonesia beneited
from large government subsidies for fuel and electricity (Burke and Resosudarmo
2012: 305), a benign international inlationary environment (IMF 2012: 11–13) and strong net capital inlows that largely offset a weakening current account
(Burke and Resosudarmo 2012: 304). These favourable factors will not continue
indeinitely; in due course they will shift against Indonesia and inlation target -ing, which will test both.
SUSTAINING PROGRESS
Notwithstanding its poor record of hitting its inlation targets, BI has important successes to show, as just discussed. Indeed, the past three to ive years look like the longest period of low, stable inlation in Indonesia’s history (compare with
Hossain 2012: 111, for example). The question for Indonesia is how to build on these successes.
Is 4.5% inlation good enough?
There is a large body of literature on the optimum rate of inlation, but no con -sensus on the theory or the empirical evidence, especially for developing coun-tries (Goeltom 2007: 160; Hossain 2012: 145–8). The theoretical optimum is zero, according to the so-called New Keynesian paradigm (Gali 2008: chapter 4),41
which is consistent with BI’s oficial mission statement. However, the practical consensus, such as it is (summarised in Hammond 2012: 8), suggests that inla
-41 Friedman (1969) goes further, arguing that central banks should keep nominal inter-est rates at zero by pursuing a rate of delationequal to the interest rate on government (riskless) bonds.
tion above 3%–4% imposes welfare costs on society.42 By contrast, there seems to
be few plausible gains in reducing inlation to below 2%, in part because of an
upward bias in CPI measurement (Hammond 2012: 8).
A more pragmatic approach would be to compare Indonesia’s targets with those of its neighbours, noting the broader comparison of Hammond (2012: 9). On this
basis, Indonesia’s recent targets (of 4% or so) do not look suficiently ambitious,
especially in the outer years. As mentioned, all of Indonesia’s neighbours
practis-ing inlation targetpractis-ing (Thailand, South Korea and the Philippines) have targets
lower than Indonesia’s. And all of them – as well as China, Malaysia, Singapore and Hong Kong, which operate under different monetary regimes – are achieving
inlation rates that are appreciably below Indonesia’s recent rates of around 5%.43 Among other regional comparators, only India and Vietnam recorded higher rates
of inlation than Indonesia at the end of 2012, of 7.25% and 7.00%, respectively. Indonesia can do better, and its outer-year targets would do well to relect this.
Strengthening credibility and technical matters
The government has already communicated credible inlation targets to the pub -lic, through simple Ministry of Finance decrees (appendix table A1), and has pro-vided a reasonable level of accountability (footnotes 13, 35). Also, recent targets have been quite stable, albeit at rates that look a bit too high in the outer years. Nevertheless, further steps could be taken to improve the authorities’ credibility as
inlation ighters. First, it is unclear why BI’s targets should ever differ from those
of the government; but if they do differ, a public explanation would be
appropri-ate. Second, if BI hit its inlation targets more often it would improve both its credibility and its capacity to inluence inlationary expectations. If necessary, the
government might consider widening the target range a little to allow more room for volatile components. Third, introducing greater automaticity to any adjust-ments to administered prices, such as fuel and electricity, would be helpful. If this cannot be accomplished, most likely because of political sensitivities, policy
announcements could focus more intently on core inlation when administered prices are temporarily pushing up the inlation rate (or threatening to do so).
Greater attention to a few narrow, technical matters – such as the amount of
publicly available analysis of core and headline inlation, and particularly of the
extent to which the latter converges towards the former – might improve public
understanding of BI’s inlation-targeting regime. More balance in BI’s public com
-mentary on some aspects of inlation would also be useful. For example, BI tends to downplay temporary restraints on inlation (such as unsustainable government
subsidies, an especially strong exchange rate or a particularly good harvest) and to highlight unfavourable shocks (such as administered price increases or disrup-tions to local supply networks). More balance between these two would help to
improve the credibility of BI’s analysis of inlation.
42 The situation is even less clear for developing countries. For example, Chowdhury and Ham (2009) ind exploratory evidence for Indonesia that the threshold is between 8.5% and 11.0%. But Hossain (2012: 165) suggests that BI should consider price stability (italics add-ed) as its method of reducing inlation and inlationary uncertainty. For their part, Sugema and Bakhtiar (2010) ind that monetary policy in Indonesia can effect inlation in the short run but not in the long run, which undermines the credibility of setting any inlation target. 43 See <http://www.tradingeconomics.com/>.
Policies
It is a well-known theoretical proposition (Hossain 2012: chapter 5, for example)
that a ixed-exchange-rate regime greatly complicates a central bank’s control of inlation, because of the impact of foreign-exchange intervention on the base
money supply. This article is not a review of BI’s exchange-rate intervention or
sterilisation policies, but the more lexible Indonesia’s exchange-rate regime the more easily BI could target a given rate of inlation.
Mixed policy signals have often accompanied inlation targeting in Indonesia.
In positive examples, the government and BI responded impressively in
contain-ing secondary inlationary pressures brought on by administrative price shocks
in 2005, when fuel prices increased. And, at BI’s Bankers’ Dinner of January 2010,
Darmin Nasution, then BI governor, spoke of keeping inlation on its declining
trend until it was as low as that of neighbouring countries, at around 3%. But strong follow-up has been lacking; since the governor’s speech, only once (in
March 2010) has inlation been below 3.5%, and it has averaged nearly 5.0%.44 BI’s
oficial statements indicate continued concern for economic expansion,45 despite
continued GDP growth of around 6.0%. Moreover, the trajectory of current inla
-tion targets indicates no expecta-tion of appreciably lower inla-tion in the next
three years or so (see following paragraph).
A inal point concerns the government’s targets since 2008, or even earlier. Their stability is welcome, but their present proile (igure 5) suggests little commitment to reducing inlation further, even in the outer years. The end-point of the govern -ment’s most recent target (of 3%–5% for 2015), for example, is exactly the same as the government’s target for 2010, which was announced in early 2008.
Fur-ther progress in lowering inlation will rely on strong policies to bring inlation
down to the lower end of these targets, which, as the BI governor noted in 2010, is needed for comparability with Indonesia’s neighbours. Success in this regard still looks a long way off.
44 The former BI governor’s speech is available at <http://www.bi.go.id/web/en/ Ruang+Media/Pidato+Dewan+Gubernur/speech_darmin_bd_2010.htm>.
45 See, for instance, BI’s Monetary Policy Report: Quarter IV 2012, or BI (2011: xxiii).
APPENDIX TABLE A1 Details of Inlation Targets in Indonesia, 2000–15
Target Year(s)
Time Horizon
Target Range Source Notes
2000 1 3%–5% (+ 2%) BI (1999: 15) Add-on is for GOI income and price policies.
2001 1 4%–6% (+ 2%–2.5%) BI (2000: 12) Add-on is for GOI income and price policies.
2002–06 5 2002: 9%–10%; 2006: 6%–7% BI (2001: ix) Very long time horizon; indicative linear path to the 2006 target. Target
changed to headline inlation.
2003–06 4 9% (+/– 1% for 2003) BI (2002: 2, 18) End-point unchanged; time horizon reduced by 1 year. Ambiguous target range for 2003.
2004 1 5.5% (+/– 1%) BI (2004: xviii, 50) Appears to be informal, internal target. Announcements mention only BI’s
projection for 2004. 2005–07 3 2005: 5%–7%; 2006: 4.5%–6.5%;
2007: 4%–6%
MOF Decree 339/KMK.011/2004 Also in BI (2004: 19–20).
2006–08 3 2006: 7%–9%; 2007: 5%–7%; 2008: 4%–6%
BI (2006: 97) Announced 17 March 2006, at a press conference of the economic coordinating minister.
2007–08 2 Unchanged BI (2007: 9, 85) Time horizon shortened by 1 year.
2008–10 3 2008: 4%–6%; 2009: 3.5%–5.5%; 2010: 3%–5%
MOF Decree 1/KMK 011/2008 Also in BI (2007: 85).
2009 2 Unchanged BI (2008: xii, xx, xxii) Refers only to 2009 and to (unspeciied) medium-term target.
2010–14 5 2010: 4%–6%; 2014: 3%–5% BI (2009: xvii); BI press releases referring to 4%–6% for 2011
Long time horizon; few intermediate targets. Target of 3%–5% for 2014
referred to in both English and Bahasa Indonesia reports. 2010–12 3 2010–11: 4%–6%; 2012: 3.5%–5.5%
for 2012
MOF Regulation 143/PMK.011/2010 Targets for 2011 and 2012 also mentioned in BI (2010: xvii).
2011–12 2 Unchanged BI governor’s speech, 21 January 2011 Time horizon shortened by 1 year. 2012–13 2 3.5%–5.5% for both years
(see ‘Notes’ column)
BI (2011: xxxvi) Repeats previous year’s target for 2012; 2013 unchanged. English report refers to target of 3%–5% for 2016; Bahasa Indonesia report does not. 2013–15 3 2013–14: 3.5%–5.5%; 2015: 3%–5% MOF Regulation 66/PMK.011/2012 See also <http://www.bi.go.id/web/id/Moneter/Inlasi/Bank+
Indonesia+dan+Inlasi/penetapan.htm>
2013 1 3.5%–5.5% BI governor’s speech, 23/11/2012 No mention of outer years.
REFERENCES
Alamsyah, H., Joseph, C., Agung, J. and Zulverdy D. (2001) ‘Framework for implementing inlation targeting in Indonesia’, Bulletin of Indonesian Economic Studies 37 (3): 309–24. BI (Bank Indonesia) (1999–2002) Annual Report, BI, Jakarta.
BI (Bank Indonesia) (2003–11) Economic Report on Indonesia, BI, Jakarta.
BI (Bank Indonesia) (2004a) ‘Bank Indonesia and government sign mechanism for targeting, monitoring, and control of inlation in Indonesia’, Press release, 1 July, available at <http://www.bi.go.id/web/en/Ruang+Media/Siaran+Pers/press010704.htm>. Blinder, A.S. (2000) ‘Central-bank credibility: why do we care? How do we build it?’,
Amer-ican Economic Review 90 (5): 1421–31.
Burke, P.J. and Resosudarmo, B.P. (2012) ‘Survey of recent developments’, Bulletin of Indo-nesian Economic Studies 48 (3): 299–324.
Cameron, L. (1999) ‘Survey of recent developments’, Bulletin of Indonesian Economic Studies 35 (1): 3–40.
Chowdhury, A. and Ham, R. (2009) ‘Inlation targeting in Indonesia: searching for a thresh-old’, Singapore Economic Review 54 (4): 645–55.
Filardo, A. and Guinigundo, D. (2008) ‘Transparency and communication in monetary policy: a survey of Asian central banks’, Paper prepared for the Bangko Sentral ng Pilipinas – Bank for International Settlements (BSP-BIS) Research Conference on Trans-parency and Communication in Monetary Policy, Manila, 1 February.
Filardo, A. and Genberg, H. (2010) ‘Targeting inlation in Asia and the Paciic: lessons from the recent past’, BIS Papers 52: 251–73.
Friedman, M. (1969) The Optimum Quantity of Money, Aldine Publishing Company, Chi-cago.
Gali, J. (2008) Monetary Policy, Inlation and the Business Cycle: An Introduction to the New
Keynesian Framework, Princeton University Press, Princeton.
Ginting, E. (2003) ‘The state inance law: overlooked and undervalued’, Bulletin of Indone-sian Economic Studies 39 (3): 353–7.
Grenville, S and Ito, T. (2010) An Independent Evaluation of the Bank of Thailand’s Monetary
Pol-icy under the Inlation Targeting Framework, 2000–2010. Consultants’ report, available at <http://www.bot.or.th/Thai/MonetaryPolicy/Documents/GrenvilleItoV10(Oct22). pdf>.
Goeltom, M.S. (2007) Essays in Macroeconomic Policy: The Indonesian Experience, PT Grame-dia Pustaka Utama, Jakarta.
Hammond, G. (2012) State of the Art in Inlation Targeting, Handbook No. 29, Centre for Central Banking Studies, Bank of England, London.
Hossain, A.A. (2012) Macroeconomic and Monetary Policy Issues in Indonesia, Routledge, New York.
IMF (International Monetary Fund) (2012), World Economic Outlook, October, IMF, Wash-ington.
Kong, T. and Ramayandi, A, (2008) ‘Survey of recent developments’, Bulletin of Indonesian Economic Studies 44 (1): 7–32.
Marks, S.V. (2004) ‘Survey of recent developments’, Bulletin of Indonesian Economic Studies 40 (2): 151–75.
McLeod, R.H. (2005) ‘Survey of recent developments’, Bulletin of Indonesian Economic Stud-ies 41 (2): 133–57.
Patunru, A.A. and Von Luebke, C. (2010) ‘Survey of recent developments’, Bulletin of Indo-nesian Economic Studies 46 (1): 7–31.
Roger, S. (2009) ‘Inlation targeting at 20: achievements and challenges’, IMF Working Paper 09/236, IMF, Washington DC.
Sarwono, H.A. (2007) ‘Monetary policy in emerging markets: Indonesia’s case’, paper pre-sented at the OECD-CCBS seminar on Monetary Policy in Emerging Markets, Paris, 28 February.
Sen, K. and Steer, L. (2005) ‘Survey of recent developments’, Bulletin of Indonesian Economic Studies 41 (3): 279–304.
Sugema, I. and Bakhtiar, T. (2010) ‘Monetary policy in managing inlation in Indonesia: a linear rational expectations model’, European Journal of Scientiic Research 41: 145–216. Svensson, L. (2009) ‘Evaluating monetary policy’, Sveriges Riksbank Working Paper Series
No. 235, Sveriges Riksbank, Stockholm.