Full Terms & Conditions of access and use can be found at
http://www.tandfonline.com/action/journalInformation?journalCode=vjeb20
Download by: [Universitas Maritim Raja Ali Haji], [UNIVERSITAS MARITIM RAJA ALI HAJI Date: 12 January 2016, At: 17:59
Journal of Education for Business
ISSN: 0883-2323 (Print) 1940-3356 (Online) Journal homepage: http://www.tandfonline.com/loi/vjeb20
Factors That Motivate Business Faculty to Conduct
Research: An Expectancy Theory Analysis
Yining Chen , Ashok Gupta & Leon Hoshower
To cite this article: Yining Chen , Ashok Gupta & Leon Hoshower (2006) Factors That Motivate Business Faculty to Conduct Research: An Expectancy Theory Analysis, Journal of Education for Business, 81:4, 179-189, DOI: 10.3200/JOEB.81.4.179-189
To link to this article: http://dx.doi.org/10.3200/JOEB.81.4.179-189
Published online: 07 Aug 2010.
Submit your article to this journal
Article views: 278
View related articles
ABSTRACT. In this study, the authors used expectancy theory to examine key fac-tors that motivate business faculty to con-duct research. The survey results, from 320 faculty members at 10 business schools, showed that faculty members who assign higher importance ratings to both the extrinsic and the intrinsic rewards of research exhibit higher research productivi-ty. Study findings suggest that: (a) untenured faculty members are motivated by extrinsic rewards; (b) tenured faculty members are motivated by intrinsic rewards; (c) research productivity is posi-tively correlated with tenure status and the percentage of work time allocated to research activities and negatively correlated with years in academic employment; (d) there is no relationship between research productivity and academic discipline; and (e) there is no relationship between research productivity and gender.
Copyright © 2006 Heldref Publications
cademic institutions classified as research universitiesare often per-ceived as indicative of having quality programs, faculty, and students (Hu & Gill, 2000). As higher education institu-tions compete with each other for resources, being known as a research institution is becoming increasingly important. Hermanson, Hermanson, Ivancevich, and Ivancevich (1995) noted that many schools, which were formerly thought of as teaching oriented, required publications in refereed journals for tenure and promotion. Because scholar-ly activities and research productivity are used to measure the success of insti-tutions, it is becoming increasingly important for faculty to be more produc-tive in research. Thus, an individual fac-ulty member’s compensation, promotion and tenure, prestige, and marketability are very much related to his or her research productivity.
There are two streams of research on faculty research productivity. In the first stream, researchers examined the changes of research publication require-ments in faculty tenure and promotion decisions (Campbell & Morgan, 1987; Cargile & Bublitz, 1986; Englebrecht, Iyer, & Patterson, 1994; Milne & Vent, 1987; Read, Rama, & Raghunandan, 1998; Schultz, Meade, & Khurana, 1989). Those researchers have docu-mented that publication requirements for promotions and tenure have increased
over time. In the second stream of research, researchers (Buchheit, Collins, & Collins, 2001; Hu & Gill, 2000) have examined individual or institutional fac-tors that most significantly influence the research productivity of faculty mem-bers. Certainly, personal characteristics like intelligence, insight, curiosity, and work ethics have an influence, but other observable and systematic traits can also be important indicators of scholarly achievement. Many of the prior studies that examined influential factors of research productivity were based on anecdotal evidence (e.g., personal opin-ions or experiences; Fox, 1985; McK-eachie, 1979). The few studies (Bridge-water, Walsh, & Walkenbach, 1982; Holly, 1977; Tien & Blackburn, 1996) in which researchers provided empirical evidence regarding faculty members’ perceptions of research productivity and their motivation to conduct research were limited in external validity by using a small sample from a specific field or in internal validity by lacking a theoretical base.
Expectancy theory (Vroom, 1964) provides this theoretical basis. It con-structs a conceptual framework of moti-vation as well as a measurable mathe-matical model. In this study, we applied expectancy theory to 10 college of busi-ness faculties to provide a better under-standing of the faculties’ behavioral intentions (motivation) to do research.
Factors That Motivate Business
Faculty to Conduct Research:
An Expectancy Theory Analysis
YINING CHEN ASHOK GUPTA LEON HOSHOWER OHIO UNIVERSITY ATHENS, OHIO
A
Perspective Behavioral Theories A number of theories have been pro-posed to explain individual motivation to perform. Equity theory (or theory of fair exchange; Adams, 1963) and expectancy theory (Vroom, 1964) are the two theories most widely used in the research literature. According to equity theory, a person compares his or her inputs into the situation and outcomes from the situation (Outcomes A/Inputs A) with a similar ratio of a referent other (Outcomes B/Inputs B). Inequity exists when the perceived ratios of out-puts to inout-puts for a person and his or her referent are unequal (Adams). Perceived inequity is the source of motivation to act to restore equity or fairness in the exchange. Equity theory has been suc-cessfully applied to study consumer dis-satisfaction, brand and retailer switch-ing, consumer complaining behavior, negative word of mouth communica-tion, and several other marketing and social exchange situations.
Expectancy theory has been recog-nized as one of the most promising conceptualizations of individual moti-vation (Ferris, 1977). Many researchers (Ajzen & Fishbein, 1980; Brownell & McInnes, 1986; Ferris; Hancock, 1995; Warshaw, 1980) have proposed that expectancy theory can provide an appropriate theoretical framework for research that examines an individual’s acceptance of and intention to use a system (DeSanctis, 1983). However, empirical research employing expectancy theory within an academe has been limited. This study uses expectancy theory to examine fac-ulties’ motivation to conduct research.
Expectancy models are cognitive explanations of human behavior that cast people as active, thinking, predict-ing creatures in their environments. They continuously evaluate the out-comes of their behavior and subjective-ly assess the likelihood that each of their possible actions will lead to various out-comes. The choice of the amount of effort people exert is based on a system-atic analysis of (a) the values of the rewards from these outcomes, (b) the likelihood that rewards will result from these outcomes, and (c) the likelihood of attaining these outcomes through their actions and efforts.
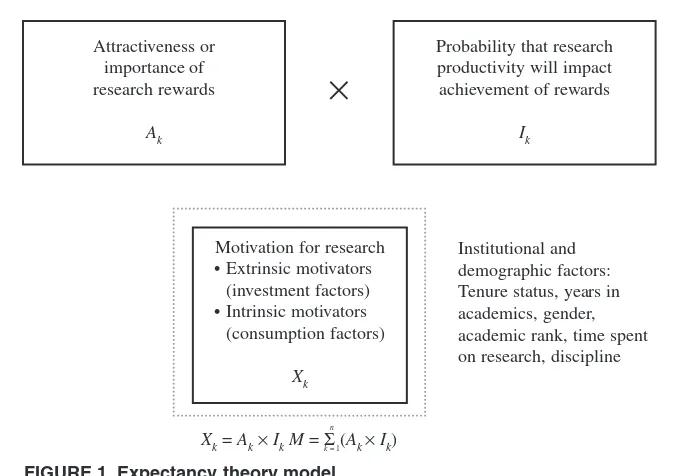
According to Vroom (1964), expectancy theory shows that the over-all Motivation (M) of a faculty member to conduct research is the summation of the products of the attractiveness of var-ious individual outcomes associated with research (Ak) and the probability that research will produce those out-comes (Ik), which is expressed by the equation:
where M = motivation for conducting research; Ak= attractiveness (or value or importance) of outcome k associated with research productivity; and Ik= the perceived probability (or impact) that being productive in research will lead to outcome k.
In our application of the expectancy theory (see Figure 1), faculty members evaluated the attractiveness of 13 possi-ble outcomes resulting from performing research. They then considered the likeli-hood that each of these outcomes would occur. According to expectancy theory, multiplying the attractiveness of each outcome by the probability of its occur-rence and then adding the resulting prod-ucts yields total motivation to conduct research. On the basis of this systematic analysis, the faculty members deter-mined how much effort they would like to exert in conducting research.
Research Objectives
Although many prior researchers (Buchheit et al., 2001; Cargile & Bublitz, 1986; Chow & Harrison, 1998; Fox, 1985; Hu & Gill, 2000; McK-eachie, 1979) examined factors that influence research productivity, few have examined faculty members’ per-ceptions of these factors from a behav-ioral perspective and how their percep-tions are translated into the motivation to exert themselves to publish. In the current study, we employed expectancy theory to examine the motivational fac-tors and their relationship with actual research productivity in a constructive manner. By successful application of expectancy theory, we were able to pro-vide a better understanding of the behavioral intention (motivation) of fac-ulty members’ devotion to research. We then examined the relationship of
these motivational factors to actual research productivity.
Literature Review
Factors Influencing Research Productivity
Researchers have examined the factors that most significantly influence the research productivity of faculty members (Cargile & Bublitz, 1986; Diamond, 1986; Goodwin & Sauer, 1995; Hu & Gill, 2000; Levitan & Ray, 1992). Some scholars believe that promotion has a motivating effect on research productivi-ty: For instance, Fox (1985) suggested that higher education institutions can influence faculty research behavior through the manipulation of the reward structure for promotion. However, other researchers have insisted that faculty pub-lish not for external rewards but because they enjoy the process of inquiry (e.g., McKeachie, 1979). In summary, prior studies identified two categories of per-sonal motivational factors that drive aca-demic research: Investment factors, or extrinsic rewards (e.g., income increase, tenure, promotion), and consumption fac-tors, or intrinsic rewards (e.g., an individ-ual’s personal satisfaction from solving research puzzles, contributing to the dis-cipline, achieving peer recognition).
In addition to personal motivation, other factors also have a substantial influence on faculties’ research produc-tivity. One well-established research productivity theory, Life-Cycle theory (Hu & Gill, 2000), suggests that, in gen-eral, the research productivity of a researcher rises sharply in the initial stages of a career, peeks at the time of tenure review, and then begins a decline. Pretenure research productivity is dom-inated by investment factors and post-tenure productivity by consumption fac-tors. Researchers in prior studies (Buchheit et al., 2001; Cargile & Bublitz, 1986; Chow & Harrison, 1998) have identified the following factors as influencing research productivity: (a) tenure status, (b) the allocation of work-ing time to research activities, (c) length of the tenure probationary period, (d) teaching loads, and (e) financial research support.
Our objective was to investigate the impact of the various potential rewards from research on faculty motivation. The 13 rewards we tested in this study included 6 extrinsic and 6 intrinsic rewards. The 6 extrinsic rewards were (a) receiving or having tenure, (b) being full professor or receiving promotion, (c) getting better salary raises, (d) get-ting an administrative assignment, (e) getting a chaired professorship, and (f) getting a reduced teaching load. The 6 intrinsic rewards were (a) achieving peer recognition, (b) getting respect from students, (c) satisfying a personal need to contribute to the field, (d) satis-fying a personal need for creativity or curiosity, (e) satisfying a personal need to collaborate with others, and (f) satis-fying a personal need to stay current in the field. The 13th reward, the ability to find a better job at another university, could be an extrinsic reward because a better job would likely translate into more pay, better research support, and a lower teaching load. However, a better job could also mean higher status, which is an intrinsic reward. Conse-quently, we segregated this reward from the other 6 extrinsic rewards because, unlike the others, it cannot be part of the reward system of the faculty member’s current university. We compiled this group of 13 factors from previous liter-ature and a pilot study, which asked a
focus group of 20 business professors to list motivational factors other than those identified by prior literature.
Our second objective was to discover whether there was similarity between tenured versus untenured faculty in their preferences of the rewards for research productivity or whether they have dif-ferent motivations to conduct research. Our third objective was to examine the impact of influential institutional and other factors (e.g., tenure status, years of academic employment, percentage of working time allocated to research activities, academic discipline, and gen-der) on research productivity.
On the basis of the literature reviewed and research objectives discussed above, we developed the following research propositions:
Proposition 1: There is a positive correla-tion between research productivity and motivation for rewards. Those who show higher total motivation for research rewards display better research perfor-mance than otherwise.
Proposition 2: Pretenure research produc-tivity is dominated by investment (extrin-sic) factors and posttenure productivity by consumption (intrinsic) factors.
Proposition 2a: Among untenured facul-ty, there is a positive correlation between research productivity and motivation for extrinsic rewards. Those who show higher motivation for extrinsic rewards display better research performance.
Proposition 2b: Among tenured faculty, there is a positive correlation between research productivity and motivation for intrinsic rewards. Those who show higher motivation for intrinsic rewards display better research performance.
Proposition 3: There is a relationship between research productivity and institu-tional and other factors.
Proposition 3a: There is a positive rela-tionship between research productivity and tenure.
Proposition 3b: There is a negative relationship between research produc-tivity and years in academics.
Proposition 3c: There is a positive rela-tionship between research productivity and time allocated for research activities.
Proposition 3d: There is no relationship between research productivity and aca-demic discipline.
Proposition 3e: There is no relationship between research productivity and gender. To measure the relationship between motivation and research productivity, it is important to define research produc-tivity. Doctoral-granting colleges of business and non-doctoral-granting col-leges differ widely in their perception of acceptable publication outlets. Includ-ing both types of colleges in the sample would distort the measure of research productivity. For example, within a given time, seven journal articles at a non-doctoral-granting college of busi-ness would likely represent more research productivity than seven articles in the same journals at a doctoral-grant-ing college of business. However, doc-toral-granting colleges are more likely to have a more restrictive list of which journals count than are non-doctoral-granting universities. Thus, it would be difficult to compare both quantity and quality of research between these two types of schools. To avoid this measure-ment problem and to increase our power to discern the relationship between research productivity and motivation, we structured the sample to include sim-ilar schools of business.
METHOD
We collected the data set for this study via a mail survey, which is shown in the Appendix. We mailed the ques-tionnaire in February of 2004 to 670
FIGURE 1. Expectancy theory model.
Attractiveness or importance of research rewards
Ak
Probability that research productivity will impact achievement of rewards
Ik
Institutional and demographic factors: Tenure status, years in academics, gender, academic rank, time spent on research, discipline
×
Xk= Ak×IkM= Σ (k= 1Ak ×Ik) n
Motivation for research • Extrinsic motivators
(investment factors) • Intrinsic motivators (consumption factors)
Xk
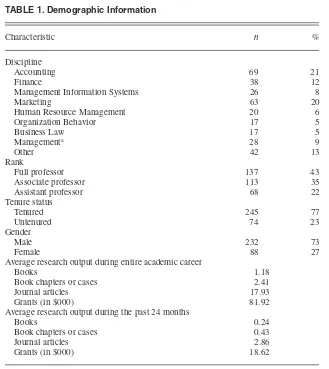
business faculty members of 10 mid-western universities with a balanced teaching and research mission. These 10 universities are Carnegie Research Classification II research universities that do not offer PhD programs in the business college. They have similar research expectations and academic standards. We omitted non-tenure-track faculty from the sample. Between the original mailing and the one reminder mailing, we received 320 usable questionnaires, representing a 48% response rate. In the question-naire, we collected information such as academic discipline, gender, time allo-cated to research, academic rank, tenure status, research output during entire academic career, and research output during the past 24 months (see Table 1). In the questionnaire, faculty members also evaluated the importance
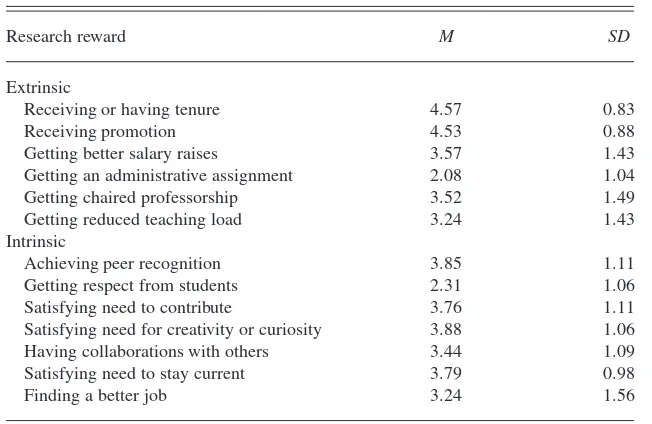
of the 13 research rewards (Ak) to them (Table 2), and their perceived probabil-ity that research productivprobabil-ity would result in each of the 13 rewards at their respective colleges of business (Ik; see Table 3).
RESULTS
Research Productivity and Motivation for Research Rewards
Table 4 shows Pearson’s correlation coefficients between faculty motivation to conduct research and various mea-sures of research productivity. Faculty motivation to conduct research (M) was measured by multiplying the impor-tance of each research reward (Ak) by the probability of achieving that reward through research (Ik) and then summing the resulting 13 products.
We measured actual research produc-tivity by the number of books published, number of book chapters or cases pub-lished, number of refereed journal arti-cles published, and dollar amount of grants received. We used two time peri-ods to measure the outputs: academic career to date and in the 24 months prior to the study. The correlations between research motivation and total journal articles published (Y3) and journal arti-cles published in the past 24 months (Y7) were both positive and significant at the .01 level. The other measures of research productivity (i.e., grants, books, and chapters in books) were not significantly correlated with research motivation at the .05 level and were omitted from further analysis. This result supported Proposition 1, that fac-ulty who show higher motivation for research rewards display better research performance in terms of publication of journal articles both in the short term and the long term.
For untenured faculty, the correlation between extrinsic motivation (ME) and journal articles published in the past 24 months was significant at the .01 level. No other correlations were significant. There were no significant correlations between intrinsic motivation and research productivity for untenured fac-ulty. This generally supported Proposi-tion 2a, that untenured faculty are moti-vated by extrinsic rewards, and those untenured faculty members who show higher extrinsic motivation display bet-ter research performance in bet-terms of journal articles published in the past 24 months.
Table 4 shows that the intrinsic moti-vation (MI) of tenured faculty was posi-tively and significantly correlated well
TABLE 1. Demographic Information
Characteristic n %
Discipline
Accounting 69 21
Finance 38 12
Management Information Systems 26 8
Marketing 63 20
Human Resource Management 20 6
Organization Behavior 17 5
Business Law 17 5
Managementa 28 9
Other 42 13
Rank
Full professor 137 43
Associate professor 113 35
Assistant professor 68 22
Tenure status
Average research output during entire academic career
Books 1.18
Book chapters or cases 2.41
Journal articles 17.93
Grants (in $000) 81.92
Average research output during the past 24 months
Books 0.24
Book chapters or cases 0.43
Journal articles 2.86
Grants (in $000) 18.62
Note. N= 320; average time spent in research = 29%; average number of years of academic employment = 17.02.
aManagement includes decision science, production, operations management, and quantitative
business analysis.
beyond the .01 level with both journal publications within the past 24 months and lifetime journal publications. Intrin-sic motivation of tenured faculty was also positive, but not significant at the .05 level, for the other six measures of research productivity (not shown in Table 4). There were no significant cor-relations between extrinsic motivations of tenured faculty and any measure of research productivity. These results sup-port Proposition 3b, that tenured faculty members’ research activities are moti-vated by intrinsic rewards. Those tenured faculty members who have high-er intrinsic motivation display betthigh-er research performance in terms of greater number of published journal articles in the short term as well as the long term.
Research Productivity and Tenure
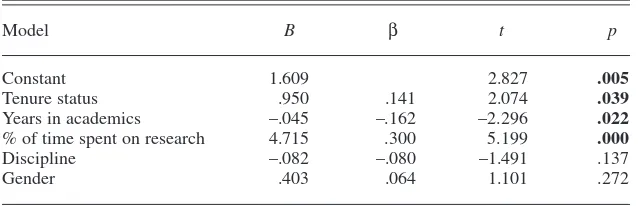
To determine the effect of the demo-graphic and institutional factors on research productivity, we estimated a linear regression model. We used journal articles published within the past 24 months (Y7) as the measure of research productivity, which was the dependent variable. This measure of research pro-ductivity had the highest correlation with research motivation (see Table 4) across both tenured and untenured facul-ty. The five independent variables were (a) tenure status, (b) years of academic employment, (c) percentage of time spent in research, (d) academic disci-pline, and (e) gender. There was a good fit between the observed data and the model,F(5, 315) = 7.984,p < .0001.
The regression results in Table 5 show that there was a significant positive rela-tionship between tenure status and research productivity. The regression
TABLE 2. Importance of Research Rewards to Faculty
Research reward M SD
Extrinsic
Receiving or having tenure 4.53 1.12
Receiving promotion 4.28 1.11
Getting better salary raises 4.18 1.09
Getting an administrative assignment 1.90 1.12
Getting chaired professorship 2.80 1.48
Getting reduced teaching load 3.40 1.34
Intrinsic
Achieving peer recognition 3.68 1.13
Getting respect from students 3.53 1.28
Satisfying need to contribute 3.76 1.06
Satisfying need for creativity or curiosity 4.06 1.02
Having collaborations with others 3.56 1.08
Satisfying need to stay current 3.99 0.95
Finding a better job 2.76 1.46
Note.Responses were rated on a scale of 1 = not important at allto 5 = very important.
TABLE 3. Faculty’s Perceived Impact of Research Productivity on Achieving Various Rewards
Research reward M SD
Extrinsic
Receiving or having tenure 4.57 0.83
Receiving promotion 4.53 0.88
Getting better salary raises 3.57 1.43
Getting an administrative assignment 2.08 1.04
Getting chaired professorship 3.52 1.49
Getting reduced teaching load 3.24 1.43
Intrinsic
Achieving peer recognition 3.85 1.11
Getting respect from students 2.31 1.06
Satisfying need to contribute 3.76 1.11
Satisfying need for creativity or curiosity 3.88 1.06
Having collaborations with others 3.44 1.09
Satisfying need to stay current 3.79 0.98
Finding a better job 3.24 1.56
Note.Responses were rated on a scale of 1 = strongly disagreeto 5 = strongly agree.
TABLE 4. Pearson Product–Moment Correlations Between Faculty Motivation for Research and Research Productivity Measures
All faculty Untenured faculty Tenured faculty
(N= 320) (n= 74) (n= 245)
Overall Extrinsic Intrinsic Extrinsic Intrinsic
motivation (MO) motivation (ME) motivation (MI) motivation (ME) motivation (MI)
Productivity measure r p r p r p r p r p
Journal articles published .159 .006 .127 .294 .048 .691 .064 .329 .270 .000
Articles published in past 24 months .197 .001 .283 .010 .044 .712 –.020 .762 .239 .000
coefficient for the tenure status variable was positive (0.950) and significantly different from zero, p= .039 level. On the basis of this result, we concluded that our data supported Proposition 3a. This is consistent with the findings of Lane, Ray, and Glennon (1990) on sta-tisticians, Levitan and Ray (1992) on accounting faculty, and Hancock, Lane, Ray, and Glennon (1992) on manage-ment science researchers, which suggest that tenured faculty members are more productive than those without tenure.
Research Productivity and Years in Academics
The life-cycle model (Diamond, 1986) predicts that faculty research pro-ductivity will decline as an individual’s academic experience increases. In Table 5, the estimated regression coefficient of the variable years of academic employ-ment was negative (−.045), which is sig-nificantly different from zero (p= .022). One plausible reason for this decline in research productivity is the decline of extrinsic motivation as a result of attain-ment of tenure and promotion and the proximity of retirement. Another factor may be that senior faculty members tend to have more service and administrative responsibilities, which may hinder their research productivity. Overall, we can conclude that Proposition 3b was sup-ported by our data.
Research Productivity and Time Allocated to Research
Researchers have shown previously that research productivity depends heavily on how much time one spends
on research-related activities (Hancock et al., 1992; Lane et al., 1990). That is, faculty who display higher research pro-ductivity allocate more time to research activities. Our data in Table 5 show the same pattern. The regression coefficient for the percentage of time spent on research was positive (4.715) and sig-nificant, p < .0001. In fact, the beta coefficient for percentage of time spent on research was the highest, indicating this was the most important variable in the model. Thus, we concluded that our data supported Proposition 3c.
Research Productivity and Academic Discipline
In examining whether research pro-ductivity differs across disciplines within the business schools of our data set, we found that the regression coef-ficient for discipline was not signifi-cantly different from zero at the .05 alpha level, p = .137 (see Table 5). Thus, we could not reject Proposition 3d and did not find a difference in research productivity among faculty from the various disciplines.
Research Productivity and Gender
In examining whether research pro-ductivity differed between male and female faculty of our data set, we found that the regression coefficient for gender was not significantly different from zero at the .05 level (p= .272). Thus, we con-cluded that Proposition 3e could not be rejected by our data. We were unable to find a relationship between gender and research productivity.
Effect of Institutional and Other Factors
Researchers (Buchheit et al., 2001; Hu & Gill, 2000; Tien, 2000) have pre-viously shown that faculty research pro-ductivity was a result of the interaction among many endogenous and exoge-nous variables, including individual per-sonal characteristics; academic disci-pline; educational background; previous employment; institutional characteris-tics; and teaching, research, and service assignments. All of our subjects were from Carnegie Research Category II non-doctoral-granting colleges of busi-ness where many of the institutional variables or factors were similar. This enabled us to focus on personal motiva-tional factors, which were the target of our study. As a further simplification, we set our research objective to be iden-tifying the variables that may have a sig-nificant effect on research productivity rather than quantifying such effects on the productivity. For that reason, we chose a general linear regression model as the most appropriate tool for the analysis. The regression model can be expressed as:
where Yis the dependent variable,Xi(i = 1, 2 … n) are the independent vari-ables, and βi (i = 1, 2 … n) are the regression coefficients.
In establishing the regression model, we used the self-reported research pro-ductivity data collected from the ques-tionnaire on refereed journal articles published in the past 24 months (Y7) as the dependent variable. We calculated the 13 independent motivational vari-ables as the product of Ak(attractiveness of reward k associated with research productivity), which we collected from Section 1 of the questionnaire, and Ik (perceived probability that being pro-ductive in research would have an impact on outcome k), which was col-lected from Sections 2 and 3 of the questionnaire. To test whether there was an order effect, we prepared the ques-tionnaire in two versions, with the 13 variables arranged in different orders. The results from the two versions did not differ significantly, which indicated
TABLE 5. Effect of Demographic and Institutional Factors on Faculty Research Output
Model B β t p
Constant 1.609 2.827 .005
Tenure status .950 .141 2.074 .039
Years in academics –.045 –.162 –2.296 .022
% of time spent on research 4.715 .300 5.199 .000
Discipline –.082 –.080 –1.491 .137
Gender .403 .064 1.101 .272
Note. Dependent variable: Journal articles published in past 24 months; independent variables: Tenure status, years in academics, percentage of time spent on research, discipline, gender. F(5, 309) = 7.984. R2= 0.114. Bold pvalues are significant at .05 level.
no order effect. The questionnaire used for the study can be found in the Appen-dix. In addition to the motivational vari-ables (X1 to X13), discipline (X14), per-centage of time devoted to research (X15), gender (X16), years in academic career (X17), and academic rank (X18) were included in the stepwise regres-sions as controlled factors for two sepa-rate analyses—one for the tenured and the other for untenured faculty.
Because the independent variables may not be independent from each other and, therefore, correlation may be present among them, we adopted a stepwise regression with a selection cri-terion of Cronbach’s alpha = .10. In doing so, only the independent vari-ables that have a significant contribu-tion at the .10 alpha level can enter into the regression. Table 6 shows the para-meter estimates and model statistics for the stepwise regression models. The independent variables are listed by the order that they enter into the stepwise regression.
Table 6 shows model statistics for two regressions, tenured faculty and untenured faculty. For each regression model, the Fstatistic was significant,p<
.01. This indicated a good fit between the observed data and the models, and the independent variables are related to the dependent variable. Furthermore, we found that R2ranges from .140 to .141,
which indicated that about 14% of the variation in the number of journal arti-cles faculty published in the preceding 24 months was explained by the inde-pendent variables. Given the large sam-ple size and the great heterogeneity of the respondents, these R2 values should
be considered satisfactory.
In terms of which variables con-tributed most to explain the variance in publication of journal articles, we observed that, after controlling for the effects of demographic and institutional variables, the three factors that had the most impact on explaining the variability in number of journal articles published in the past 24 months by tenured faculty were percentage of time spent on research, motivation to contribute to the field, and years in academics, in that order. The greater the percentage of time that tenured faculty members spent on research and the more motivated they were to make a contribution to the field, the more articles they published.
Regres-sion coefficients for both variables were positive and significant at .05 alpha lev-els. However, research productivity declined with the length of time a faculty member stayed in academics. The regres-sion coefficient associated with X17was negative and significant at the .05 alpha level.
The desire for tenure (mean impor-tance rating of 4.53 out of 5) and pro-motion (mean importance rating of 4.28 out of 5) was great for all untenured fac-ulty regardless of their research produc-tivity and, thus, did not explain variation in research productivity. However, vari-ation in research productivity in terms of number of journal articles published in the past 24 months was most explained by professors’ ambition to get chaired professorships and by the num-ber of years they had been untenured. Those who were more motivated by the prospect of becoming a chaired profes-sor and those who had waited longer in the tenure pipeline had published more within the past 24 months. Regression coefficients for both these variables were positive and significant at the .05 alpha level. Because those who had been untenured longer were, presum-ably, closer to the tenure decision, they would have responded to the reward of tenure and the punishment of denial of tenure more strongly than would faculty who were further away from the tenure decision.
DISCUSSION
Effective Use of Tenure and Promotion
There are two aspects to the motiva-tional strength of any reward. Those fac-tors are the value of the reward to the individual and the probability that the reward will occur if the individual is successful in achieving the goal to which the reward is attached. Of the 13 motivations examined in this study, fac-ulty ranked tenure and promotion, respectively, as their two most valued rewards. They also assigned the highest probabilities to these rewards; of the 13 rewards, the faculty believed that research productivity would most likely lead to the rewards of tenure and pro-motion. This made having or receiving
TABLE 6. Motivators of Journal Article Publications: A Stepwise Regression Analysis
Independent variable B β t p
Tenured facultya
Constant 1.642 2.502 .013
% of time spent on research (X15) 3.955 0.218 3.166 .002 Motivation to contribute to field (X9) 0.073 0.174 2.563 .011 Years in academics (X17) –0.045 –0.137 –2.150 .033
Untenured facultyb
Constant 1.102 1.582 .119
Motivation to get chaired professorship (X5) 0.112 0.298 2.497 .015
Years in academics (X17) 0.133 0.280 2.346 .022
Note. Dependent variable: Journal articles published in past 24 months (Y7); independent variables:
Receiving or having tenure (X1), receiving promotion (X2), getting better salary raise (X3), getting administrative assignment (X4), getting chaired professorship (X5), getting reduced teaching load
(X6), achieving peer recognition (X7), getting respect from students (X8), satisfying need to con-tribute (X9), satisfying need for creativity (X10), having collaborations with others (X11), satisfying
need to stay current (X12), finding a better job (X13), discipline (X14), % of time spent on research (X15) gender (X16), years of academic employment (X17). X1to X13are the importance or
attrac-tiveness of the reward (Ak) multiplied by the perceived probability (Ik) that being productive will have a high impact on receiving that reward. Therefore,Xk= Ak×Ik. In this survey, the maximum score is 25 (5 × 5) and the minimum is 1 (1 × 1).
aF(3, 218) = 11.999,p< .000,R2= .141; number of observations = 222. bF(2, 61) = 5.034,p<
.009,R2= .140; number of observations = 64.
tenure and promotion the two highest motivational factors. By making the link between research productivity and the rewards of tenure and promotion so clear in the minds of faculty, universi-ties are using these rewards very effec-tively to motivate research productivity. However, the stepwise regressions did not show that the rewards of tenure and promotion were the most important fac-tors in explaining the variations in num-ber of publications among faculty. We supposed that this was because all fac-ulty were highly motivated by tenure and promotion and the standard devia-tion of the force of this motivadevia-tion was relatively low. Thus, the difference in number of publications was explained by other factors. For example, all pro-fessional athletic coaches want to win. Consequently, the will to win may not be an important factor in explaining the variations in the win–loss records of coaches. However, this does not mean that the will to win is not critical.
Occasionally, legislators and other public figures question the value of the tenure system in academe. They suggest that, once tenured, faculty members cannot be fired whether they work or not. Consequently, tenured faculty members have little incentive to per-form and may become semiretired while still employed by the university. This scenario seems plausible. However, the data gathered by this study show the opposite. As shown in Table 6, tenured status is significantly and positively related to the number of journal articles accepted or published by tenure-tracked faculty within the past 24 months.
Ineffective Use of Pay Raises
Faculty ranked getting better pay raises as their third most valued reward. However, their subjective probability of receiving pay raises from achieving research productivity ranked 7th out of 13. Universities have not established a strong link in the minds of their faculty between research productivity and the reward of pay raises. Thus, the motiva-tional effect of the pay raise system is limited. Universities could, therefore, increase the motivational impact of salary raises by making a clearer link between raises and research productivi-ty. One possibility is to assure faculty
that they will receive a raise in a partic-ular amount (e.g., $1,000 raise) for each journal article published in a predeter-mined list of journals. Colleges of busi-ness could fund these pay raises by deducting the total amount of these pub-lication-based pay raises from their annual raise pool. The remainder of the raise pool could then be distributed as before.
Unexpected Consequences of the Annuity Pay Raise System
Typically, universities give annual pay raises, which then become part of pro-fessors’ base pay. This increase in base pay continues throughout the careers of the professors, provided that they remain at the university. Thus, each annual pay increase is effectively an annuity. Conse-quently, faculty members could still be receiving rewards when aged 60 years for research that was published when they were aged 45 years. Such a system inadvertently gives a greater incentive to faculty members who are both young and intend to stay at the university for a long time. In contrast, faculty who are close to retirement have fewer years to reap the rewards of any increase in annu-al base pay and, therefore, effectively receive a lesser monetary reward for research productivity.
Another, and perhaps related, finding is that the number of articles published within the past 24 months decreases with years in academe. One reason for that may be that abilities and energy decrease with age. Another reason that publications decrease might be that senior faculty members typically have greater service requirements. However, a contributing factor to this observed decrease in research productivity with longevity in academe might be the “annuity” pay raise system. With longevity, a greater proportion of faculty members’ pay is derived from past increases in base pay, which were pre-sumably linked to past accomplish-ments. The benefits from any current or future pay raises simultaneously decrease because older faculty members have fewer years to reap the benefit of the annual increase in base pay. Perhaps the pay system is partially responsible for the decrease in older faculty’s research productivity.
One alternative to the current pay raise system is to give large one-time bonuses for research productivity (i.e., publication) and smaller base increases. A bonus-based system would reward faculty with a single, relatively large monetary reward for research produc-tivity. Such a system would reward all faculty equally rather than giving de facto greater rewards to younger faculty.
Time Spent Doing Research
The number of journal articles pub-lished or accepted within the past 24 months is significantly (p< .001) relat-ed to the percentage of work time that faculty members spent on research. Fac-ulty may increase the percentage of work time devoted to research by work-ing additional hours and dedicatwork-ing those additional hours to research. Thus, increased publications may come purely from additional effort. However, faculty members could also increase the per-centage of their time devoted to research by decreasing their teaching and service hours and substituting these additional hours to research. Future research could examine the extent, if any, of the substi-tution effect suggested earlier. If the hours substituted from teaching and ser-vice are meaningfully large, administra-tors should modify their research requirements in light of their college mission’s balance of teaching and research.
Conclusion
In this study, we employed expectan-cy theory (Vroom, 1964) to examine the impact of various motivational factors on faculty research productivity. Our faculty survey data shows that faculty with higher total (both intrinsic and extrinsic) motivation for rewards pub-lished significantly more articles within the 24 months prior to the study and over their careers than did those with lower motivation for rewards. However, the category of motivation differs with tenure status. Tenured faculty members are motivated more by intrinsic motiva-tional rewards, whereas untenured fac-ulty are more motivated by extrinsic rewards.
Tenure and promotion are potent motivators of faculty research
tivity, whereas pay raises are insuffi-ciently linked to research productivity to be a good incentive. After controlling for other institutional and motivational factors, we found the number of journal articles published in the 24 months prior to the study was (a) positively related to tenured status, (b) negatively related to years in academe, and (c) positively related to the percentage of working time a faculty member allocates to research activities.
NOTE
Correspondence concerning this article should be addressed to Leon Hoshower, Professor, Col-lege of Business, Ohio University, Athens, Ohio.
E-mail: hoshower@ohio.edu
REFERENCES
Adams, J. S. (1963). Toward an understanding of inequity. Journal of Abnormal and Social Psy-chology, 67(3), 422–436.
Ajzen, I., & Fishbein, M. (1980). Understanding attitudes and predicting social behavior. Engle-wood Cliffs, NJ: Prentice-Hall.
Bridgewater, C. A., Walsh, J. A., & Walkenbach, J. (1982). Pretenure and posttenure productivity trends of academic psychologists. American Psychologist, 37(2), 236–238.
Brownell, P., & McInnes, M. (1986, October). Budgetary participation, motivation, and man-agerial performance. Accounting Review, 61, 587–600.
Buchheit, S., Collins, A. B., & Collins, D. L. (2001). Intra-institutional factors that influence accounting research productivity. The Journal of Applied Business Research, 17(2), 17–31. Campbell, D. R., & Morgan, R. G. (1987).
Publi-cation activity of promoted accounting faculty.
Issues in Accounting Education, 2(1), 28–43.
Cargile, B. R., & Bublitz, B. (1986). Factors con-tributing to published research by accounting faculties. The Accounting Review, 61(1), 158–178.
Chow, C. W., & Harrison, P. (1998). Factors con-tributing to success in research and publica-tions: Insights of “influential” accounting authors. Journal of Accounting Education,
16(3/4), 463–472.
DeSanctis, G. (1983). Expectancy theory as an explanation of voluntary use of a decision support system. Psychological Reports, 52(1), 247–260. Diamond, A. M. (1986). The life-cycle research
productivity of mathematicians and scientists.
Journal of Gerontology, 41(4), 520–525. Englebrecht, T. D., Iyer, G. S., & Patterson, D. M.
(1994). An empirical investigation of the publi-cation productivity of promoted accounting fac-ulty. Accounting Horizons, 8(1), 45–68. Ferris, K. R. (1977, July). A test of the
expectan-cy theory as motivation in an accounting envi-ronment. The Accounting Review, 52(3), 605–614.
Fox, M. F. (1985). Publication, performance, and reward in science and scholarship. In J. C. Smart (Ed.),Higher education: Handbook of theory and research(Vol. 1., pp. 255–282). New York: Agathon Press.
Goodwin, A. H., & Sauer, R. D. (1995). Life cycle productivity in academic research: Evi-dence from cumulative publication histories of academic economists. Southern Economic Journal, 61(3), 729–743.
Hancock, D. R. (1995). What teachers may do to influence student motivation: An application of expectancy theory. The Journal of General Education, 44, 171–179.
Hancock, T., Lane, J., Ray, R., & Glennon, D. (1992). The ombudsman: Factors influencing academic research productivity: A survey of management scientists. Interfaces, 22(5), 26–38. Hermanson, D. R., Hermanson, H. M., Ivance-vich, D. M., & IvanceIvance-vich, S. H. (1995, August). Perceived expectations and resources associated with new accounting faculty posi-tions. Paper presented at the 1995 American Accounting Association Annual Meeting,
Orlando, FL.
Holly, J. W. (1977). Tenure and research produc-tivity. Research in Higher Education, 6(1), 181–192.
Hu, Q., & Gill, T. G. (2000). IS faculty research productivity: Influential factors and implica-tions. Information Resources Management Journal, 13(2), 15–25.
Lane, J., Ray, R., & Glennon, D. (1990). Work profiles of research statisticians. The American Statistician, 44(1), 9–13.
Levitan, A. S., & Ray, R. (1992). Personal and institutional characteristics affecting research productivity of academic accountants. Journal of Education for Business, 67, 335–341. McKeachie, W. J. (1979). Perspective from
psy-chology: Financial incentives are ineffective for faculty. In D. R. Lewis & W. E. Becker (Eds.),
Academic rewards in higher education. Cam-bridge, MA: Ballinger.
Milne, R. A., & Vent, G. A. (1987). Publication productivity: A comparison of accounting fac-ulty members promoted in 1981 and 1984.
Issues in Accounting Education, 2(1), 94–102. Read, W. J., Rama, D. V., & Raghunandan, K.
(1998). Are publication requirements for accounting faculty promotions still increasing?
Issues in Accounting Education, 13(2), 327–339. Schultz, J. J., Meade, J. A., & Khurana, I. (1989). The changing role of teaching, research, and services in the promotion and tenure decisions for accounting faculty. Issues in Accounting Education, 4(1), 109–119.
Tien, F. F. (2000). To what degree does the desire for promotion motivate faculty to perform research? Research in Higher Education, 41(6), 723–752.
Tien, F. F., & Blackburn, R. T. (1996). Faculty rank system, research motivation, and faculty research productivity: Measure refinement and theory testing. Journal of Higher Education, 67(1), 2–11.
Vroom, V. C. (1964). Work and motivation. New York: Wiley.
Warshaw, P. R. (1980). A new model of predicting behavior intentions: An alternative to Fishbein.
Journal of Marketing Research, 17, 153–172.
APPENDIX Questionnaire
This brief questionnaire is designed to understand faculty motivation to conduct research. We greatly appreciate your taking time to provide meaningful input. Your responses will be kept confidential. Your name will not be revealed in any of our reports or articles. 1. As a faculty member, please evaluate the importance of the following to you using a scale of 1 to 5, with 5 being very importantand 1 being not important at all.
Importance of the following to me: Not
Important Very
At All Important
a. Receiving or having tenure 1 2 3 4 5
b. Being full professor or receiving promotion 1 2 3 4 5
c. Getting better salary raises 1 2 3 4 5
d. Getting an administrative assignment 1 2 3 4 5
e. Getting a chaired professorship 1 2 3 4 5
f. Getting a reduced teaching load 1 2 3 4 5
g. Achieving peer recognition 1 2 3 4 5
h. Getting respect from students 1 2 3 4 5
(appendix continues)
APPENDIX (continued)
Importance of the following to me: Not
Important Very
At All Important
i. Satisfying my need to contribute to the field 1 2 3 4 5
j. Satisfying my need for creativity or curiosity 1 2 3 4 5
k. Having satisfying collaborations with others 1 2 3 4 5
l. Satisfying my need to stay current in the field 1 2 3 4 5
m. Finding a better job at another university 1 2 3 4 5
2. Based on your experience and expectations of your college’s environment, please evaluate the impact of faculty research productivity on achieving the following using a scale of 1 to 5, with 5 being strongly agreeand 1 being strongly disagree.
At my college or school, faculty research Strongly Strongly
productivity has a high impact on: Disagree Agree
a. Receiving tenure 1 2 3 4 5
b. Receiving promotion 1 2 3 4 5
c. Getting better salary raises 1 2 3 4 5
d. Getting an administrative assignment 1 2 3 4 5
e. Getting a chaired professorship 1 2 3 4 5
f. Getting reduced teaching load 1 2 3 4 5
3. Based on your perception, please evaluate the impact of your research productivity on achieving the following using a scale of 1 to 5, with 5 being strongly agreeand 1 being strongly disagree.
My research productivity has a high impact on: Strongly Strongly
Disagree Agree
g. Achieving peer recognition 1 2 3 4 5
h. Getting respect from students 1 2 3 4 5
i. Satisfying my need to contribute to the field 1 2 3 4 5
j. Satisfying my need for creativity or curiosity 1 2 3 4 5
k. Having satisfying collaborations with others 1 2 3 4 5
l. Satisfying my need to stay current in the field 1 2 3 4 5
m. Finding a better job at another university 1 2 3 4 5
4. Demographic Profile:
Discipline: ❑ Accounting ❑ Finance ❑ MIS ❑ Marketing ❑ HRM ❑ OB
❑ Business Law ❑ Decision Science/Production/Operations Mgmt/QBA ❑ Other Please indicate the percentage of work time you spent on research in the past 12 months: %
Gender: ❑ Male ❑ Female
The year in which you started your first tenure-track faculty position:
Current academic rank: ❑ Assistant Prof. ❑ Associate Prof. ❑ Full Prof. As applicable, please provide the year in which you were promoted from:
Assistant to Associate Professor rank: Associate to Full Professor rank:
Tenure Status: ❑ Tenured ❑ Untenured but on Tenure Track ❑ Non-Tenure Track If tenured, in which year did you receive tenure:
Your Research Output during your entire academic career: Total number of books published or accepted for publication: Total book chapters or cases published or accepted for publication:
Total number of refereed journal articles published or accepted for publication: Total worth of research grants received: $
Your Research Output during the past 24 months:
Total number of books published or accepted for publication:
(appendix continues)
APPENDIX (continued)
Total book chapters or cases published or accepted for publication:
Total number of refereed journal articles published or accepted for publication: Total worth of research grants received: $
To what extent do you believe that your efforts will achieve or have achieved research output that is:
Not to a To a great
great extent extent
a. Acceptable to your college’s standard 1 2 3 4 5
b. Acceptable to your own satisfaction 1 2 3 4 5