DISASTER AND RESILIENCE FOR THE 2007 FLOOD EVENT
IN PART OF SUKOHARJO REGENCY
Sinta Damayanti damayanti7379@yahoo.com
Balai Pengelolaan Daerah Aliran Sungai Solo
Muh Aris Marfai arismarfai@yahoo.com
Faculty of Geography,Universitas Gadjah Mada ABSTRACT
Community resilience has become an important factor in a disaster mitigation plan. Resilience is related to the ability to recover from a disaster and is for every person different. This research intends to assess community resilience for flood disaster. Factors for quantifying community resilience were asked to respondents by giving questionnaire and interviewing them, and FGD was also done in order to generate flood map based on the community knowledge. The FGD result shows that the flood depth in the study area varies from 0 until 300 cm, and the duration of inundation varies from 1-7 days. Flood also caused losses, and the distribution of the losses was Rp. 0 -100,000,000,- although, in general, the losses was merely below Rp. 2,000,000,-. Based on the weighting result, the resilience value of the respondent is distributed from 0.113 until 0.700. The average resilience value of Laban village is 0.403, and 0.368 for Kadokan village. The resilience value was mostly influenced by human capital. In order to increase the community resilience, government has established flood control devices and rehabilitated the dike along the river.
Keywords : interviews, focus group discussion, flood characteristics, community resilience
ABSTRAK
Ketahanan masyarakat merupakan faktor penting dalam rencana mitigasi bencana. Ketahanan berkaitan dengan kemampuan untuk pulih dari bencana dan berbeda untuk setiap orang. Penelitian ini bertujuan untuk menilai ketahanan masyarakat terhadap bencana banjir. Faktor-faktor untuk mengukur ketahanan masyarakat ditanyakan kepada responden melalui kuesioner dan wawancara. Selain itu, peta banjir dihasilkan berdasarkan pengetahuan yang dimiliki oleh masyarakat. Hasil FGD menunjukkan bahwa kedalaman banjir di daerah penelitian bervariasi dari 0 hingga 300 cm, sedangkan durasi genangan bervariasi dari 1-7 hari. Banjir juga menyebabkan kerugian dengan distribusi kerugian sebesar Rp. 0 - 100,000,000,00. Namun, pada umumnya kerugian yang ditimbulkan masih lebih kecil dari Rp. 2.000.000,-. Distribusi nilai ketahanan responden berdasarkan hasil pembobotan berkisar antara 0,113 hingga 0,700. Nilai rata-rata ketahanan desa Laban adalah 0,403, dan 0,368 untuk desa Kadokan. Nilai ketahanan sebagian besar dipengaruhi oleh modal manusia. Dalam rangka, meningkatkan ketahanan masyarakat, pemerintah telah membentuk perangkat pengendalian banjir dan merehabilitasi tanggul di sepanjang sungai.
© 2011 Faculty of Geography UGM and The Indonesian Geographers Association
Indonesian Journal of Geography, Vol 43, No. 2, December 2011 : 111 – 122
Flood has caused a big impact in terms of disruption and destruction to livelihood and the changes in the live of affected people. The characteristic of flood in each area is different in its duration, intensity, and frequency. Ba-sed on the geographical and geological characteristics, Indonesia is generally prone to flood [Marfai et al. 2008] Sukoharjo is one of the regencies in Central Java Province that has frequently been struck by flood in recent years. In the last three years, Sukoharjo has frequently experienced flooding.
The knowledge of the community affected by flood is important to be integrated in flood risk assessment [Wigati, 2008; Marfai and Hisbaron, 2008; Suryanti, Marfai 2008 and Marfai et al. 2008]. Their understanding of flood as part of their environment is an important factor that should be considered by local government in establishing flood risk management [Febrianty, 2010]. Hence,
community resilience becomes an
important factor in a disaster mitigation
plan [Marfai, 2011]. Unfortunately,
information related to resilience is
inadequate. For this reason, this research intends to assess the community resilience for flood disaster.
Objectively, this research aims to:
1. Identify the Flood Characteristic in the study area including Flood Distribution, Flood Depth and Flood Duration.
2. Identify the Flood Impact to Community.
3. Identify the community
Resilience due to the flood event.
The research location consists of two kelurahan / villages in Sukoharjo that were affected by flood in 2007. These areas are located in the south part of Surakarta municipality. Geographically, Suko harjo
is located on 7o 42’ S and 110o 50’ E.
Some parts of this regency are crossed by the Bengawan Solo River, the main river of the Solo basin.
The two villages in Sukoharjo regency that were inundated in 2007 are desa
Laban and desa Kadokan
[www.tempointeraktif.com, 2007].
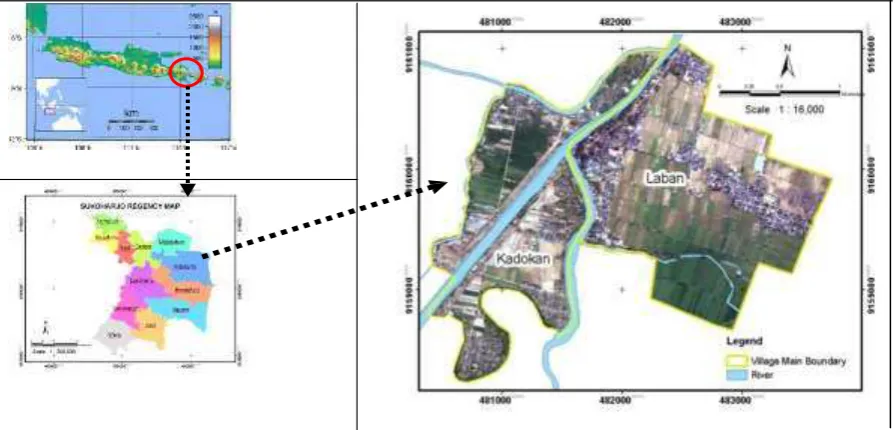
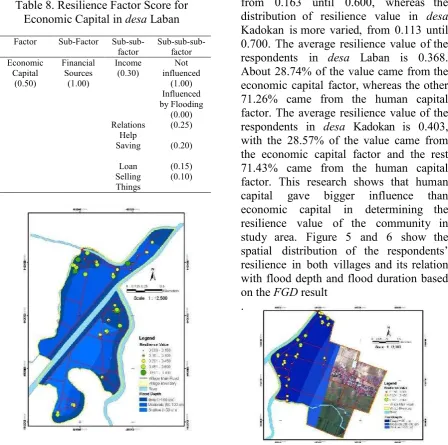
Although located in different sub-districts, these two villages are geographically located close to each other. Both villages are naturally prone to flood. The overflow of the Bengawan Solo River and Samin River caused flooding in those villages in the end of 2007. Figure 1 shows the location of the study area.
Figure 1. Overview of Study Area
THE METHODS
This research focused on two activities i.e.: 1) generating a flood map based on the community knowledge, and 2) determining and analyzing variables of community resilience. Along with the Focus Group Discussion (FGD), giving questionnaire and interviewing respondents are the main methods used in this research.
Some people are involved in FGD in order to describe the flood event in their village. Flood characteristics, such as flood depth, flood distribution, and flood duration were described by the participants. In order to make it easier for them to describe flood characteristics, every element has been categorized into 3 levels i.e. low/quick; moderate; and deep/long.
Questionnaire was used to acquire the community resilience data, and interview was also done to obtain further information. In obtaining the resilience data, 80 respondents were selected and interviewed. The respondents were randomly selected from the area which was inundated during the 2007 flood
event. According to Islam et al. [ 2010], there are 5 major forms of capital in building community resilience i.e. natural capital, economic capital, physical capital, social capital, and human capital. This research focuses on human capital and economic capital, which describs each respondent’s resilience condition.
RESULT AND DISCUSSION
Flood Characteristic Flood Extent/ Distribution
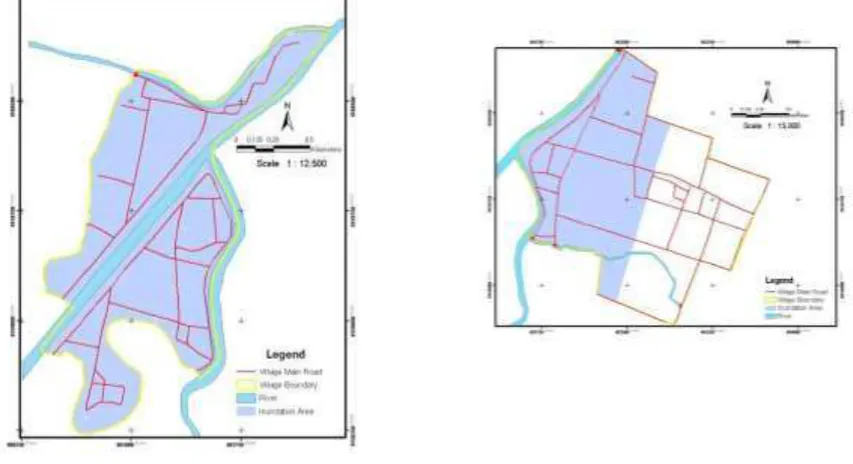
The interview with both respondents and local government, and the FGD provided some information that the flood in desa Laban is unevenly distributed. During the big flood, there was only 1 dusun that was not inundated because, compared to the other 2 dusun, it is situated on a higher elevation.
Different from the condition in desa Laban, flood is more evenly distributed in desa Kadokan. Most of the area in this village was inundated. The flooding in both villages was mainly caused by the broken dike. The distribution of the flood coverage in both villages is displayed in Figure 2
Indonesian Journal of Geography, Vol 43, No. 2, December 2011 : 111 – 122
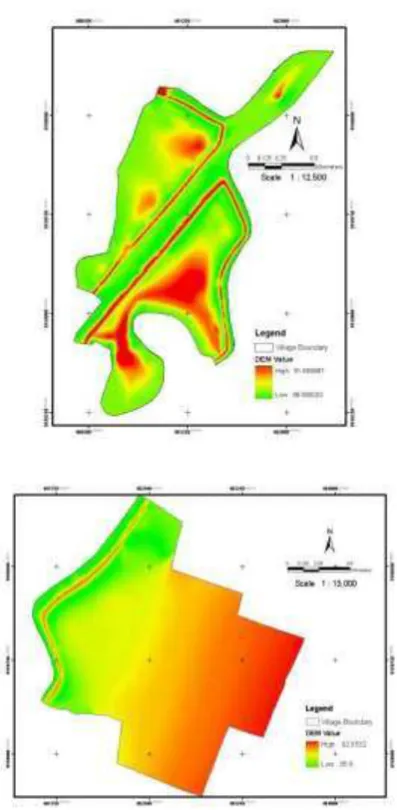
Figure 3. Left: DEM map of Kadokan; Right: DEM map of Laban
Flood Depth
The 2007 flood event inundated desa Laban and desa Kadokan in different depth. The Focus Group Discussion has generated three classes of flood depth i.e. deep (> 100 cm), moderate (50 – 100 cm), and shallow (< 50 cm). The depth was estimated from the village main road and, therefore, it represents the general flood depth in both villages. Figure 3 shows the flood depth distribution in both villages acquired from the overlay of FGD result and flood depth inside the respondent’s houses.
The result of the Focus Group Discussion in both villages shows a different pattern of flood depth. The pattern in desa Laban shows that the flood depth
decreases gradually from west to east, whereas in desa Kadokan, it is more varied. A unique result can be seen from the overlay of the flood depth resulted from the FGD and interview. The depth pattern resulted from the FGD shows a gradual increase which is in line with the general elevation. On the other hand, the depth pattern of the respondents’ houses is distributed randomly. Although the FGD result shows that some houses are located in the same flood depth zone, each house, in fact, has a different flood depth.
Flood Duration
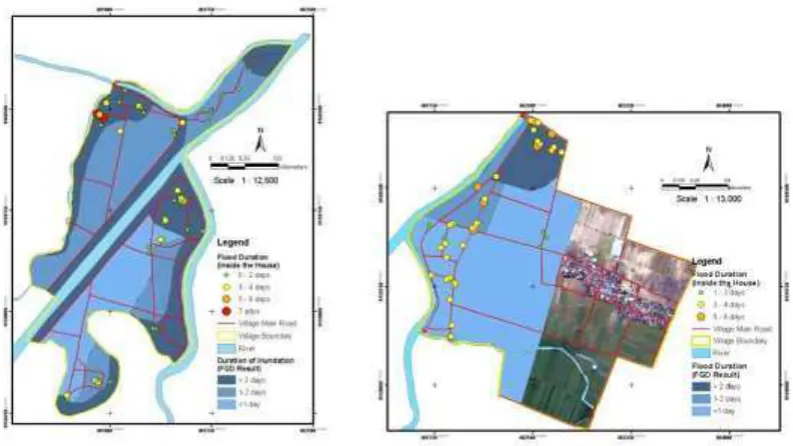
The duration difference of inundation was generally described by the participants in the FGD. There are three classes of flood duration, i.e. long (>2 days), moderate (1– 2 days), and quick (<1 day). Different results are generated from the overlay of the FGD based flood duration and the flood duration inside the respondents’ houses. Figure 4 shows the overlay of the flood duration based on the FGD and the flood duration inside the house of the respondents.
The differences were caused by different standardization of inundation height. Sometimes people did not consider an inundation event as inundation when they could pass the road easily, althoughugh the water was already several cm high. On the contrary, when the same water height inundated houses, they would consider the event as an inundation event. Furthermore, the flooding events occurred three times in 2007 with a different duration also influenced the calculation of the flood duration.
Figure 4. Left: The distribution of Flood Depth in Kadokan; Top: The distribution of Flood Depth In Laban
Indonesian Journal of Geography, Vol 43, No. 2, December 2011 : 111 – 122
Impact of Floods to the Community Trauma
The interview result indicates that most of the respondents are traumatized. They seem to be frightened whenever it rains hard. About 56% of the respondents still have this kind of psychological condition. Unlike the male respondents, most female respondents still feel traumatized. Table 1 shows the psychological condition of the respondents based on their gender in both villages.
Table 1. Psychological Condition of Respondents Based on Gender
Gender Traumatized
(percent) Traumatized Not
(percent)
Male 18.75 36.25
Female 37.5 7.5
The traumatized respondents are distributed randomly in the study area. The traumatic circumstance is caused more by the gender factor than other factors such as flood depth and flood experiences. A psychology study in America reveals that women are more sensitive to the emergence of stress hormones, corticotropinreleasing factor (CRF), than men [Dewi, 2010]. Therefore, women are more prone to depression, trauma, and other psychological problems.
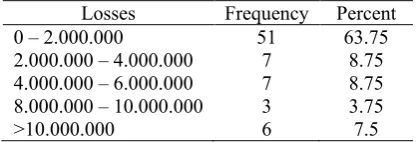
Losses
Losses that are caused by the 2007 flood event vary among the community. The variation depends on the goods that the people had before the flood event and the flood preparedness. Some people that have more flood experiences seem to be more prepared than those that do not, such as having ranggon inside the house. Ranggon is a place bellow the roof that is used for keeping goods during the the 2007 flood event can be seen in Table 2.
Table 2. Respondents’ Losses
Losses Frequency Percent
0 – 2.000.000 51 63.75
2.000.000 – 4.000.000 7 8.75
4.000.000 – 6.000.000 7 8.75
8.000.000 – 10.000.000 3 3.75
>10.000.000 6 7.5
Impact of Floods to Income
Flood also influenced most of the respondents’ income although some people’s income in the area remains uninfluenced. The percentage of this group is about 28 percent. Table 3 shows the influence of flood to respondents’ income.
Table 3. Flood Influence to the Income of Respondents
Influence to Income Frequency Percent
(%)
Yes 57 71.3
No 23 28.8
Community Resilience Human Capital
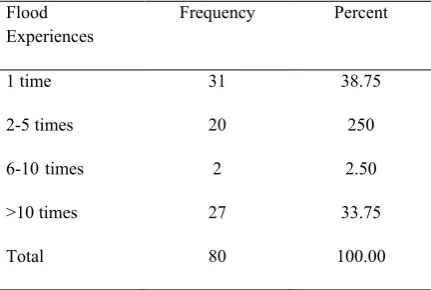
Sullivan and Sheffrin, 2003 in (Islam et al. 2010)mentioned that skills and knowledge are human capital in building community resilience. Skills and knowledge can be gained through education and experiences. Education and experiences can increase understanding or perception of community risk and also increase the ability in developing and implementing risk reduction strategies. Therefore, this research investigated both factors in determining community resilience in the study area. respondents experienced the 1966 flood event. Flood experiences of respondents in both villages can be seen in Table 4.
Table 4. Flood Experiences of Respondents in Study Area
Flood
Experiences Frequency Percent
1 time 31 38.75 distributed based on the age which ranges from 20 to 74 years old. The level of education in desa Laban and desa Kadokan can be seen in Table 5.
Table 5. Education Level of Respondents in Study Area
Education
Level Frequency Percent
No Education 12 15.00 elementary school. The age of respondents in this group is between 51 to 60 years old. On the other hand, only 5 respondents from both villages received their college education. more active in updating information
related to flood by using
telecommunication tools, such as cell phones. The updated information concerning the flood among the community before, during, and after disaster were flood depth, flood coverage, evacuation route, evacuation places, assistance center, and aid.
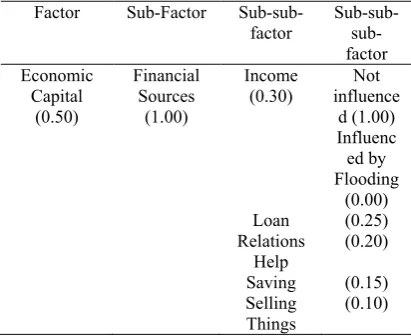
Economic Capital
Indonesian Journal of Geography, Vol 43, No. 2, December 2011 : 111 – 122 non formal sectors was usually influenced by the flood. On the other hand, the income of people who work in formal sectors such as civil servants or teachers remains uninfluenced by the flooding event. However, income alone is sometimes not enough and, therefore, other financial resources to support the recovery are needed. The availability of more financial resources will make the recovery process faster. Table 6 shows the number of people who used other financial resources besides their income.
Table 6. Community Financial Resources for Recovery toward the 2007 Flood
Impact they can restore the condition back to the condition before the disaster. Even some people in the area cannot recover at all. Yet, they can accept the condition and live normally. The acceptance attitude among the people is influenced by factors such as culture and religion. In the religion view, disaster is an ordeal from God to measure one’s level of faith. Furthermore, disaster is also an admonition from God so that human can utilize natural resources more wisely. Besides, Javanese culture also has a strong influence to people’s daily life. Such influence is reflected from a belief among Javanese people which says that every
occurrence is the way of nature in balancing the ecosystem. Another popular teaching in Javanese culture is a saying that says “nrimo ing pandum”. This saying teaches people to accept every challenge in their life with a sincere heart, face the challenge with hard work, then let God determine the result
Table 9. Resilience Factor Score for Economic Capital in desa Kadokan
Factor Sub-Factor
Sub-sub-factor Sub-sub-
sub-(0.30) influenceNot d (1.00) value for each respondent in both villages can be calculated. The distribution of resilience value in desa Laban is ranging from 0.163 until 0.600,
[Kompasiana, 2010]. Both factors have, indeed, helped people recover psychologically.
Weighting Value for Community Resilience
Table 7. Resilience Factor Score for Human Capital in Study Area
Factor Sub-Factor Sub-sub-factor
Table 8. Resilience Factor Score for Economic Capital indesaLaban
Factor Sub-Factor
Sub-sub-Table 9. Resilience Factor Score for Economic Capital indesaKadokan
Factor Sub-Factor
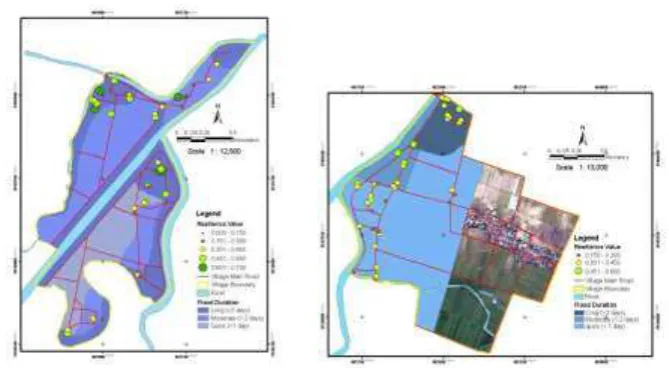
Sub-sub-Based on the above table, the resilience value for each respondent in both villages can be calculated. The distribution of resilience value in desa Laban is ranging from 0.163 until 0.600, whereas the distribution of resilience value in desa Kadokan is more varied, from 0.113 until 0.700. The average resilience value of the respondents in desa Laban is 0.368. About 28.74% of the value came from the economic capital factor, whereas the other 71.26% came from the human capital factor. The average resilience value of the respondents in desa Kadokan is 0.403, with the 28.57% of the value came from the economic capital factor and the rest 71.43% came from the human capital factor. This research shows that human capital gave bigger influence than economic capital in determining the resilience value of the community in study area. Figure 5 and 6 show the spatial distribution of the respondents’ resilience in both villages and its relation with flood depth and flood duration based on theFGDresult
.
Indonesian Journal of Geography, Vol 43, No. 2, December 2011 : 111 – 122
Figure 7. Left: Distribution of Respondents’ Resilience and Flood Duration in Kadokan; Right : Distribution of Respondents’ Resilience and flood Duration in Laban
Resilience value of both villages is distributed randomly, both in flood depth and flood duration patterns. Respondents with a lower resilience value will theoretically be more vulnerable than respondents with a higher resilience value. This condition will be worsened by the flood depth and duration. Therefore, respondents with the lowest resilience value which are located in a deep flood zone and/or in a zone with long flood duration are most vulnerable to flood. On the other hand, respondents with a highest resilience value and are located in the shallow zone of the flood depth classes and/or in a zone with short flood duration are least vulnerable to flood.
CONCLUSION
The distribution of flood depth and duration in desa Laban is different from the distribution of flood depth and duration in desa Kadokan. The pattern of flood depth and duration was influenced by factors such as distance from river, general elevation, and location of broken dikes. Three classes of flood depth, i.e. deep (> 100 cm), moderate (50 – 100 cm), and shallow (< 50 cm), as well as three classes of flood duration, i.e. long (> 2 days), moderate (1 – 2 days), and quick (< 1 day), were generated based on the result of the Focus Group Discussion. In this case, not all the deep flood zones
were also the long duration flood zones. The 2007 flood event also gave a considerable impact to people’s life. Most respondents that were interviewed are traumatized. The traumatic circumstance is caused more by gender factor than other factors such as flood depth and flood experiences. The disaster also caused significant losses which varied between Rp. 0, - until Rp. 100,000,000,-. In average, the respondents’ losses are less than Rp. 2.000.000,-. The flooding event also greatly influenced the income of the people. About 71.3% of respondents who mostly work in non formal sectors claimed that their income was influenced by flood. On the other hand, respondents working in formal sectors reported that their income was not influenced by the disaster at all.
influenced by the economic capital factor.
This research indicates that human capital has a bigger influence than economic capital in determining the community resilience value, especially in the study area.
RECOMMENDATION
Based on the result and conclusion, the following recommendations can be proposed:
1. A further study on the relation between resilience and flood characteristic will be valuable to provide information related to community resilience in risk assessment.
2. Concerning the resilience assessment, more capital indicators in building community resilience will provide better result in describing community resilience. Therefore, a deeper investigation concerning each capital will be valuable in obtaining some information related to community resilience
3. Focus Group Discussion based on the community knowledge is an effective way to obtain some information in a wide scope. As this low-cost method can easily be adopted and implemented, FGD can be used by government in order to gain some information in a wide scope.
4. Comparing detailed DEM maps to flood maps generated by the community, especially in the flat area, should be considered as important. Therefore, very detail contours of the study area are needed in order to analyze flood more accurately.
ANCKNOWLEDGMENTS
A sincere gratitude goes to Nanette C. Kingma for giving a thorough review and suggestion in the earlier draft. Some parts of this work have been made possible with the support from Program Pengembangan Doktor (P2D) Beasiswa Unggulan of Bureau for Planning and Internationl Cooperation (BPKLN), the Ministy of Education.
REFERENCE
Febrianti, F. (2010), Flood Risk Perception and Coping Mechanism of Local Community: A Case Study in Part of Surakarta City, Central Java Province, Indonesia, Msc . Thesis, International Institute for Geo-Information and Earth Observation, Enschede- The Netherland.
Islam, T., Marrell W., and Seitz W. (2009), Galveston Futures: Developing a disaster resilient
community. Journal of
Geography and Regional
Planning, Vol 3(1), from
Indonesia: An overview
Environmental Geology 56, 335 – 351
http://dx.doi.org/10.1007/s00254-007-1169-9.
Marfai, M.A., L.King., J. Sartohadi., S. Sudrajat., S.R Budiani, F.Yulianto (2008b), Impact of Tidal Flooding to Population in Semarang Coastal
Srea, Indonesia, The
http://dx.doi.org/10.1007/s10669-Indonesian Journal of Geography, Vol 43, No. 2, December 2011 : 111 – 122
007-9134-4.
Marfai, M.A. and Hisbaron ( 2011), Community’s adaptive capacity due to coastal flooding in Semarang Coastal City, Indonesia, International Journal of Seria Geografie, 2, 209-221, Annals of the University of Oradea, E-ISSN 2065, Year XXI.
Marfai, M.A. (2011), Jakarta Flood
hazard and community
participation on disaster preparedness, Conference
proceeding on community
preparedness and disaster management, Center for Religious and cross-cultural studies, UGM.
Suryanti, E.M., M. A. Marfai (2008), adaptation strategy of the coastal
community in semarang Coastal area to tidal Flooding, Indonesian Disaster Journal 5(1),335-346.
Tempointeraktif Online (2007), Presiden
Kunjungi Lokasi Banjir
Bengawan Solo, December 30th 2007, From
http://www.tempointeraktif.com /hg/nasional/2007/12/30/brk,20071 230-114466, id.html, Accessing date 21st May 2010.(in bahasa)