AUTHOR’S PREFACE
TO A SPECIAL
COLLECTION
10.1002/2013JC009592
Coherent intraseasonal oceanic variations in the eastern
equatorial Indian Ocean and in the Lombok and Ombai Straits
from observations and a high-resolution OGCM
Iskhaq Iskandar1,2, Yukio Masumoto3, Keisuke Mizuno3, Hideharu Sasaki4, Azhar K. Affandi1,
Dedi Setiabudidaya1, and Fadli Syamsuddin5
1Jurusan Fisika, Fakultas Matematika dan Ilmu Pengetahuan Alam, Universitas Sriwijaya, Sumatra Selatan, Indonesia, 2Pusat Penelitian Lingkungan Hidup, Universitas Sriwijaya, Sumatra Selatan, Indonesia,3Research Institute for Global
Change, JAMSTEC, Yokohama, Japan,4Earth Simulator Center, JAMSTEC, Yokohama, Japan,5Badan Pengkajian dan
Penerapan Teknologi, Jakarta, Indonesia
Abstract
Ongoing acoustic Doppler current profilers (ADCP) observation in the eastern equatorial Indian Ocean and a recentInternationalNusantaraStratificationandTransport (INSTANT) experiment in the Indo-nesian Throughflow (ITF) straits have shown coherent intraseasonal oceanic variations in this region. The intraseasonal variations are dominated by 30–70 day variations, with a tendency for the observed currents in the eastern equatorial Indian Ocean to lead those at the Lombok and Ombai Straits. Phase speed of these eastward propagating signals estimated using lag correlation analysis does not correspond to one particular baroclinic mode, though it is in the range expected for the first two baroclinic modes. In this study, the dynamics underlying this intraseasonal coherency is evaluated using output from a high-resolution ocean general circulation model developed for the Earth Simulator (OFES). The results from model simulation of January 2001 through December 2007 show that the first two baroclinic modes dominate the intraseasonal variations in this region. While the first and second baroclinic modes have comparable contribution to the intraseasonal oceanic variations in the eastern equatorial Indian Ocean and in the Ombai Strait, the intrasea-sonal oceanic variations in the Lombok Strait are dominated by the first baroclinic mode. Moreover, the analysis reveals that the intraseasonal variability at all mooring sites is mostly confined in the upper layer above100 m depth. Both equatorial wind from the Indian Ocean and alongshore winds off Sumatra and Java play important roles in generating intraseasonal variations in the Lombok and Ombai Straits.1. Introduction
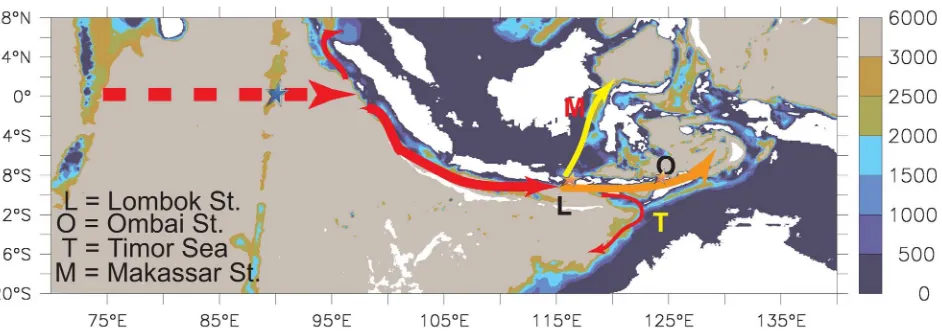
A low-latitude connection between the Pacific Ocean and the Indian Ocean through the Indonesian Straits is well known as the Indonesian Throughflow (ITF) [Godfrey, 1996;Gordon and Fine, 1996]. The main route of thermocline water of the ITF is through Makassar Strait, then entering the Banda Sea before exiting to the Indian Ocean through the Lombok Strait, Ombai Strait, and Timor Passage [Ffield and Gordon, 1992]. On the other hand, the intermediate and deep-water masses enter the Banda Sea through the Molucca and Halma-hera Seas [van Aken et al., 1988;Gordon and Fine, 1996].
The ITF plays an important role on the state of global and regional climate variations [Hirst and Godfrey, 1993;Song et al., 2007]. It transports heat from the Pacific Ocean to the Indian Ocean on the order of about 0.5 PW [Vranes et al., 2002]. Modeling studies have shown that blocking the ITF will warm the Pacific Ocean, which may affect the El Ni~no-Southern Oscillation [Wajsowicz and Schneider, 2001;Song et al., 2007].
The ITF volume transport shows significant temporal variability from intraseasonal to interannual time scales. Previous studies have suggested that the temporal variability of ITF volume transport is significantly correlated with wind forcing from the Pacific, Indian, and regional Indonesian region [Arief and Murray, 1996;Sprintall et al., 2000;Wijffels and Meyers, 2004;Cai et al., 2005;Shi et al., 2007]. In particular, within intra-seasonal and semiannual time scale, remote forcing from the equatorial Indian Ocean influences the ITF transport through the propagation of oceanic Kelvin waves generated by the atmospheric wind forcing over the equator.Chong et al. [2000] using data from shallow pressure gauge array (SPGA) mounted at the
ITF straits have found that the intraseasonal variations of the ITF are associated with a propagation of coastal Kelvin waves generated by atmospheric intraseasonal fluctuations over the equatorial Indian Ocean. The passage of the Indian Ocean wind-forced Kelvin waves has also been observed in the mooring site off south Java [Sprintall et al., 1999, 2000], and in the sea level data along the southern coasts of Java and Sumatra [Arief and Muray, 1996;Iskandar et al., 2005]. Recent study [Schiller et al., 2010] used a combination of direct current measurements in the ITF straits and ocean reanalysis to demonstrate the pathways of intra-seasonal variability in the ITF regions. They showed the importance of equatorial winds from the Indian Ocean in generating downward energy propagation of intraseasonal variability in the ITF regions.
Although a fairly comprehensive mean picture of intraseasonal oceanic variations in the ITF region and in the equatorial Indian Ocean is available from previous observational [Arief and Murray, 1996;Sprintall et al., 2000;Chong et al., 2000;Iskandar et al., 2005] and numerical studies [Qiu et al., 1999;Iskandar et al., 2006], dynamical analysis from a temporal coherence of observational data is not available so far and yet to be fully understood. About 8 year long velocity time series records from the eastern equatorial Indian Ocean which cover an observational period of current measurements in the ITF regions, so called INSTANT (I nter-nationalNusantaraStratificationandTransport) [Sprintall et al., 2004, 2009] give an opportunity to evaluate coherent intraseasonal oceanic variations in this region. Using a combination of direct current measure-ments and output from a high-resolution ocean general circulation model, this study is designed to give a detailed description of the intraseasonal oceanic variance and coherency in the eastern equatorial Indian Ocean and in the throughflow straits: the Lombok and Ombai Straits. Modal decomposition analysis based on the simulated parameters will be used to evaluate the dominant mode of variability.
The presentation of this paper is organized as follows. In section 2, descriptions of data and numerical model we use are provided. In section 3, we describe spectral characteristic of the observed currents and its relation to wind forcing and wave dynamics. Section 4 presents simulated intraseasonal variations and the dynamics underlying the relationships of the observed oceanic intraseasonal variations in the eastern equatorial Indian Ocean and in the Lombok and Ombai Straits. Summary of the results is presented in section 5.
2. Data and Model
2.1. Observations 2.1.1. Currents Data
As part of the INSTANT project, several subsurface acoustic Doppler current profiler (ADCP) moorings have been deployed in the outflow straits of the ITF [Sprintall et al., 2004]. We used data from INSTANT moorings in the Lombok Strait (8.4S, 115.9E), and Ombai Strait (8.53S, 125.01E) (Figure 1).
The Lombok Strait mooring was deployed on 10 January 2004, and then recovered and redeployed on 18 June 2005, with the final recovery on 16 December 2006. The first deployment of the mooring in the Ombai Strait was on 8 August 2003. This mooring was recovered and redeployed on 3 July 2005, and was finally recovered on 7 December 2006 [Cowley et al., 2008]. The data are available for three level depths at 50, 150, and 350 m and the data can be obtained at http://www.marine.csiro.au/cow074/instantdata.htm.
In the eastern equatorial Indian den, 2011]. The ADCP measures vertical profile of currents from sea surface down to about 400 m depth with a vertical interval of 10 m. Measurements still continue to the present and the data set is now being the longest observational data available for the equatorial Indian Ocean. Table 1 presents a summary of the mooring data used in the present study.
Note that short gaps in the time series exist at both sites because of the time between mooring recoveries and redeployments. We have linearly interpolated across these gaps and other gaps shorter than 10 days resulting from instrument failure or other problems. In this study, we analyze the observational data for a period of 18 January 2004 to 27 November 2006 when all data are available.
2.1.2. Satellite Altimeter Data
Merged sea surface height (SSH) data are obtained from Archiving, Validation and Interpretation of Satellite Oceanographic Data (AVISO) (http://www.aviso.oceanobs.com). The data set has a horizontal resolution of 0.2530.25and temporal resolution of 7 days. Only data from January 2004 to December 2006 are used
in this study. Note that long-term means have been removed at each grid point to eliminate errors associ-ated with uncertainties with the geoid.
2.1.3. Surface Wind Data
We use daily surface wind data obtained from National Centers for Environmental Prediction/National Cen-ters for Atmospheric Research (NCEP/NCAR) reanalysis, which have horizontal resolution of 2.532.5.
Data from January 2004 to December 2006 are used in the present analysis. The daily surface winds are used to compute surface wind stress using a constant drag coefficient (1.4331023
) and air density (1.225 kg m23
) followingWeisberg and Wang[1997].
2.2. Model
A high-resolution ocean general circulation model developed for the Earth Simulator (hereafter OFES) is used in this study [Masumoto et al., 2004;Sasaki et al., 2008]. The model is based on the Geophysical Fluid Dynamics Laboratory’s Modular Ocean Model (MOM3) [Pacanowski and Griffies, 2000]. The model covers near-global region extending from 75S to 75N, with uniform horizontal resolution of 0.1in both longitude and latitude.
There are 54 levels in vertical, of which 20 levels are located in upper 200 m depth. The model topography is constructed from 1/30bathymetry data set created by the OCCAM project at the Southampton
Oceanogra-phy center. A biharmonic scheme [Smith et al., 2000] is used for the horizontal mixing, whereas the K-Profile Parameterization scheme [Large et al., 1994] is adopted for the vertical mixing processes.
The model is spun up from a state of rest for a period of 50 years under the climatological mean forcing of NCEP/NCAR reanalysis data set [Kalnay et al., 1996]. Then, the model is driven by daily mean forcing from 1950 to 2007. The surface heat and fresh water flux were specified using bulk formula with atmospheric data obtained from the NCEP/NCAR reanalysis. In addition, the surface salinity is relaxed to the monthly mean climatology of the WOA98 [Boyer et al., 1998a, 1998b, 1998c] to include the contribution from the river runoff. Similar relaxation to the climatological monthly temperature and salinity is also applied near the artificial boundary at 75S and 75N.
In this study, we used 3 day snapshot of velocity, sea surface height (SSH), temperature, and salinity fields for a period of January 2001 to December 2007, which covers the period of the INSTANT experiment.
3. Observed Intraseasonal Variations
3.1. Spectral Characteristics
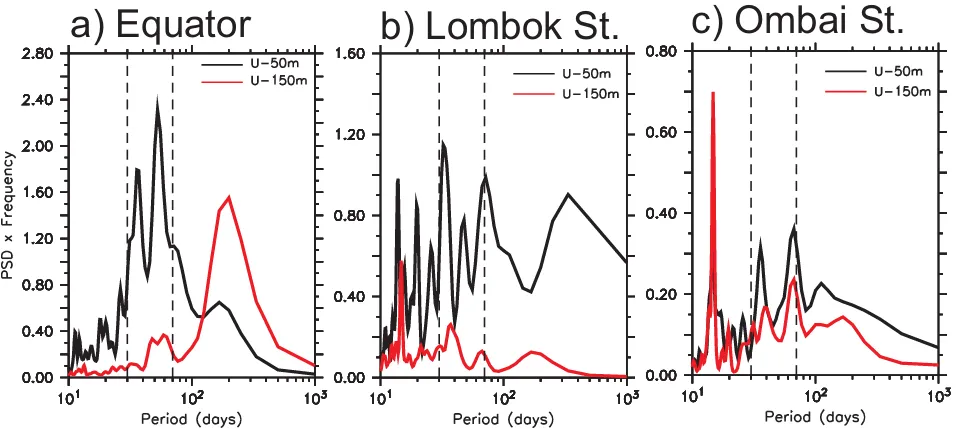
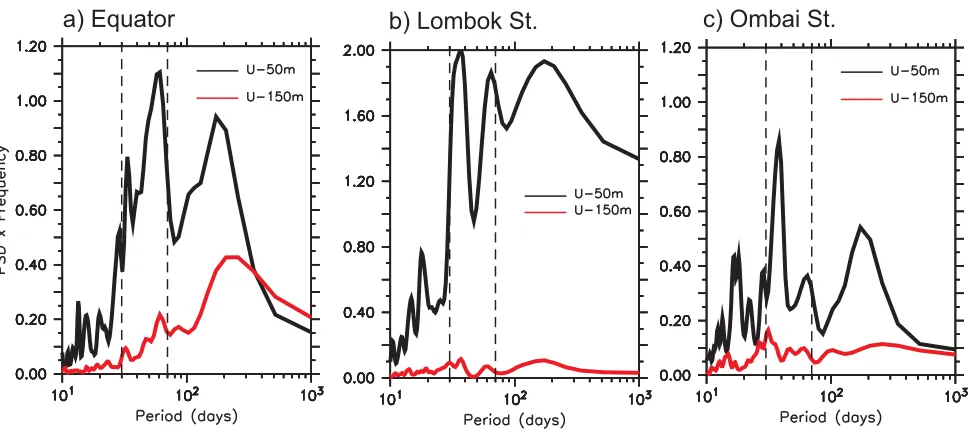
Spectra of the observed zonal currents at 50 and 150 m depths are shown in Figure 2. The spectra are calcu-lated for the 34 month period of February 2004 to November 2006 when the observed currents at all
Table 1.Summary of Data From ADCP Moorings in the Eastern Equatorial Indian Ocean and in the Throughflow Straits
Mooring Location Period Equator 0S, 90E 14 Nov 2000 to 3 Dec 2006
Lombok Strait 8.4S, 115.9E 10 Jan 2004 to 16 Dec 2006
mooring locations are available. The spectra are estimated from the raw periodogram amplitude by smoothing in three frequency bands using a triangle filter.
The spectra given in Figure 2 show that the observed currents at all mooring locations clearly indicate intra-seasonal variations. Pronounced oceanic intraintra-seasonal variations are mostly confined in the upper layer, though the observed current in the deeper layer at Ombai Strait shows a comparable energy with the upper layer (Figure 2c). In terms of spectral properties, the observed intraseasonal currents are stronger in the eastern equatorial Indian Ocean compared to those observed at Lombok and Ombai Straits. We note that all spectra show distinct peaks within the 30–70 day band.
It is noteworthy that the observed currents in Lombok and Ombai Straits show distinct spectral peaks at higher frequency band (Figures 2b and 2c). In the Lombok Strait, the near surface current shows distinct spectral peaks at period of 14 and 20 day, while the deeper current only show one distinct peak at period of about 15 day (Figure 2b). On the other hand, the observed currents in the Ombai Strait show a pro-nounced peak at period of about 14 day. In contrast, there is virtually no energy at this period in the observed currents in the eastern equatorial Indian Ocean. Therefore, we may suggest that these high-frequency variations are locally excited.
3.2. Dynamical Interpretation
As shown in earlier discussion of the spectral characteristics of the time series (Figures 2a–2c), the intrasea-sonal variations do not appear to have a fixed frequency band. Thus, we selected the band of most ener-getic frequencies to define the intraseasonal variations in this study. The resulting band includes periods between 30 and 70 days. To extract the intraseasonal signals, we have applied the 30–70 day band-pass fil-ter to all quantities [Torrence and Compo, 1998]. Unless otherwise specified, all intraseasonal variabilities dis-cussed in later sections are obtained in this manner.
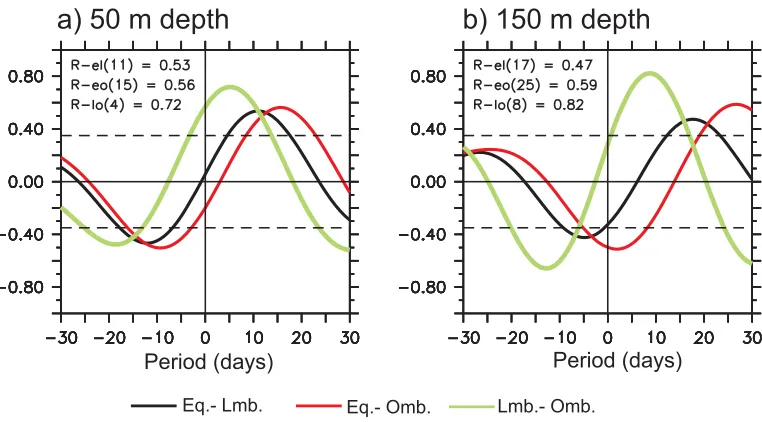
In order to evaluate the relationships between the oceanic intraseasonal variations in the eastern equatorial Indian Ocean and in the outflow straits of the ITF, we first performed a lag-correlation analysis within the intraseasonal band. It reveals that the observed currents in the Lombok and Ombai Straits are highly corre-lated with that in the eastern equatorial Indian Ocean, with a tendency for the observed currents in the eastern equatorial Indian Ocean to lead those at the Lombok and Ombai Straits (Figure 3). At 50 m depth, maximum correlations occur when the observed currents in the eastern equatorial Indian Ocean lead those in the Lombok and Ombai Straits by 11 and 15 days, respectively (Figure 3a). At 150 m depth, maximum correlations are observed when the currents in the eastern equatorial Indian Ocean lead those at Lombok
a) Equator
b) Lombok St.
c) Ombai St.
Figure 2.Variance preserving spectra (m2/s2/cpd) for (a) zonal velocity in the eastern equatorial Indian Ocean, (b) meridional velocity in the Lombok Strait, and (c) along channel velocity
and Ombai Straits by 17 and 25 days, respectively (Figure 3b). We also note that the intraseasonal signals observed in the Lombok Strait lead those observed in the Ombai Strait by 4 days at 50 m depth and 8 days at 150 m depth. These results indicate that there is an eastward propagation signal from the eastern equa-torial Indian Ocean to the Lombok and Ombai Straits. The different time lag between the upper and lower layers may be attributed to a difference in the dominant mode of variability between the upper and lower layers. The upper layer is more preferred for the first baroclinic mode, while the second mode is more prom-inent in the deeper layer [Iskandar et al., 2006]. In addition, a modification of the phase speed of intraseaso-nal Kelvin waves by the surface wind forcing could be another mechanism that explains this different [Roundy and Kiladis, 2006;Shinoda et al., 2008]. Wind forcing that moves faster than the free Kelvin wave speed can increase the phase speed of the Kelvin waves. For example,Shinoda et al. [2008] have shown that the wind fields, which propagate at phase speed of about 9 m/s can generate Kelvin waves with a phase speed of about 4 m/s.
We estimated the phase speed based on those time-lag correlations at both 50 and 150 m depth. The mean phase speed with its 95% confidence limit is 2.6460.83 m s21. Note that the 95% confidence limit is
computed following procedure described byEmery and Thomson[2004] for trend analysis. This phase speed corresponds well with the first baroclinic mode, though with its uncertainty, it also corresponds to the sec-ond baroclinic mode (e.g., the first modec152.8360.20 m s21, and the second modec251.8060.14 m
s21) observed in the ITF regions [Drushka et al., 2010].
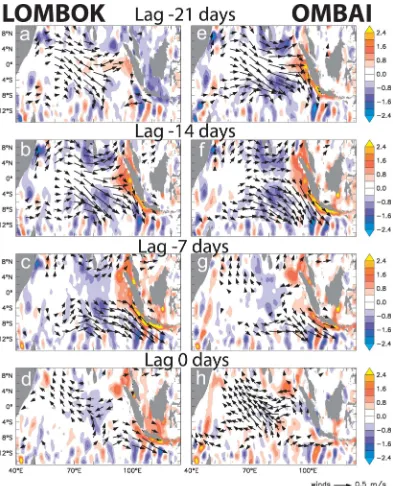
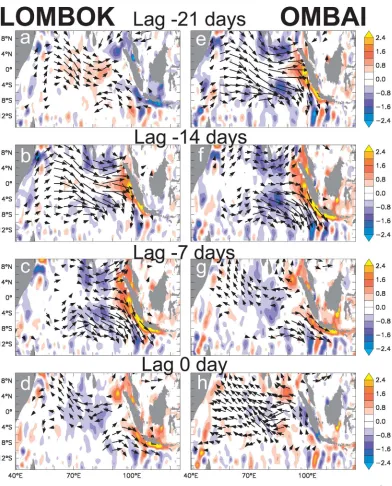
In order to illustrate the eastward propagation of intraseasonal oceanic variations in relation to the intrasea-sonal atmospheric forcing, maps are constructed by regressing intraseaintrasea-sonal wind stress and SSH onto the intraseasonal currents at Lombok and Ombai Straits for different lags. Maps of the spatial regression struc-tures are shown in Figure 4 for lagss5 221 to 0 day at 7 day intervals. Note that the regressions for the
wind stress were calculated separately for the zonal and meridional wind components.
The SSH response to intraseasonal wind forcing indicates the presence of equatorially trapped waves near the equator and coastally trapped waves along the coast of Sumatra and Java. At lag221 days (Figures 4a, 4e, 5a, and 5e), westerly winds generate downwelling Kelvin waves (elevated sea levels) along the equator. These sea level patterns propagate eastward. Upon reaching the west coast of Sumatra, the signals propa-gate poleward both north and south of the equator as would be expected for coastal Kelvin waves (Figures 4b, 4f, 5b, and 5f) [Clarke and Liu, 1993]. Part of the energy is also reflected back to the interior Indian Ocean as would be expected for boundary generated, westward propagating, low baroclinic mode Rossby waves.
a) 50 m depth
b) 150 m depth
Eq.- Lmb. Eq.- Omb. Lmb.- Omb.
Period (days)
Period (days)
Elevated sea levels associated with downwelling Kelvin waves can be traced southeastward following the coastal waveguide to the Lombok and Ombai Straits (Figures 4 and 5). This indicates that Kelvin waves origi-nated in the equatorial Indian Ocean could penetrate southeastward as coastal Kelvin waves and reach the Lombok and Ombai Straits.
On the other hand, the intraseasonal currents at Lombok and Ombai Straits show significant correlations with the intraseasonal winds off Sumatra (Figures 4c, 4g, 5c, and 5g), while only the intraseasonal currents at Lombok Strait reveal high correlation with alongshore winds off south Java (Figures 4d, 4h, 5d, and 5h). This result is in agreement with previous observational [Chong et al., 2000] and numerical [Qiu et al., 1999] studies that suggested a dominant role of remote equatorial Indian Ocean winds in generating intraseaso-nal oceanic variations in the ITF regions.
4. Intraseasonal Variations in the Model
4.1. Comparison With Observations
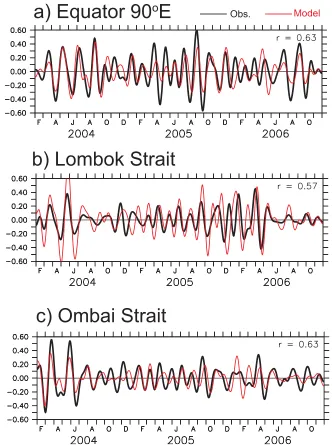
To validate the model output, Figure 6 shows the time series of intraseasonal currents at 50 m depth during February 2004 to November 2006 at all mooring locations. At all mooring sites, the model is able to capture much the observed intraseasonal variations, with model-data correlation coefficients of 0.63 at the eastern equatorial Indian Ocean, 0.57 at the Lombok Strait, and 0.62 at the Ombai Strait, all of which are above 95% confidence limit.
The slopes of linear regression fits between the observations and the model (Table 2) are close to unity, with tendency for underestimation in the eastern equatorial Indian Ocean and in the Ombai Strait, and
a) Equator 90
o
E
b) Lombok Strait
c) Ombai Strait
Obs. Model
Figure 6.Intraseasonal components (m/s) of (a) zonal currents in the eastern equatorial Indian Ocean, (b) meridional currents in the Lom-bok Strait, and (c) along channel flow in the Ombai Strait at 50 m depth for the observations (black) and the simulation (red).
Table 2.Statistical Comparison Between the Model and the Observationsa
Location Corr (95%) Slope RMS (m s21)
50 m Depth
Equator 0.62 0.8260.33 0.05 Lombok 0.57 1.0860.46 0.09
Ombai 0.62 0.8760.35 0.04
150 m Depth
Equator 0.53 0.7560.32 0.03 Lombok 0.70 0.4560.17 0.02
Ombai 0.49 0.2260.09 0.07
aCorr. is the correlation coefficient which is above 95% confidence level (0.48).Slopeis the neutral regression slope determined by
overestimation in the Lombok Strait. Note that for the simulated current in the Lombok Strait, we use a loca-tion in the south of Lombok Strait (e.g., in the Indian Ocean site). This may contribute to the devialoca-tion from unity in the regression slope at the Lombok Strait. Summary of the statistical comparison between the model and the observations for the depth of 50 and 150 m is presented in Table 1.
Variance-preserving spectra of the model oceanic currents at all mooring sites are shown in Figure 7. The spectra are calculated for the 7 year period of January 2001 to December 2007. Within the intraseasonal band, the model is able to capture dominant 30–70 day variations revealed in the observations (see Figure 2), though the model tends to overestimate the intraseasonal variations in the Lombok Strait. Nevertheless, this reasonable agreement between the simulated and observed variabilities, together with the statistics for model-data comparisons suggest that the model has captured the major physics that determine the intra-seasonal variability, and it is sufficiently realistic for our purpose.
4.2. Vertical Mode Decomposition
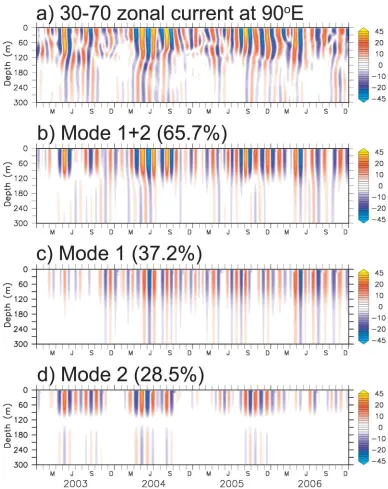
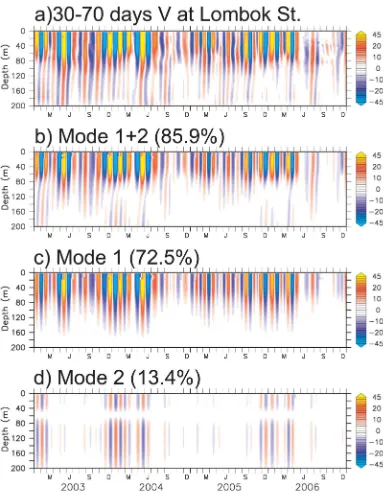
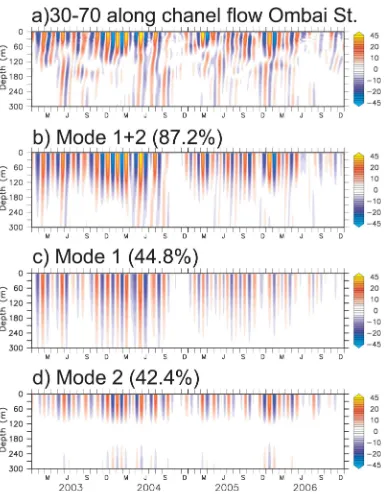
In order to explore the dynamics underlying the observed coherent intraseasonal variations discussed in the early sections, we used the vertical modal decomposition method [Gill, 1982]. The vertical modes are calculated in similar way to the method used byIskandar et al. [2006]. Readers are invited to refer to this work for more technical details. The vertical modes are derived using the model mean stratification (January 2001 to December 2007) at each mooring sites. The contribution from each vertical baroclinic mode to the intraseasonal currents at each mooring site is then calculated by projecting the time series of each baro-clinic mode to its vertical structure. The reconstructed time series from the first two barobaro-clinic modes at all mooring sites are presented in Figures 8–10. Note that for clarity only 4 years (January 2003 to December 2006) are shown.
Consistent with the previous observational [Sprintall et al., 2000;Chong et al., 2000;Drushka et al., 2010] and numerical [Iskandar et al., 2006, 2008] studies, the most energetic Kelvin waves are found to be for the first two baroclinic modes. Sum of these two baroclinic modes explain up to 65.7% of the total variance in the eastern equatorial Indian Ocean (Figure 8). In the Lombok Strait, the first two baroclinic modes account for 85.9% of the total variance (Figure 9), while in the Ombai Strait they contribute up to 87.2% of the total var-iance (Figure 10).
The first baroclinic mode is dominant in the eastern equatorial Indian Ocean and in the Lombok Strait, which explains up to 37.2% and 72.5% of the total variance, respectively. In the Ombai Strait, the first and second baroclinic modes have comparable contribution to the intraseasonal currents. Each mode explains up to 44.8% and 42.4% of the total variance, respectively.
a) Equator
b) Lombok St.
c) Ombai St.
The reconstructed time series at all mooring sites show large amplitude of variability above100 m as expected for low baroclinic mode structures (Figures 8–10). Below100 m, the amplitude of variability is decreased markedly with depth. In addition, the reconstructed time series of the second baroclinic mode in the Lombok Strait also show energetic intraseasonal variability below100 m (Figure 9).
In terms of temporal variations, variability of reconstructed time series of the second mode in the eastern equatorial Indian increases during 2003, 2004, and late 2005 (Figure 8d), while that of the first mode shows a significant decrease during 2003 (Figure 8c). In the Lombok and Ombai Straits, the reconstructed time series of the first two baroclinic modes show significant decrease during late 2004 and 2006 (Figures 9 and 10). Investigation on the wind variability along the equator within intraseasonal time scale indicates that the intraseasonal signals during 2003, late 2004, and 2006 are weak (not shown). Similarly, the alongshore Figure 8.Intraseasonal zonal currents at 0S, 90E from (a) model simulation, and reconstructed from (b) the first two baroclinic modes, (c)
wind activities are also relatively weak during late 2004 and 2006, but not during 2003 (not shown). Note that we used the zonal wind component for the definition of alongshore winds along the coast of Java, whereas both zonal and meridional wind components are considered to calculate the alongshore component along the coast of Sumatra. Possible reasons for the interannual variations will be discussed in the last section.
4.3. Remote Wind Forcing Versus Local Wind Forcing
In this section, we further investigate the role of remote and local wind forcing in generating intraseasonal current variations in the Lombok and Ombai Straits. For consistency with the observational analysis, we per-form regression analysis between the model intraseasonal sea level, the intraseasonal winds, and the time series of the first two baroclinic modes in the Lombok and Ombai Straits (Figures 11 and 12).
The model reproduces well the eastward propagating signals generated in the equatorial Indian Ocean. Consistent with the observations (Figure 4), the model shows that the equatorial Kelvin waves separated into poleward propagating coastal Kelvin waves and boundary reflected Rossby waves upon reaching the west coast of Sumatra (Figures 11 and 12). Both the first and second baroclinic modes can be traced east-ward following coastal waveguide to the Lombok and Ombai Straits. The first and second baroclinic modes in the Lombok Strait are significantly correlated with the remote equatorial winds and alongshore winds off Sumatra and Java (Figures 11e, 11f, 11g, and 11h). Interestingly, we found that only the first baroclinic mode of the intraseasonal currents in the Ombai Strait is significantly correlated with both remote and local wind forcing. The second baroclinic mode only shows significant correlation with the remote wind forcing from the equatorial Indian Ocean. This result highlights the dominant role of equatorial winds in generating intraseasonal current variations in the Ombai Strait.
5. Discussion and Conclusions
Measurements from ADCP moorings in the eastern equatorial Indian Ocean and in the Lombok and Ombai Straits combined with outputs from the OFES have been used to analyze the coherent oceanic intraseasonal variations in this region. In addition, we have also investigated the dynamics underlying the coherency based on the wind-forced generated Kelvin waves along the equatorial and coastal waveguides.
intraseasonal variations in the eastern equatorial Indian Oceanleadthose observed in the Lombok and Ombai Straits (Figure 3), indicating a presence of eastward propagating signal originated in the equatorial Indian Ocean.
The regression analysis of the intraseasonal wind stress and SSH onto the observed intraseasonal currents displays spatial illustrations of the eastward propagating signals from the equatorial Indian Ocean to the Lombok and Ombai Straits (Figures 4 and 5). As oceanic response to the westerly winds, elevated sea levels associated with downwelling Kelvin waves are generated. The waves propagate eastward and reach the eastern boundary few days later. Part of the energy of the waves reflected back into the interior Indian
Ocean as boundary-generated Rossby waves. Other parts propagate poleward to north and south as would be expected for the coastal Kelvin waves. In particular, the southward propagating signals can be traced fur-ther southeastward to the Lombok and Ombai Straits, indicating the presence of eastward propagating sig-nals originated in the equatorial region.
Vertical modal decomposition analysis performed on the simulated intraseasonal currents shows that the first two baroclinic modes dominate the intraseasonal variations in this region. In the eastern equatorial Indian Ocean and in the Lombok Strait, the first baroclinic mode contributes up to 37.2% and 72.5% of the total explained variance, respectively (Figures 8 and 9). On the other hand, the first and second baroclinic modes give a comparable contribution to the intraseasonal variations in the Ombai Strait, which explains about 44.8% and 42.4% of the total explained variance, respectively (Figure 10).
Consistent with the previous observational [Sprintall et al., 2000;Chong et al., 2000;Drushka et al., 2010] and numerical [Iskandar et al., 2006] studies, remote wind forcing from the equatorial Indian Ocean and along-shore wind forcing play a role in generating intraseasonal variations in the Lombok and Ombai Straits. Both the first and second baroclinic modes in the Lombok Strait are significantly correlated with the remote and local wind forcing (Figure 11). Interestingly, we found that only the first baroclinic mode of the intraseasonal currents in the Ombai Strait is significantly correlated with both remote and local wind forcing. The second baroclinic mode only shows significant correlation with the remote wind forcing from the equatorial Indian Ocean (Figure 12). This result highlights the dominant role of equatorial winds in generating intraseasonal current variations in the Ombai Strait.
It is also interesting to note that the reconstructed time series of the intraseasonal variations in the eastern equatorial Indian Ocean and in the Lombok and Ombai Straits reveals interannual modulation (Figures 8– 10).Iskandar et al. [2008] have shown that the contribution from higher baroclinic modes increase during the positive Indian Ocean Dipole (IOD) event. They suggested that the presence of shoaled sharp pycno-cline in the eastern equatorial Indian Ocean during positive IOD event is favorable for the projection of wind forcing onto the higher baroclinic modes. In this study, we found that the second mode in the eastern equatorial Indian increases during 2003, 2004, and late 2005, while that of the first mode shows a significant decrease during 2003 (Figure 8). However, we do not observe a distinct change during positive IOD event in 2006. In the Lombok and Ombai Straits, the reconstructed time series of the first two baroclinic modes show significant decrease during late 2004 and 2006 (Figures 9 and 10). However, in this study, we are not able to show with confidence a detailed mechanism for the interannual modulation of intraseasonal signals in the ITF region. We are currently conducting a detailed analysis on low-frequency modulation of intrasea-sonal variations in the ITF region using a longer output from OFES, results of which will be the subject of a subsequent paper.
References
Arief, D., and S. P. Muray (1996), Low-frequency fluctuations in the Indonesian Throughflow through Lombok Strait,J. Geophys. Res.,101, 12,455–12,464.
Boyer, T. P., S. Levitus, J. I. Antonov, M. E. Conkright, T. O’Brien, and C. Stephens (1998a),World Ocean Atlas 1998, vol.4,Salinity of the Atlan-tic Ocean, NOAA Atlas NESDIS 30, U.S. Gov. Print. Off., Washington, D. C.
Boyer, T. P., S. Levitus, J. I. Antonov, M. E. Conkright, T. O’Brien, and C. Stephens (1998b),World Ocean Atlas 1998, vol.5,Salinity of the Pacific Ocean, NOAA Atlas NESDIS 31, U.S. Gov. Print. Off., Washington, D. C.
Boyer, T. P., S. Levitus, J. I. Antonov, M. E. Conkright, T. O’Brien, C. Stephens, and B. Trotsenko (1998c),World Ocean Atlas 1998, vol.6,Salinity of the Indian Ocean, NOAA Atlas NESDIS 32, U.S. Gov. Print. Off., Washington, D. C.
Cai, W., G. A. Meyers, and G. Shi (2005), Transmission of ENSO signal to the Indian Ocean,Geophys. Res. Lett.,32, L05616, doi:10.1029/ 2004GL021736.
Chong, J. C., J. Sprintall, S. Hautala, W. Morawitz, N. A. Bray, and W. Pandoe (2000), Shallow throughflow variability in the outflow straits of Indonesia,Geophys. Res. Lett.,27, 125–128.
Clarke, A. J., and X. Liu (1993), Observations and dynamics of semiannual and annual sea levels near the eastern equatorial Indian Ocean boundary,J. Phys. Oceanogr.,23, 386–399.
Cowley, R., B. Heaney, S. Wijffels, L. Pender, J. Sprintall, S. Kawamoto, and R. Molcard (2008), INSTANT Sunda data report: Description and quality control, Ver. 5, CSIRO Mar. and Atmos. Res., Hobart, Tasmania, Australia.
Drushka, K., J. Sprintall, S. T. Gille, and I. Brodjonegoro (2010), Vertical structure of Kelvin waves in the Indonesian Throughflow exit pas-sages,J. Phys. Oceanogr.,40, 1965–1987.
Emery, W. J., and R. E. Thomson (2004),Data Analysis Methods in Physical Oceanography, 638 pp., Elseiver, Amsterdam. Ffield, A., and A. L. Gordon (1992), Vertical mixing in the Indonesian thermocline,J. Phys. Oceanogr.,22, 184–195. Garrett, C., and B. Petrie (1981), Dynamical aspect of the flow through the strait of Belle Isla,J. Phys. Oceanogr.,11, 376–393. Gill, A. E. (1982),Atmosphere-Ocean Dynamics, Int. Geophys. Ser., vol.30, 662 pp., Elsevier, New York.
Godfrey, J. S. (1996), The effect of the Indonesian Throughflow on ocean circulation and heat exchange with the atmosphere: A review,J. Geophys. Res.,101, 12,217–12,238.
Gordon, A. L., and R. Fine (1996), Pathways of water between the Pacific and Indian Oceans in the Indonesian seas,Nature,379, 146–149. Hirst, A. C., and J. S. Godfrey (1993), The role of Indonesian Throughflow in a global ocean GCM,J. Phys. Oceanogr.,23, 1057–1086. Iskandar, I., and M. J. McPhaden (2011), Dynamics of wind-forced intraseasonal zonal current variations in the equatorial Indian Ocean,J.
Geophys. Res.,116, C06019, doi:10.1029/2010JC006864.
Iskandar, I., W. Mardiansyah, Y. Masumoto, and T. Yamagata (2005), Intraseasonal Kelvin waves along the southern coasts of Sumatra and Java,J. Geophys. Res.,110, C04013, doi:10.1029/2004JC002508.
Iskandar, I., T. Tozuka, H. Sasaki, Y. Masumoto, and T. Yamagata (2006), Intraseasonal variations of surface and subsurface currents off Java as simulated in a high-resolution ocean general circulation model,J. Geophys. Res.,111, C12015, doi:10.1029/2006JC003486.
Iskandar, I., T. Tozuka, Y. Masumoto, and T. Yamagata (2008), Impact of Indian Ocean Dipole on intraseasonal zonal currents at 90E on the
equator as revealed by self-organizing map,Geophys. Res. Lett.,35, L14S03, doi:10.1029/2008GL033468.
Iskandar, I., Y. Masumoto, and K. Mizuno (2009), Subsurface equatorial zonal current in the eastern Indian Ocean,J. Geophys. Res.,114, C06005, doi:10.1029/2008JC005188.
Kalnay, E., et al. (1996), The NCEP/NCAR 40-year reanalysis project,Bull. Am. Meteorol. Soc.,77, 437–471.
Large, W. G., J. C. McWilliams, and S. C. Doney (1994), Oceanic vertical mixing—A review and a model with a nonlocal boundary layer parameterization,Rev. Geophys.,32, 363–403.
Masumoto, Y., et al. (2004), A fifty-year eddy-resolving simulation of the world ocean—Preliminary outcomes of OFES (OGCM for the Earth Simulator),J. Earth Simul.,1, 35–56.
Masumoto, Y., H. Hase, Y. Kuroda, H. Matsuura, and K. Takeuchi (2005), Intraseasonal variability in the upper layer currents observed in the eastern equatorial Indian Ocean,Geophys. Res. Lett.,32, L02607, doi:10.1029/2004GL021896.
Pacanowski, R. C., and S. M. Griffies (2000), MOM 3.0 Manual,Geophys. Fluid Dyn. Lab./NOAA, 680 pp, Princeton, N. J.
Qiu, B., M. Mao, and Y. Kashino (1999), Intraseasonal variability in the Indo-Pacific throughflow and regions surrounding the Indonesian seas,J. Phys. Oceanogr.,29, 1599–1618.
Roundy, P. E., and G. N. Kiladis (2006), Observed relationships between oceanic Kelvin waves and atmospheric forcing,J. Clim.,19, 5253– 5272.
Sasaki, H., M. Nonaka, Y. Masumoto, Y. Sasai, H. Uehara, and H. Sakuma (2008), An eddy-resolving hindcast simulation of the quasiglobal ocean from 1950 to 2003 on the Earth Simulator, inHigh Resolution Numerical Modelling of the Atmosphere and Ocean, chap. 10, edited by K. Hamilton and W. Ohfuchi, pp. 157–186, Springer, New York.
Schiller, A., S. E. Wijffels, J. Sprintall, R. Molcard, and P. R. Oke (2010), Pathways of intraseasonal variability in the Indonesian Throughflow region,Dyn. Atmos. Oceans,50, 174–200.
Shi, G., J. Ribbe, W. Cai, and T. Cowan (2007), Multidecadal variability in the transmission of ENSO signals to the Indian Ocean,Geophys. Res., Lett.,34, L09706, doi:10.1029/2007GL029528.
Shinoda, T., P. E. Roundy, and G. N. Kiladis (2008), Variability of intraseasonal Kelvin waves in the equatorial Pacific Ocean,J. Phys. Ocean-ogr.,38, 921–944.
Smith, R. D., M. E. Maltrud, F. O. Bryan, and M. W. Hecht (2000), Numerical simulation of the North Atlantic Ocean at 1/10,J. Phys.
Ocean-ogr.,30, 1532–1561.
Song, Q., G. A. Vecchi, and A. J. Rosati (2007), The role of the Indonesian Throughflow in the Indo-Pacific climate variability in the GFDL coupled climate model,J. Clim.,20, 2434–2451.
Sprintall, J., J. Chong, F. Syamsudin, W. Morawitz, S. Hautala, N. A. Bray, and S. Wijffels (1999), Dynamics of the South Java Current in the Indo-Australian basin,Geophys. Res. Lett.,26, 2493–2496.
Sprintall, J., A. L. Gordon, R. Murtugudde, and R. D. Susanto (2000), A semiannual Indian Ocean forced Kelvin wave observed in the Indone-sian seas in May 1997,J. Geophys. Res.,105, 17,217–17,230.
Sprintall, J., S. Wijffels, A. L. Gordon, A. Ffield, R. Molcard, R. D. Susanto, I. Soesilo, J. Sopaheluwakan, Y. Surachman, and H. M. van Aken (2004), A new international array to measure the Indonesian Throughflow: INSTANT,Eos Trans. AGU,85(39), 369–376.
Sprintall, J., S. Wijffels, R. Molcard, and I. Jaya (2009), Direct estimates of the Indonesian Throughflow entering the Indian Ocean: 2004– 2006,J. Geophys. Res.,114, C07001, doi:10.1029/2008JC005257.
Torrence, C., and G. P. Compo (1998), A practical guide to wavelet analysis,Bull. Am. Meteorol. Soc.,79, 61–78.
van Aken, H. M., J. Punjaman, and S. Saimima (1988), Physical aspects of the flushing of the east Indonesian basins,Neth. J. Sea Res.,22, 315–339.
Vranes, K., A. L. Gordon, and A. Ffield (2002), The heat transport of the Indonesian Throughflow and implications for the Indian Ocean heat budget,Deep-Sea Res.,II, 49, 1391–1410.
Wajsowicz, R. C., and E. K. Schneider (2001), The Indonesian Throughflow’s effect on global climate determined from the COLA coupled climate system,J. Clim.,14, 3029–3042.
Weisberg, R. H., and C. Wang (1997), Slow variability in the equatorial west-central Pacific in relation to ENSO,J. Clim.,10, 1998–2017. Wijffels, S., and G. Meyers (2004), An intersection of oceanic waveguides: Variability in the Indonesian Throughflow region,J. Phys.