Optimization of transesteri
fi
cation process for
Ceiba pentandra
oil: A
comparative study between kernel-based extreme learning machine
and arti
fi
cial neural networks
F. Kusumo
a, A.S. Silitonga
a,b,c,d,*, H.H. Masjuki
a, Hwai Chyuan Ong
a, J. Siswantoro
e,
T.M.I. Mahlia
daDepartment of Mechanical Engineering, Faculty of Engineering, University of Malaya, 50603, Kuala Lumpur, Malaysia bDepartment of Mechanical Engineering, Politeknik Negeri Medan, 20155, Medan, Indonesia
cDepartment of Mechanical Engineering, Syiah Kuala University, 23111, Banda Aceh, Indonesia
dDepartment of Mechanical Engineering, Faculty of Engineering, Universiti Tenaga Nasional, 43000, Kajang, Selangor, Malaysia eDepartment of Informatics Engineering, Faculty of Engineering, Universitas Surabaya, Jl. Kali Rungkut, Surabaya, 60293, Indonesia
a r t i c l e
i n f o
Article history:
Received 20 May 2016 Received in revised form 29 April 2017
Accepted 31 May 2017 Available online 3 June 2017
Keywords:
Biodiesel Ceiba pentandra oil
Kernel-based extreme learning machine Ant colony optimization
Artificial neural network
a b s t r a c t
In this study, kernel-based extreme learning machine (K-ELM) and artificial neural network (ANN) models were developed in order to predict the conditions of an alkaline-catalysed transesterification process. The reliability of these models was assessed and compared based on the coefficient of deter-mination (R2), root mean squared error (RSME), mean average percent error (MAPE) and relative percent deviation (RPD). The K-ELM model had higher R2(0.991) and lower RSME, MAPE and RPD (0.688, 0.388 and 0.380) compared to the ANN model (0.984, 0.913, 0.640 and 0.634). Based on these results, the K-ELM model is a more reliable prediction model and it was integrated with ant colony optimization (ACO) in order to achieve the highestCeiba pentandramethyl ester yield. The optimum molar ratio of methanol to oil, KOH catalyst weight, reaction temperature, reaction time and agitation speed predicted by the K-ELM model integrated with ACO was 10:1, 1 %wt, 60C, 108 min and 1100 rpm, respectively. TheCeiba pentandramethyl ester yield attained under these optimum conditions was 99.80%. This novel integrated model provides insight on the effect of parameters investigated on the methyl ester yield, which may be useful for industries involved in biodiesel production.
©2017 Elsevier Ltd. All rights reserved.
1. Introduction
Biodiesel has gained prominence throughout the world as alternative fuel for diesel engines. Biodiesels as alternative fuels in diesel engines is not new nowadays owing to their favourable physical and chemical properties that are comparable to those for diesel, but with lower engine emissions. There is a growing trend in the biodiesel production capacity not only in developed countries such as France, Germany, Italy and the United States, but also in developing countries such as Brazil, Argentina, Indonesia and Malaysia[1]. The production of alternative fuels from renewable sources have gained much interest from scientists, researchers and
industrialists in thefield due to concerns on the depletion of fossil fuels and the impact of fossil fuel emissions on the environment. More importantly, there is a critical need to ensure a sustainable supply of energy in order to fulfil the escalating energy demands, which is not possible with fossil fuels since these fuels are derived from non-renewable sources[2]. Concerns over food security have led to the development and enforcement of policies which emphasize the production biofuels from non-agricultural sources [3]. In response to this need, scientists and researchers actively search for ways to produce biodiesels from non-edible feedstocks as well as macroalgae and microalgae[4,5].
Ceiba pentandra (C. pentandra) is commonly known as silk-cotton tree. It is a tall plant which belongs to theMalvaceae fam-ily and it is typically found in tropical rainforests. The seeds ofCeiba pentandracontain a relatively high non-edible oil content (~40 %wt, dry basis) and thus, these seeds can be used as potential feedstocks to produce biodiesels. Several experimental have been conducted *Corresponding author. Department of Mechanical Engineering, Faculty of
En-gineering, University of Malaya, 50603, Kuala Lumpur, Malaysia.
E-mail addresses:[email protected],[email protected](A.S. Silitonga).
Contents lists available atScienceDirect
Energy
j o u r n a l h o m e p a g e : w w w . e l s e v i e r . c o m / l o c a t e / e n e r g y
http://dx.doi.org/10.1016/j.energy.2017.05.196
0360-5442/©2017 Elsevier Ltd. All rights reserved.
the production of C.pentandramethyl esters (biodiesels) through a conventional process known as alkaline-catalysed trans-esterification[6,7]. Ong et al. [6]produced C. pentandra methyl ester via supercritical transesterification and the process conditions were optimized using response surface methodology (RSM). They achieved a high C.pentandramethyl ester yield of 95.5% when the molar ratio of methanol to oil, reaction time, reaction temperature and pressure was 30:1, 476 s, 322C and 167 MPa, respectively. Sivakumar et al.[7]used an alkaline-catalysed transesterification process and they also attained a high methyl ester yield of 99.5% using the following molar ratio of methanol to oil of 6:1, KOH catalyst weight of 1 %wt, reaction temperature of 65C and reaction time of 45 min.
To date, most of the models used to optimize the process con-ditions for biodiesel production are based on response surface methodology (RSM) and artificial neural networks (ANN). In both of these approaches, experimental data are used as the groundwork for modelling and optimization [8,9]. However, kernel-based extreme learning machine (K-ELM) models have also been imple-mented in recent years to study alcoholysis reactions and the process conditions for biodiesel production. Extreme learning machine (ELM) is a learning technique that was initially proposed for generalized single hidden layer feedforward networks (SLFNs) and this technique has been used to optimize processes in various engineering disciplines[10,11]. K-ELM is a learning algorithm used to determine the rational number of hidden neurons in SLFNs based on a kernel matrix. This technique is still rather new, considering that it was developed only in recent years by a few researchers. The main benefit of K-ELM is that the user only needs to identify the necessary parameters and determine one optimum solution using the kernel function. This eliminates the need to specify the number of hidden nodes unlike conventional feedforward neural networks [12,13].
ANN, on the other hand, is fundamentally different from K-ELM since the algorithm is based on the idea that the human nervous system is a data processing system. ANN is widely used for modelling complex phenomena including prediction and classifi -cation which involve a large number of independent and depen-dent [14,15]. Interestingly, ANN is also commonly used to demonstrate the effectiveness of K-ELM models. Ant colony opti-mization (ACO), however, is an optiopti-mization technique that is inspired from observations of the foraging behaviour of ant colonies.
In this study, K-ELM model is developed to predict the process conditions for alkaline-catalysed transesterification of C.pentandra oil. Prior to optimization, it isfirst necessary to develop a reliable prediction model for the transesterification process. There are numerous studies found in the literature pertaining to C.pentandra biodiesel productionehowever, there is a lack of studies pertain-ing to the mathematical modellpertain-ing of transesterification process conditions using K-ELM models. In general, the molar ratio of methanol to oil, catalyst weight, reaction time, reaction tempera-ture and agitation speed all play a crucial role in an alkaline-catalysed transesterification process and it is essential to optimize these parameters in order to achieve the highest methyl ester yield and reduce the production costs as much as possible. Hence, in this study, the reliability of the K-ELM and ANN models in predicting the conditions of the alkaline-catalysed transesterification process is determined in order to identify which is the more effective pre-diction model. The reliability of these models was assessed using the following statistical parameters: coefficient of determination (R2), mean absolute percent error (MAPE), relative percent devia-tion (RPD) and root mean squared error (RMSE).
To the best of the authors’ knowledge, none of the studies available in the literature have addressed the optimization of
process conditions for alkaline-catalysed transesterification of C. pentandra methyl ester using a novel, integrated modelling approach, which formed the motivation for this study. Moreover, the best prediction model is chosen for integration with ACO to optimize five conditions of the alkaline-catalysed trans-esterification process (the molar ratio of methanol to oil, catalyst weight, reaction time, reaction temperature and agitation speed) in order to achieve a high C.pentandramethyl ester yield.
2. Materials and methods
2.1. Raw materials and chemical reagents
The crude C. pentandraoil chosen for this study, and it was sourced from Koperasi Lestari, Cilacap, Indonesia. The following chemical reagents were all sourced from Merck: analytical-grade methanol with a purity of 99.9%, sulphuric acid with a purity of more than 98.9%, and potassium hydroxide pellets with a purity of 99%. The following certified chemical standards for gas chroma-tography (GC) were sourced from It Tech Research (M) Sdn Bhd: FAME MIX C8-C24 (100 mg, Supelco-Sigma-Aldrich) and methyl nanodecanoate (C19 with a minimum purity of 99.5%, Supelco-Sigma-Aldrich). Phenolphthalein solution (1% in ethanol) was purchased from Fluka Analytical. Whatman filter papers were sourced from Filter Fioroni, France, each having a diameter of 15 cm.
2.2. Physical and chemical properties
The physical and chemical properties of the crude C.pentandra oil and C.pentandramethyl ester were determined according to the ASTM D6751 and EN 14214 standards, as shown inTable 4. The physical and chemical properties of biodiesels obtained from other studies are also presented for comparison.
Eq.(1)was used to determine the fatty acid methyl ester (FAME) content in percent (%):
A represents the sum of the peak areas for the FAME,AEI represents the peak area of methyl heptadecanoate, which is the internal standard,CEIrepresents the concentration of the methyl heptadecanoate solution in heptane (mg/ml), VEI represents the volume of the methyl heptadecanoate solution (ml) andm repre-sents the mass of the methyl ester (mg).
Eq.(2)was used to determine the methyl ester yield in percent (%):
Methyl ester yield¼FAME Bcp
Ocp 100 (2)
here,FAME represents the fatty acid methyl ester content (%),Bcp represents the weight of the C.pentandramethyl ester (g) andOso represents the weight of the C.pentandraoil (g).
2.3. Pre-processing of C. pentandra oil
The crude C.pentandraoil needs to be pre-processed prior to transesterification due to its inherent high free fatty acid content, which will lead to saponification and reduce the methyl ester yield. Thus, the crude C. pentandra oil was pre-processed by acid-catalysed esterification in the presence of suitable process to reduce the acid value to a lower level (less than 2 mg KOH/g)[6,7]. The acid-catalysed esterification was conducted according to the
procedure of Sivakumar et al.[7]using the following parameters: methanol-to-oil volume ratio: 8:1, reaction temperature: 65C and H2SO4catalyst weight: 1.834 wt%. The crude C.pentandraoil was poured into a three neckedflask containing methanol and H2SO4 catalyst preheated at 65C. The mixture was agitated over a period of 120 min. The temperature was kept at 65 C throughout the esterification process. On completion of reaction, the mixture was poured into separating funnel and left to stand for several hours. Two layers formed in the separating funnel and the bottom layer was collected in aflask. The extraneous methanol present in the esterified oil was removed by evaporation.
2.4. Alkaline-catalysed transesterification of the esterified C. pentandra oil
The esterified C.pentandraoil was poured into a three-necked flask preheated to a temperature range of 40e65C using a circu-lating water bath. Methanol and KOH catalyst were added into the esterified oil and the mixture was stirred on a continuous basis throughout the transesterification process. In this study, the molar ratio of methanol to oil was varied from 3:1 to 15:1 whereas the concentration of the potassium hydroxide (KOH) catalyst was var-ied from 0.5 to 1.5 %wt The reaction time was varvar-ied from 60 to 150 min whereas the agitation speed was varied from 800 to 1200 rpm. Upon completion of the transesterification process, the mixture was transferred into a separating funnel and left to settle until the methyl ester and glycerine were completely separated by gravity. It shall be noted that this separation occurred after 4 h. The top layer is the C.pentandramethyl ester whereas the bottom layer is a mixture of glycerine and impurities and therefore, this layer needs to be removed. The C.pentandramethyl ester was washed with warm water several times. Lastly, traces of moisture and unreacted methanol were removed using a vacuum evaporator set at 60C.
2.5. Design of experiments
The design of experiments (DoE) approach based on the Box-Behnken experimental design was used for modelling and opti-mization in this study using Design-Expert software version 8.0.3.1 (Stat-Ease Inc., Minneapolis, MN, USA). The designed experiment consists of 46 experimental runs, as shown inTable 1. The molar ratio of methanol to oil (x1), KOH catalyst weight (x2), reaction temperature (x3), reaction time (x4) and agitation speed (x5) were varied to achieve the highest C.pentandramethyl ester yield (y). Both independent and dependent variables of the designed experiment are presented inTable 1.
2.6. Modelling of the alkaline-catalysed transesterification process
2.6.1. Fundamental concept of ELM
Extreme learning machine (ELM) was initially developed for single-hidden-layer feedforward networks (SLFNs). The parameters
in the hidden layer are initialized in a random fashion and the Moore-Penrose generalized inverse is used to compute the output weights. Eq. (3) represents the output function of the ELM for generalized SLFNs[16,17]: in which the elements are the output weights between the hidden layer ofLnodes and the output node.h(x) represents the output row vector of the hidden layer for each inputx,i.e. h(x)¼[h1(x),…, hL(x)]. h(x) is used to map the data from the input space of dimensiondto the hidden layer feature space of dimensionL,H.H is also known as the feature space of the ELM. The training data are given by {(xi,ti)|xi2Rd,ti2Rm,i¼1,…,N}. The goal of ELM is to attain the smallest training error and the smallest norm of output weights, which is an advantage over other learning algorithms [13,16].
2.6.2. Fundamental concept of K-ELM
If the user has no prior knowledge of the feature spaceh(x), the user can use Eq.(4)to define the kernel matrix of the ELM[10,18]:
Eq.(5)represents the output function of the ELM classifier:
fðxÞ ¼hðxÞHTI
With this function, it is not essential for the user to have prior knowledge of the feature spaceh(x). In this case,h(x) corresponds to the kernelK(u,v) (e.g. K(u,v)¼expð
g
u v2ÞÞ, which issup-plied to the user. In addition, it is not essential for the user to know the number of hidden nodes, which is represented by the dimen-sionLof the feature space[12,16]. In this study, MATLAB 7.10.0 software was used to model the alkaline-catalysed trans-esterification process using K-ELM.
2.6.3. Normalization of the dataset
Normalization was conducted on the dataset for the training model, ensuring that the values are within the range of [0, 1]. Eq.(6) was used for this purpose[12]:
NðvÞ ¼ ei¼ ðEi EminÞ ðEmax EminÞ
(6)
here,ei represents andEi represents the normalized parameter and original parameter, respectively.EmaxandEminrepresents the upper and lower bound of the original parameter, respectively.
Once all of the minimum and maximum values were normal-ized, the predicted values need to be denormalized after the training process. This was done using the inverse of Eq.(5) [12,19].
2.6.4. Hyper parameter tuning
The K-ELM model involves two hyper parameters, namely, the regularization factor (C) and basis function width parameter (
g
2). The best values for these parameters were chosen using the leave-one-out cross-validation (LOOCV) algorithm and the possible values forCandg
were chosen based on the exponent of 2 (i.e.2 24, 2 23,…, 224, 225)[12,16]. Table 1
Experiment design matrix for transesterification process.
Parameters Unit Coded variables Coded factor levels
1 2 3
Methanol to oil molar ratio e x1 3 9 15
Catalyst concentration %wt x2 0.5 1.0 1.5
Reaction temperature C x3 50 55 65
Reaction time min x4 60 90 150
Agitation speed rpm x5 800 1000 1200
2.6.5. Random sub-sampling cross validation
The performance of the K-ELM model was assessed using 46 datasets that may not be large enough to evaluate the performance of the K-ELM model. Therefore, random sub-sampling cross vali-dation was used in this study. Random sub-sampling is a multiple holdout which is based on splitting the data randomly into subsets whereby the size of each subset is determined by the user[20,21]. A total of 39 datasets and 7 datasets were used for training and testing, respectively. The procedure was repeated ten times and the average MAPE was determined. Eqs. (6) and (7) was used to determine the standard deviation (SD) and standard error of the mean (SEM), respectively[12]:
SD¼
In Eq.(6),Nrepresents the size of the dataset andxrepresents the mean value of the datasetx1,…,xN. In Eq.(7),nrepresents the size of the dataset or the number of observations.
2.6.6. Fundamental concept of ANN
An ANN model was also developed in this study to predict the transesterification process conditions and C.pentandramethyl ester yield. MATLAB 7.10.0 software was also used to develop the ANN model. The experimental data, consisting of 46 datasets in total, were divided into training data (80%), cross-validation data (10%) and testing data (10%) in a random manner. The three layer feed-forward scheme was chosen for this study. The tansig transfer function was applied for the input layer to the hidden layer while thepurelintransfer function was applied for the hidden layer to the output layer.
Eqs. (8) and (9) represents the tansig and purelin transfer function, respectively[22,23]:
tansigðxÞ ¼ 2
1þ e 2x 1 (8)
A¼purelinðxÞ ¼x (9)
The Levenberg-Marquardt backpropagation algorithm was used for the ANN. The ANN architecture is composed of three input layers withfive inputs, hidden layers with the optimum number of neurons and one output variable. Thefive inputs are the molar ratio of methanol to oil, KOH catalyst weight, reaction temperature, re-action time and agitation speed. Training was carried out until the minimum mean squared error (MSE) was reached and the average correlation coefficient (R) was close or equal to 1.
2.6.7. Verification of the data
The following statistical parameters were used to assess the performance of the K-ELM and ANN models: R2, MAPE, RMSE and RPD. These parameters are given by Eq.(10) (13)[24,25]:
R2¼1 X
here,nrepresents the number of experimental data.xia,xibandxm represents the experimental value, computed value and mean experimental value, respectively. The R2value is an indicator of the accuracy (and hence, reliability) of the prediction models, whereby a higher R2value indicates higher accuracy. As a rule of thumb, the R2value should be greater than or equal to 80%[26]. The MAPE, RMSE and RPD values indicate the reliability of the model and it is important to reduce these parameters as much as possible.
2.6.8. Sensitivity analysis of the transesterification process conditions
Sensitivity analysis was used to determine the impact of an in-dependent variable towards a in-dependent variable based on a set of assumptions[27]. Various combinations of inputs were tested us-ing the K-ELM model to determine the impact of each input parameter on the C.pentandramethyl ester yield. However, it shall be noted one input was eliminated from each combination. The MAPE was used to assess the impact of each combination of inputs on the predicted C. pentandramethyl ester yield using the test dataset.
2.6.9. Optimization of the transesterification process conditions using ACO
ACO is an artificial intelligence technique commonly used to solve complex optimization problems. As the name implies, ACO is inspired from the foraging behaviour of ant colonies[28]. In the wild, ants will leave their nest in search of food and they will leave a chemical scent (known as pheromone) along the way, which is recognized by other members of the colony[19]. Eq.(14)represents the probability of an ant moving from nodeito nodej[19,29]:
Pi;j¼
here,
t
i;jrepresents the amount of pheromone on edgei,j.a
rep-resents the parameter used to control the effect oft
i;j.t
i;jand ni;j represent the desirability of edge i,j (typically 1/di,j) whereasb
represents the parameter used to control the effect ofni;j. Eq.(15) was used to update the amount of pheromone[28,30]:t
i;j¼ ð1r
Þt
i;jþD
t
i;j (15)In this equation,
t
i;jrepresents the amount of pheromone on edgei,j,r
represents the rate of evaporation of the pheromone, andD
t
i;jrepresents the amount of pheromone deposited.
Eq.(16)was used for the amount of pheromone if antktravels on edgei,j[29,31]:
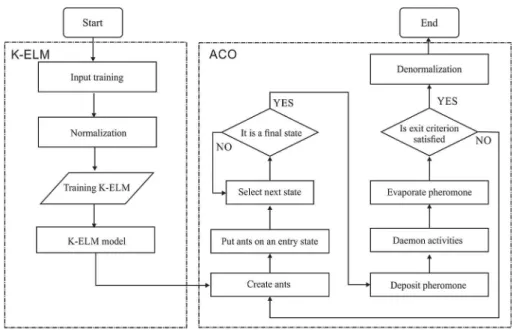
Here, Lk represents the cost of the kth ant’s tour (typically length)[19,31]. The flow chart of the K-ELM model is shown in Fig. 1.
3. Results and discussion
3.1. Prediction of the transesterification process conditions by the K-ELM model
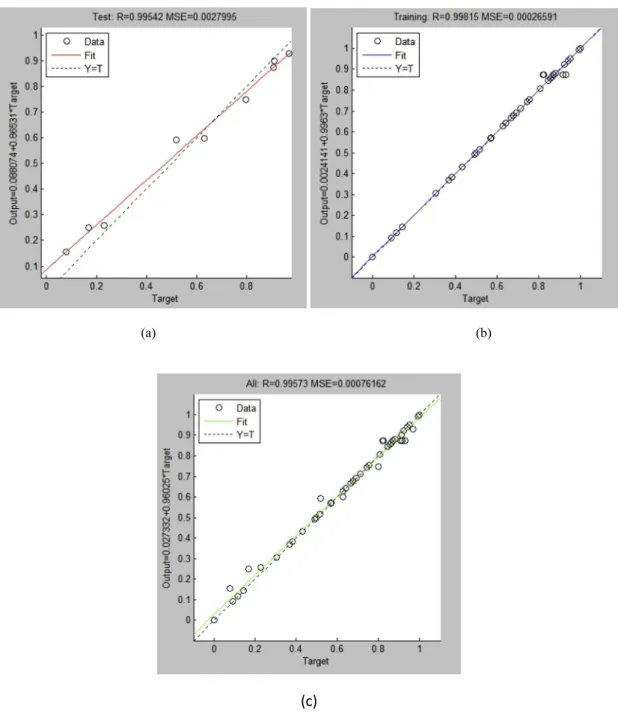
The molar ratio of methanol to oil, KOH catalyst weight, re-action temperature, rere-action time and agitation speed were used as the inputs in the Box-Behnken designed experimental condi-tion. The aforementioned parameters were optimized in order to achieve the highest C.pentandramethyl ester yield. Training was conducted using the K-ELM model until the lowest MSE was achieved and the average R was close or equal to 1. It can be observed fromFig. 2that R values generated by the K-ELM model from the training value, test value and all value are 0.995, 0.998 and 0.995, respectively. It can be deduced that the model was reliable since the slope of the linear line for the K-ELM model is very close to 1. Hence, the number of iterations was keyed into the programme, initiating training of the data. The training data were compared with the experimental data to verify if the K-ELM model was reliable to predict the conditions of the trans-esterification process. The R2, RMSE, MAPE and RPD values were used to assess the reliability of the model [11], as shown in Table 2. It can be seen that the R2value of the K-ELM model is 0.991, which was higher than 0.80. The RMSE, MAPE and RPD was found to be 0.668, 0.388 and 0.380 respectively. This indicates that the K-ELM model was reliable as a prediction model because of its high accuracy and low error values. More importantly, the values predicted by the K-ELM model show excellent agreement with the experimental data.
3.2. Random sub-sampling cross validation for the K-ELM model
A total of 39 datasets were used for training whereas the remaining 7 datasets were used for testing. The process was repeated ten times using various combinations of inputs with the same user-defined parametersðC¼225and
g
¼20Þ, as shown in Table 3. Based on the results inTable 3, the SD and MSE of the random sub-sampling cross validation was found to be 0.117 and 0.037, respectively which is indicated the accuracy of the models.3.3. Prediction of the transesterification process conditions by the ANN model
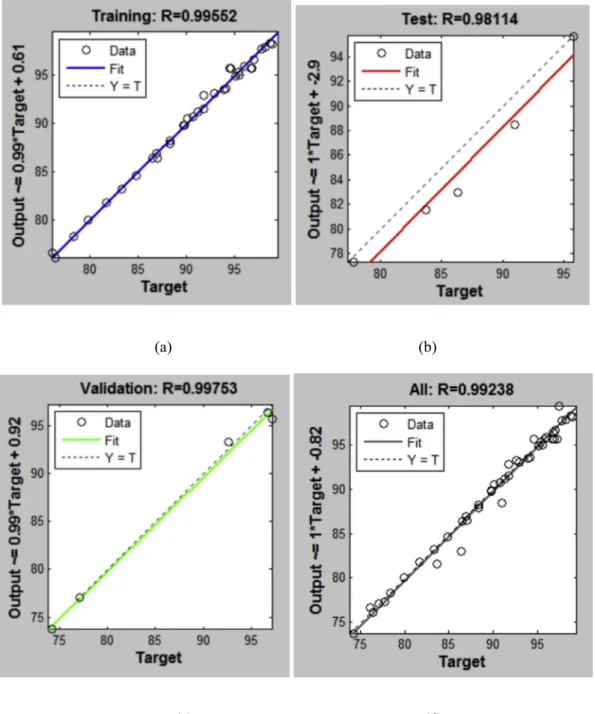
When implementing ANNs, it was imperative to choose a suit-able number of neurons in the hidden layer in order to account for the complexity of the experimental dataset[25,32]. The ANN model was built using a heuristic procedure and the resulting confi gura-tion chosen for this study was 5-6-1. This configuration was chosen since it had the lowest MSE for training, validation and testing, with a value of 0.363, 0.596 and 4.331, respectively. This configuration also had the highest R for training, validation and testing, with a value of 0.995, 0.997 and 0.981, respectively.Fig. 3shows that there is a negligible difference between the testing and validation curves when the ANN was trained for 27 epochs with an error goal of 1 10 2. There is no significant overfitting from the training, validation and testing errors when the number of neurons in the hidden layer was 5, indicating that this number of neurons is suitable for the ANN model. The R2, RMSE, MAPE and RPD is found to be 0.984, 0.913, 0.640 and 0.643, respectively, as shown in Table 2. It is evident from the residual error of the ANN model that there was goodfit between the predicted and experimental data.
3.4. Comparison between the K-ELM and ANN models
The following statistical parameters were used to assess the reliability of the K-ELM and ANN models developed in this study: RMSE, R2, RPD and MAPE[11,25], and the results are presented in Table 2. The R2value for the ANN model and K-ELM model is 0.984 and 0.991, respectively. In general, both of these models are reliable to predict the conditions of the alkaline-catalysed trans-esterification process. However, the K-ELM model is more accurate than the ANN model, as indicated by the higher R2value. The RMSE, RPD and MAPE for the ANN model was 0.913, 0.634 and 0.640, respectively. In contrast, the RMSE, RPD and MAPE are significantly lower for the K-ELM model, with a value of 0.688, 0.380 and 0.388, respectively. The values for each experimental run predicted using the ANN and K-ELM models as well as the corresponding methyl ester yield are shown inFig. 4. In general, the values predicted by the trained K-ELM model fall within closer proximity of the experimental data compared to the ANN model, implying that the Fig. 1.Flow chart for K-ELM.
K-ELM model is more reliable as a prediction model compared to ANN. In addition, the ANN model requires a large number of iter-ations, which makes it less favourable compared to the K-ELM model [9,33]. For this reason, the K-ELM model was chosen to optimize the transesterification process parameters in order to attain the highest C.pentandramethyl ester yield. This was done by integrating the K-ELM model with ACO.
3.5. Sensitivity analysis for the K-ELM model
The MAPE was used to examine the impact of the process conditions on the predicted C.pentandramethyl ester yield. Various combinations of inputs were used to determine the impact of each input parameter for the K-ELM model[12,34].Table 4shows the impact of different levels of inputs (molar ratio of methanol to oil, KOH catalyst weight, reaction temperature, reaction time and
agitation speed) on the C.pentandramethyl ester yield based on the MAPE values. The higher MAPE value for the molar ratio of meth-anol to oil (25.169) indicates that this input variable had a more pronounced impact on the methyl ester yield produced from the transesterification process.Table 4also shows that the MAPE value for the KOH catalyst weight (5.174) and reaction temperature (5.173) are nearly equal, indicating that these input variables have a similar impact on the methyl ester yield. The MAPE for agitation speed and reaction time was 4.086 and 1.634, respectively. In general, the KOH catalyst weight, reaction temperature and agita-tion speed somewhat affects the methyl ester yield, though the impact was not as significant as the molar ratio of methanol to oil. The reaction time has the least impact on the methyl ester yield, since this parameter had the lowest MAPE. Hence, the molar ratio of methanol to oil was the most significant parameter for the transesterification process using the K-ELM model.
(a) (b)
(c)
Fig. 2.K-ELM coefficient relation (a) training value and (b) test value and (c) all value.
3.6. Optimization of the transesterification process conditions using K-ELM model integrated with ACO
As mentioned previously in Section3.4, the K-ELM model was chosen to be integrated with ACO in order to optimize the molar ratio of methanol to oil, KOH catalyst weight, reaction temperature, Table 2
Response for transesterification process.
No Molar ratio Reaction Temperature (C) Catalyst concentration (%wt) Reaction time (min) Agitation speed (rpm) Methyl ester yield (%)
Experiment ANN K-ELM
1 3 52.5 0.5 105 1000 76.44 76.11 76.44
2 9 52.5 1.0 105 1000 94.57 95.67 95.75
3 9 52.5 1.0 150 800 93.92 93.51 92.70
4 3 40.0 1.0 105 1000 74.23 73.76 74.23
5 9 65.0 1.0 60 1000 95.36 95.27 95.36
6 15 52.5 0.5 105 1000 81.72 81.83 81.72
7 9 52.5 0.5 60 1000 91.24 91.20 91.24
8 15 52.5 1.5 105 1000 86.92 86.87 86.92
9 9 40.0 1.5 105 1000 90.71 90.74 90.71
10 9 52.5 1.0 105 1000 95.72 95.67 95.75
11 9 52.5 1.5 60 1000 95.51 95.02 95.51
12 15 52.5 1.0 105 1200 89.72 89.77 89.72
13 3 52.5 1.0 150 1000 76.13 76.62 78.04
14 3 52.5 1.0 105 1200 84.86 84.64 84.86
15 9 52.5 0.5 105 1200 97.72 97.70 97.72
16 9 40.0 1.0 60 1000 91.77 91.49 91.77
17 15 52.5 1.0 105 800 83.32 83.22 83.32
18 9 40.0 1.0 105 800 90.06 90.48 90.06
19 9 52.5 1.0 150 1200 98.13 97.86 97.14
20 9 52.5 1.0 60 800 92.58 93.27 92.58
21 3 65.0 1.0 105 1000 79.89 80.03 80.58
22 9 65.0 0.5 105 1000 91.76 92.86 91.76
23 9 65.0 1.0 150 1000 97.01 96.58 97.01
24 9 52.5 0.5 105 800 88.32 87.89 88.32
25 9 40.0 0.5 105 1000 86.52 86.38 86.52
26 3 52.5 1.5 105 1000 77.12 77.07 77.12
27 9 40.0 1.0 150 1000 87.06 86.46 88.84
28 9 52.5 1.5 105 800 94.12 93.59 94.12
29 15 52.5 1.0 60 1000 86.32 82.99 86.32
30 9 65.0 1.5 105 1000 96.72 96.39 96.44
31 3 52.5 1.0 105 800 77.77 77.29 77.77
32 15 52.5 1.0 150 1000 88.28 88.20 88.28
33 3 52.5 1.0 60 1000 78.36 78.34 80.38
34 9 40.0 1.0 105 1200 92.87 93.05 92.87
35 9 52.5 1.0 105 1000 94.52 95.67 95.75
36 9 52.5 1.5 105 1200 97.42 99.41 97.42
37 9 52.5 1.5 150 1000 95.12 94.89 95.12
38 9 52.5 0.5 150 1000 89.76 89.83 88.99
39 9 52.5 1.0 105 1000 97.14 95.67 95.75
40 9 65.0 1.0 105 800 95.98 95.85 95.98
41 9 52.5 1.0 105 1000 96.65 95.67 95.75
42 15 65.0 1.0 105 1000 90.92 88.50 90.92
43 9 52.5 1.0 105 1000 96.82 95.67 95.75
44 9 52.5 1.0 60 1200 98.89 98.12 98.89
45 15 40.0 1.0 105 1000 83.68 81.58 83.68
46 9 65.0 1.0 105 1200 98.69 98.31 98.69
R2 0.984 0.991
RMSE 0.913 0.688
MAPE 0.640 0.388
RPD 0.634 0.380
Table 3
Random subsampling cross validation.
Repetition MAPE
Repeat 1 0.723
Repeat 2 0.627
Repeat 3 0.637
Repeat 4 0.416
Repeat 5 0.449
Repeat 6 0.494
Repeat 7 0.581
Repeat 8 0.521
Repeat 9 0.684
Repeat 10 0.380
Overall average 0.551
Standard deviation (SD) 0.117
Standard error of the mean (SEM) 0.037
Table 4
Kernel based extreme learning machine sensitivity analysis.
Parameter removed from the input dataset withfive attributes MAPE
Methanol to molar ratio (X1) 25.169
Catalyst concentration (X2) 5.174
Reaction temperature (X3) 5.173
Agitation speed (X5) 4.086
Reaction time (X4) 1.634
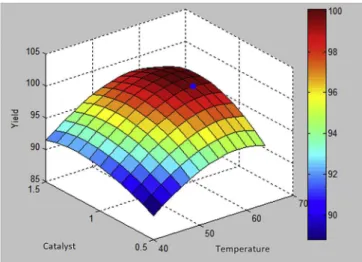
reaction time and agitation speed in order to attain the highest C. pentandramethyl ester yield. In order to prove the credibility of the optimization results, the experimental data for the molar ratio of methanol to oil, KOH catalyst weight, reaction temperature, reac-tion time and agitareac-tion speed were keyed in as the inputs for the objective function and the results were compared with the pre-dicted results. The optimum molar ratio of methanol to oil, KOH catalyst weight, reaction temperature, reaction time and agitation speed obtained from the K-ELM model integrated with ACO is 10:1, 1 %wt, 60C, 108 min and 1100 rpm, respectively. These are the optimum conditions for the transesterification process based on the optimization model developed in this study. The results are presented inTable 2andFig. 5. The C.pentandramethyl ester yield predicted with these process conditions is 99.88%, which is in very
good agreement with the experimental methyl ester yield, with a value of 99.46%, indicating a minor margin of error. Based on the sensitivity analysis for the K-ELM model, it can be deduced that the methanol-to-oil ratio has the most pronounced impact on the methyl ester yield compared to the other parameters investigated in this study. In general, it can be stated that the K-ELM model integrated with ACO was reliable to optimize the conditions of the transesterification process.
3.7. Physical and chemical properties of the C. pentandra methyl ester
The physical and chemical properties of the C.pentandramethyl ester were determined according to the procedure outlined in the
(a)
(b)
(c) (d)
Fig. 3.ANN coefficient relation (a) training, (b) value, (c) validation and (d) all value.
ASTM D6751 and EN 14214 standards and the results are presented inTable 5. In general, the physical and chemical properties of the C. pentandramethyl ester produced in this study fulfil the biodiesel requirements stipulated in both of these standards. The kinematic viscosity is an important property since it determines the behav-iour of the fuel in cold conditions and this property should be be-tween 3.5 and 5 mm2/s according to ASTM D445[35]. The density is also an important property of biodiesels besides the kinematic viscosity[36]since it determines the amount of fuel that needs to be injected for a specific engine power. A higher fuel density is undesirable since more fuel needs to be injected into the system at the same engine power. The kinematic viscosity and density of the C.pentandramethyl ester produced in this study is 4.69 mm2/s and 883.6 kg/m3, respectively. The total acid number is an important property of biodiesels and it is influenced by the free fatty acid composition of the fuel. This property was expressed in milligrams of KOH per gram of sample required to titrate a sample to a spec-ified end point[37]. In general, the total acid number should be as low as possible in order to minimize corrosion of the fuel system and components that are in direct contact with the fuel. The maximum permissible limit for the total acid number according to 70
75 80 85 90 95 100
1 3 5 7 9 11 13 15 17 19 21 23 25 27 29 31 33 35 37 39 41 43 45
Response
Experimental runs
FAME
ANN Prediction K-ELM Prediction Methyl ester yield
Fig. 4.Comparison between experimental and predicted value.
Fig. 5.Optimization of K-ELM model integrated with ACO model at molar ratio of methanol to oil: 10:1, reaction time 108 min and agitation speed 1100 rpm.
Table 5
Physicochemical properties of C.pentandraoil andC.pentandramethyl ester.
Properties Unit Test method Crude C. pentandraoila C.pentandramethyl estera Kapok methyl ester[7] Petrol diesela
Density at 15C kg/m3 D 1298 906.5 883.6 875 826
Kinematic viscosity at 40C mm2/s D 445 18.74 4.69 5.4 2.99
Flash point ºC D 93 186.5 158.5 156 72.5
Pour point C D 97 e 2.0 8 5
Cloud point C D 2500 e 3.0 e 8
Higher heating value MJ/kg EN 14214 38.672 40.276 36.292 45.483
Sulphur content mg/kg EN ISO 20846 e 8.2 0.5 42.3
Cetane number e D 613 e 56.8 54 48.5
Water content v/v EN ISO 12937 0.005 0.018 e 0.0015
Copper strip corrosion e D 130 e 1a 1a 1a
Oxidation stability h EN 14112 e 9.22 e 23.9
Acid number mg KOH/g D 664 16.2 0.18 e 0.06
Iodine value I2/100 g EN 14111 116.7 101.5 e e
FAME %wt EN 14103 e 98.9 e e
aResult.
the EN 14104 standard is 0.5 mg KOH/g[38]. The total acid number of the C.pentandramethyl ester produced in this study is 0.18 mg KOH/g, which is well below the permissible limit. Theflash point of the C.pentandramethyl ester is 158.5C, which is desirable since the value is higher than that for diesel. The higherflash point of the biodiesel is indeed favourable since it reduces safety hazards when the fuel is stored or shipped to different locations. The cloud point and pour point of the C. pentandra methyl ester is 2.0 C and 3.0 C, respectively, which are lower than those for diesel. This is indeed expected since the C.pentandraoil (the feedstock used to produce the methyl ester) has higher saturated fatty acid content. Copper corrosion strip test was conducted by heating a copper strip to 50C in a fuel bath for 3 h. The result shows that the water content of the C.pentandramethyl ester was less than 0.05 % vol. It is evident that the physical and chemical properties of the C. pentandrabiodiesel are superior to those for other fuels, as indi-cated by the lower kinematic viscosity, higher oxidation stability, higherflash point and higher heating value. In addition, the other physical and chemical properties assessed in this study fulfil the fuel specifications given in the ASTM D6751 and EN 14214 stan-dards, indicating that theCeiba pentandramethyl ester had great potential for use as an alternative fuel for diesel engines.
4. Conclusions
K-ELM and ANN models are developed in this study to predict the conditions of the alkaline-catalysed transesterifcation process for C.pentandramethyl ester. The reliability of the K-ELM and ANN models was assessed based on the following statistical parameters: R2, RMSE, RPD and MAPE. In general, the values predicted by the K-ELM model show excellent agreement with the experimental values, with higher R2 value and lower RMSE, RPD and MAPE compared with the ANN model. The results prove that the K-ELM model was able to simulate the process conditions of the alkaline-catalysed transesterification in reality with consistent results and reasonable accuracy. In addition, the K-ELM model is more efficient compared to the ANN model since the latter model is more time-intensive to produce the prediction results. Hence, the K-ELM model is chosen to optimize the parameters of the trans-esterification process, specifically the molar ratio of methanol to oil, KOH catalyst weight, reaction temperature, reaction time and agitation speed in order to attain the highest C.pentandramethyl ester yield. This is done by integrating the K-ELM model with ACO. The optimum molar ratio of methanol to oil, KOH catalyst weight, reaction temperature, reaction time and agitation speed which gives the highest methyl ester yield is 10:1, 1 %wt, 60C, 108 min and 1100 rpm, respectively. The methyl ester yield predicted with these process conditions is 99.88%, which is in very good agreement with the experimental methyl ester yield, with a value of 99.46%. This shows that the K-ELM model integrated with ACO is a reliable computing tool to optimize the transesterification process condi-tions in order to maximize the C.pentandramethyl ester yield. Even though C.pentandramethyl ester is the focus of this investigation, it was believed that this tool will be applicable for other types of biodiesels as well, indicating its adaptability and flexibility. Furthermore, the K-ELM model integrated with ACO can help reduce time, costs and raw materials incurred with conventional trial and error experiments, which is greatly beneficial to industries involved in biodiesel production.
Acknowledgement
The authors wish to acknowledge the Ministry of Education, Malaysia, and University of Malaya, Kuala Lumpur, Malaysia, for funding this work under the SATU Joint Research Scheme
(RU021B-2015), PG036-2014B, and Politeknik Negeri Medan, Medan, North Sumatra, Indonesia, under the Research and Community Service Unit (UPPM-2017) and Universiti Tenaga Nasional (Grant No.: 20160101FRGS).
References
[1] Mofijur M, Masjuki HH, Kalam MA, Ashrafur Rahman SM, Mahmudul HM. Energy scenario and biofuel policies and targets in ASEAN countries. Renew Sust Energ Rev 2015;46:51e61.
[2] Dharma S, Ong HC, Masjuki HH, Sebayang AH, Silitonga AS. An overview of engine durability and compatibility using biodieselebioethanolediesel blends
in compression-ignition engines. Energ Convers Manage 2016;128:66e81. [3] Mofijur M, Masjuki HH, Kalam MA, Atabani AE, Shahabuddin M, Palash SM,
et al. Effect of biodiesel from various feedstocks on combustion characteristics, engine durability and materials compatibility: a review. Renew Sust Energ Rev 2013;28:441e55.
[4] Nautiyal P, Subramanian KA, Dastidar MG. Production and characterization of biodiesel from algae. Fuel Proces Technol 2014;120:79e88.
[5] Parthiban KS, Perumalsamy M. Nano sized heterogeneous acid catalyst from
Ceiba pentandrastalks for production of biodiesel using extracted oil from
Ceiba pentandraseeds. RSC Adv 2015;5:11180e7.
[6] Ong LK, Effendi C, Kurniawan A, Lin CX, Zhao XS, Ismadji S. Optimization of catalyst-free production of biodiesel fromCeiba pentandra(kapok) oil with high free fatty acid contents. Energ 2013;57:615e23.
[7] Sivakumar P, Sindhanaiselvan S, Gandhi NN, Devi SS, Renganathan S. Opti-mization and kinetic studies on biodiesel production from underutilized Ceiba Pentandra oil. Fuel 2013;103:693e8.
[8] Betiku E, Okunsolawo SS, Ajala SO, Odedele OS. Performance evaluation of artificial neural network coupled with generic algorithm and response surface methodology in modeling and optimization of biodiesel production process parameters from shea tree (Vitellaria paradoxa) nut butter. Renew Energ 2015;76:408e17.
[9] Prakash Maran J, Priya B. Modeling of ultrasound assisted intensification of biodiesel production from neem (Azadirachta indica) oil using response sur-face methodology and artificial neural network. Fuel 2015;143:262e7. [10] Wu S, Wang Y, Cheng S. Extreme learning machine based wind speed
esti-mation and sensorless control for wind turbine power generation system. Neurocomp 2013;102:163e75.
[11] Wong KI, Wong PK, Cheung CS, Vong CM. Modelling of diesel engine per-formance using advanced machine learning methods under scarce and exponential data set. Appl Soft Comp 2013;13:4428e41.
[12] Wong PK, Wong KI, Vong CM, Cheung CS. Modeling and optimization of biodiesel engine performance using kernel-based extreme learning machine and cuckoo search. Renew Energ 2015;74:640e7.
[13] Zhang L, Yuan J. Fault diagnosis of power Transformers using kernel based extreme learning machine with particle swarm optimization. Appl Math Inf 2015;2:1003e10.
[14] Siswantoro J, Prabuwono AS, Abdullah A, Idrus B. A linear model based on Kalmanfilter for improving neural network classification performance. Expert Sys Appl 2016;49:112e22.
[15] Sarve AN, Varma MN, Sonawane SS. Response surface optimization and arti-ficial neural network modeling of biodiesel production from crude mahua (Madhuca indica) oil under supercritical ethanol conditions using CO2as co-solvent. RSC Adv 2015;5:69702e13.
[16] Guang-Bin H, Hongming Z, Xiaojian D, Rui Z. Extreme learning machine for regression and multiclass classification. Syst Cyber Part B IEEE Trans 2012;42: 513e29.
[17] Huang G-B, Wang D, Lan Y. Extreme learning machines: a survey. Int J Mach Learn Cyber 2011;2:107e22.
[18] Xu Y, Dai Y, Dong Z, Zhang R, Meng K. Extreme learning machine-based predictor for real-time frequency stability assessment of electric power sys-tems. Neural Comp Appl 2013;22:501e8.
[19] Dorigo M, Gambardella LM. Ant colony system: a cooperative learning approach to the traveling salesman problem. Evol Comp 1997;1:53e66. [20] Micheline K, Jiawei H, Jian P. Data mining: concepts and techniques.
Elsev-ier.3; 2006. p. 1e740.
[21] Rocha A, Hauagge DC, Wainer J, Goldenstein S. Automatic fruit and vegetable classification from images. Comp Electro Agri 2010;70:96e104.
[22] Rajendra M, Jena PC, Raheman H. Prediction of optimized pretreatment pro-cess parameters for biodiesel production using ANN and GA. Fuel 2009;88: 868e75.
[23] Garson GD. Interpreting neural-network connection weights. AI Expert 1991;6:46e51.
[24] Lee HV, Yunus R, Juan JC, Taufiq Yap YH. Process optimization design for
jatropha-based biodiesel production using response surface methodology. Fuel Proces Technol 2011;92:2420e8.
[25] Maran JP, Priya B. Comparison of response surface methodology and artificial neural network approach towards efficient ultrasound-assisted biodiesel production from muskmelon oil. Ultrason Sonochem 2015;23:192e200. [26] Guan X, Yao H. Optimization of Viscozyme L-assisted extraction of oat bran
protein using response surface methodology. Food Chem 2008;106:345e51. [27] Sarve A, Sonawane SS, Varma MN. Ultrasound assisted biodiesel production
from sesame (Sesamum indicumL.) oil using barium hydroxide as a hetero-geneous catalyst: comparative assessment of prediction abilities between response surface methodology (RSM) and artificial neural network (ANN). Ultrason Sonochem 2015;26:218e28.
[28] Dorigo M, Maniezzo V, Colorni A. Ant system: optimization by a colony of cooperating agents. Syst Cyber Part B IEEE Trans 1996;26:29e41.
[29] Chandra Mohan B, Baskaran R. A survey: ant colony optimization based recent research and implementation on several engineering domain. Expert Sys Appl 2012;39:4618e27.
[30] Sebayang AH, Masjuki HH, Ong HC, Dharma S, Silitonga AS, Kusumo F, et al. Optimization of bioethanol production from sorghum grains using artificial neural networks integrated with ant colony. Ind Crop Prod 2017;97:146e55. [31] Boussaïd I, Lepagnot J, Siarry P. A survey on optimization metaheuristics. Info
Scie 2013;237:82e117.
[32] Yusaf TF, Yousif BF, Elawad MM. Crude palm oil fuel for diesel-engines: experimental and ANN simulation approaches. Energ 2011;36:4871e8. [33] Badday AS, Abdullah AZ, Lee K-T. Artificial neural network approach for
modeling of ultrasound-assisted transesterification process of crude Jatropha
oil catalyzed by heteropolyacid based catalyst. Chem Eng Process Process Inten 2014;75:31e7.
[34] Pal M, Deswal S. Extreme learning machine based modeling of resilient modulus of subgrade soils. Geotech Geol Eng 2014;32:287e96.
[35] Silitonga AS, Masjuki HH, Mahlia TMI, Ong HC, Chong WT, Boosroh MH. Overview properties of biodiesel diesel blends from edible and non-edible feedstock. Renew Sust Energ Rev 2013;22:346e60.
[36] Ong HC, Silitonga AS, Masjuki HH, Mahlia TMI, Chong WT, Boosroh MH. Production and comparative fuel properties of biodiesel from non-edible oils: jatropha curcas, Sterculia foetida and Ceiba pentandra. Energ Convers Manage 2013;73:245e55.
[37] Atabani AE, Silitonga AS, Badruddin IA, Mahlia TMI, Masjuki HH, Mekhilef S. A comprehensive review on biodiesel as an alternative energy resource and its characteristics. Renew Sust Energ Rev 2012;16:2070e93.
[38] Silitonga AS, Masjuki HH, Ong HC, Yusaf T, Kusumo F, TMI Mahlia. Synthesis and optimization ofHevea brasiliensisandRicinus communisas feedstock for biodiesel production: a comparative study. Ind Crop Prod 2016;85:274e86.