Journal of Physics: Conference Series
PAPER • OPEN ACCESS
Analysis of Student Satisfaction in The Process of
Teaching and Learning Using Importance
Performance Analysis
To cite this article: P Sembiring et al 2017 J. Phys.: Conf. Ser.930 012039
View the article online for updates and enhancements.
Related content
The quality of service in passenger transport terminals
C Oprea, E Roca, M Popa et al.
-Societal perception toward transportation modes based on online (Go-Jek) In Malang City
D M Buamona
-Naive Bayes as opinion classifier to evaluate students satisfaction based on student sentiment in Twitter Social Media
Fahmi Candra Permana, Yusep Rosmansyah and Atje Setiawan Abdullah
1234567890
International Conference on Information and Communication Technology (IconICT) IOP Publishing IOP Conf. Series: Journal of Physics: Conf. Series 930 (2017) 012039 doi :10.1088/1742-6596/930/1/012039
Analysis of Student Satisfaction in The Process of Teaching
and Learning Using Importance Performance Analysis
P Sembiring1, S Sembiring2, G Tarigan3, OD Sembiring
4
1,3,4 Department of MathematicsFaculty of Math and Science
Universitas Sumatera Utara, Medan 20155 Indonesia
2 Department of Computer Science
Faculty of Computer Science and Information Technology Universitas Sumatera Utara, Medan 20155 Indonesia
Abstract. This study aims to determine the level of student satisfaction in the learning process at the University of Sumatra Utara, Indonesia. The sample size of the study consisted 1204 students. Students’ response measured through questionnaires an adapted on a 5-point likert scale and interviews directly to the respondent. SERVQUAL method used to measure the quality of service with five dimensions of service characteristics, namely, physical evidence, reliability, responsiveness, assurance and concern. The result of Importance Performance Analysis reveals that six services attributes must be corrected by policy maker of University Sumatera Utara. The quality of service is still considered low by students.
1.Introduction
Extensive research in Education sector has been carried out studying the factors which can affect the satisfaction of students. Good quality of education provides better learning opportunities. The levels of satisfaction or dissatisfaction strongly affect the student’s success or failure of learning. Nowadays, researcher in higher learning institutions focused on identifying and satisfying the needs and expectations of their students. Such factors include student performance, faculty performance, classroom environment, learning facilities and institution reputation[2]. Education is a very important activity to develop the potential of Human Resources (HR)[1]. Educational activities in higher learning institution, in principle related to the two parties there are lecturers and students. The linkage of both parties will be harmonious if the clear position of each party in a professional manner, ie as a subject with rights and obligations [4].
Kotler and Clarke (1987) define satisfaction as a state felt by a person who has experience performance or an outcome that fulfill his or her expectation. Satisfaction is a function of relative level of expectations and perceives performance. The expectation may go as far as before the students even enter the higher education, suggesting that it is important to the researchers to determine first what the students expect before entering the university [12].
In the process of learning and teaching, the lecturer has a major role in determining the quality of teaching is implemented, is to give knowledge (cognitive), attitudes and values (affective) and skills (psychomotor) to students [12],[10]. In other words, the tasks and roles of the main lecturer is teaching field.
2
1234567890
International Conference on Information and Communication Technology (IconICT) IOP Publishing IOP Conf. Series: Journal of Physics: Conf. Series 930 (2017) 012039 doi :10.1088/1742-6596/930/1/012039
of students to follow the course and master the educational goals they need to accomplish [3],[11]. Higher Learning Institutions in Indonesia including University of Sumatera Utara has been undergoing profound transformation during last decade. There are many higher education institutions have been established are trying to improve the quality of teaching and learning processes through improved various aspects. For instance facility of teaching and learning, a qualified lecturer, and a selection of new student enrollment to a higher standard is also on the higher side. Ministry of Research Technology and Higher Education Republic of Indonesia, has provided various incentives for universities to be able to improve its quality. Such as by providing various financing schemes associated with research and community service, the provision of infrastructure facilities to support the educational process and so forth. So expect students who are taking their studies can also feel comfortable and satisfied with the services and facilities provided.
The paper is organized as follows. In Part II, we discuss research related to this study. While based on the evaluation of this system, we propose an evaluation method using SERQUAL in Part III. Section IV, describes the application of our method to empirical studies and discuss the value of this method. Finally, we provide some discussions and present our conclusions.
2.Literature Review
2.1.Student Satisfaction
There are some studies have been conducted to measure the level of student satisfaction at university. The concern for improving the University’s understanding of the level of student satisfaction within the University System evolved from previous accountability survey results suggesting that graduating seniors and undergraduate alumni were less than satisfied with the quality of undergraduate instruction and non instructional services.
A definition of Satisfaction is a function of relative level of expectations and perceives performance. Satisfaction is a state felt by a person who has experience performance or an outcome that fulfill his or her expectation [5]. The expectation may go as far as before the students even enter the higher education. Palacio, Meneses and Perez [12], suggesting that it is important to the researchers to determine first what the students expect before entering the university. While, Carey, Cambiano and De Vore (2002), believe that satisfaction actually covers issues of students’ perception and experiences during the college years.
2.2.Service Quality in Higher Learning Institution
A definition of quality is relating to how good a service is, and not necessarily how large or extensive. Quality can also be seen as relating to the fitness of a service or product to its intended purpose or use, subject to the expectations of the customer, user or public. The construct of quality as conceptualized in the services literature is based on the perceived quality. Zeithaml, (1987) define the perceived quality is as the consumer’s judgment about an entity’s overall experience or superiority. Similarly, Parasuraman, Zeithaml and Berry (1990) also stated that consumer perceptions of service quality result from comparing expectations prior to receiving the service, and their actual experience of the service.
1234567890
International Conference on Information and Communication Technology (IconICT) IOP Publishing IOP Conf. Series: Journal of Physics: Conf. Series 930 (2017) 012039 doi :10.1088/1742-6596/930/1/012039
purpose of the Student Satisfaction Study was to review these survey results and related literature, to pose and answer additional questions in order to understand more clearly students’ perceptions of the quality of undergraduate instruction and non instructional services, and to make recommendations for needed improvements.
All these studies emphasis on certain factors of education offerings which determine the students’ satisfaction with education and in turn loyalty to the institution. Therefore the objective of this study is to analyze the student satisfaction in the process of teaching and learning at higher education.
3.METHOD
This section describes the types of methods (qualitative, quantitative or mixed-method) along with the details of the methods of data collection and data analysis methods used. This section also describes the perspective that underlies the selection of a particular method.
This study examines the quality of service with five dimensions of services characteristics, namely; physical evidence, reliability, responsiveness, assurance and concern. For this purpose, responses were collected from students of 14 faculties in the University of Sumatera Utara Medan, Indonesia using questionnaire; the sample size consisted of 1204 students from different levels and disciplines.
3.1.Importance Performance Analysis (IPA) Method
Importance Performance Analysis (IPA) or the analysis of interest and performance is an easy application technique to measure the level of interest and the level of performance for the development of effective marketing programs, by analyzing the quadrants to show the relationship between the assessment of the level of interest and the level of performance (Sever, 2015)(Lai, et al. 2015). In this research there are two variables, the level of performance of the University North Sumatra that can give the students (denoted X) and the level of expectations of students (denoted Y). The formula used by are as follows (Martilla, et al. 1997) (Chu, et al. 2012):
𝑇𝑘 = 𝑋𝑖
𝑌𝑖× 100% (1)
Description:
𝑇𝑘 = Level of concordance between performance and expectations
𝑋𝑖= Total score assessment of the level of performance 𝑌𝑖 = Total score assessment of consumer interests
In the analysis of Importance Performance Analysis mapping into four quadrants for all the variables that affect the quality of service, (Oh, 2001, Luo, et al. 2015) the horizontal axis (X) will be filled by the score level execution or performance, while the vertical axis (Y) will be filled by a score of importance. In simplifying the formula, then for each of the factors that affect the service satisfaction:
X = The average score of the level of performance
Y = The average score of the level of interest n = Number of respondents
Cartesian diagram is a structure which is divided into four sections bordered by two lines that intersect
perpendicularly at the points (X , Y) which X is the average of the average score of the level of
4
1234567890
International Conference on Information and Communication Technology (IconICT) IOP Publishing IOP Conf. Series: Journal of Physics: Conf. Series 930 (2017) 012039 doi :10.1088/1742-6596/930/1/012039
K
X = Average of the average level of performance X= Score average level of performance
Y= Average of the average rate of interest
Y= Score average rate of interest
K = The number of attributes that affect service
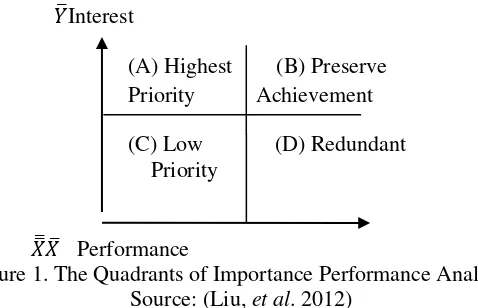
Importance Performance Analysis division can be seen in the following figure 1:
𝑌̅Interest
Figure 1. The Quadrants of Importance Performance Analysis Source: (Liu, et al. 2012)
Description:
a. Quadrant I (highest priority) indicates factors or attributes that are deemed to affect customer satisfaction, including elements of the services that are considered very important, but the management has not done according to customer wishes. So disappointing or dissatisfied.
b. Quadrant II (preserves achievements) shows the basic service elements that have been successfully implemented enterprise, for it shall be retained. Considered very important and very satisfying.
c. Quadrant III (low priority) indicates several factors that are less importance for the customer, implementation by companies mediocre. Considered to be less important and less satisfying. d. Quadrant IV (redundant) shows the factors that affect customer is less important, but
implementation is excessive. Considered less important but very satisfying.
4.Results and Discussion
The main objective of this study is to find out the relationship between students’ satisfaction and various education facilities and services in the process of teaching and learning at the University of Sumatera Utara.
Reliability of the data was checked using Cronbach Alpha which provides a value of 0.75 is more than the acceptable value of 0.70 (Nunnally [35]; Hair et al., [24]; Zikmund [53]) and a value ranges between 0 and 1 and the value close to 1 provides more reliability (Nunnally and Bernstein [36]). As reliability of the data plays a significant role in analyzing the results.
4.1.Characteristics of Respondents
1234567890
International Conference on Information and Communication Technology (IconICT) IOP Publishing IOP Conf. Series: Journal of Physics: Conf. Series 930 (2017) 012039 doi :10.1088/1742-6596/930/1/012039
students being 21 years old (34%). Most of the respondents are in the fifth semester of their study (65%), followed by seventh semester and above (35%).
The characteristics of respondents from 14 faculties at University of Sumatera Utara based on gender and semesters as shown on figure 2:
Figure 2.Characteristics of Respondents based on gender and semester from 14 faculties at University of North Sumatra
4.2.The Level of students Satisfaction
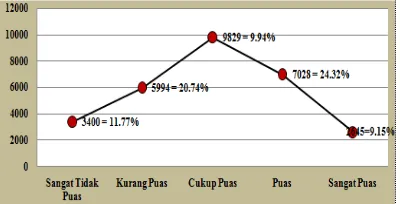
Based on respondents’ answers, there is 11.77% respondents answer very unsatisfied, 20.74% students are lesser satisfied, 24.32% students state they are Satisfied and 9.15% of students answers Very Satisfied.
Figure 3. Distribution levels of students satisfaction at University on Sumatera Utara.
4.3.The Level of Importance
Importance Performance Analysis (IPA) method was used to measure the relationship between students' perceptions and priorities to improve the quality of products / services which is also known as a quadrant analysis. Quadrant analysis is divided into four quadrants covering the first quadrant main priority, keep achievement quadrant II, while Quadrant III and Quadrant IV low priority and redundant.
6
1234567890
International Conference on Information and Communication Technology (IconICT) IOP Publishing IOP Conf. Series: Journal of Physics: Conf. Series 930 (2017) 012039 doi :10.1088/1742-6596/930/1/012039
Figure 4: Quadrant Analysis Satisfaction vs Importance
1. Quadrant I is the low performance of high interest, service attributes that should be improved are: a. Convenience lecture rooms (chairs, ceiling fan, air conditioning, cleanliness, etc.).
b. Availability region internet connection (WiFi) that support learning activities. c. Completeness of books, journals and literature lectures at the library.
d. Hygiene and clean water in the toilet / bathroom.
e. Availability of the department to respond and respond to student complaints. f. The teaching staff serve the maintenance of files quickly and professionally.
2. Quadrant II is a high performance high interest, the attributes of services that must be maintained are:
a. Lecturer / Assistant lab deliver learning material clearly. b. Lecturer taught according to a set schedule.
c. exam questions in accordance with the material provided. d. The system of values is done objectively.
e. The ability of the faculty in the lecturer answered questions clearly. f. The security environment and their campus security officers.
g. Ease in obtaining information about the educational system (curriculum, class schedules, scholarships, etc.).
3. Quadrant III is the low performance low importance, service attributes are not so expected is: a. The condition of the equipment in the lab practicum.
b. Completeness equipment laboratory experiments.
c. Clarity their administrative costs and the number of charges in the management of files. d. The lecturer substitute when absent lecturers teach.
e. Discussion re-exam by professors and lab assistants.
4. Quadrant IV is a high performance low importance, service attributes that are less urgent and less expected are:
a. Availability of adequate parking. b. Ease of finding books in the library.
c. Supervisory exams begin and end with the exam on time. d. The system of payment of tuition
e. Lecturers provide motivation for students while teaching in the classroom. f. The existence of student organizations on campus to support activities
1234567890
International Conference on Information and Communication Technology (IconICT) IOP Publishing IOP Conf. Series: Journal of Physics: Conf. Series 930 (2017) 012039 doi :10.1088/1742-6596/930/1/012039
relationship between service quality dimensions (physical evidence, reliability, responsiveness, assurance and concern) and student’s satisfaction.
This study indicates five-service quality (physical evidence, reliability, responsiveness, assurance and concern) that contributes most to satisfaction and has strong relationship with student’s satisfaction. The results are consistent and also agree with Smith and Ennew (2001), Ham and Hayduk (2003) and Bigne et al. (2003) that found there is a positive relationship between service quality and student
Since all the variables are significantly and positively related to students’ satisfaction it is concluded that teachers expertise, courses offered, learning environment and classroom facilities enhance the students satisfaction in higher education. Thus, it confirmed by other literature try to suggest here, which is by improving the service quality, it can be improve the students’ satisfaction.
According to results teacher expertise and learning facilities’ (class room comfort, internet connection, completeness of text books, journal, literature lectures in the library and hygiene and clean water in the toilet) are most influential factor on the student satisfaction. This means that teachers’ expertise, courses offered and learning environment do a good job of enhancing students’ satisfaction in higher education, especially at University of Sumatera Utara.
In the light of the research findings, there are some suggestions and recommendation for in the effort to improve and hence the level of student’s satisfaction at University of Sumatera Utara. Institutions should pay special attention to induct, train and retain qualified and expert teachers for promoting the quality education, provide the conducive and favorable learning environment in the universities, to upgrade class room facilities’, to establish the healthy and interactive communication between students and teachers and administrator.
REFERENCES
[1] Delahaye, B.. Student Resource Guide Human Resource Development Managing Learning and Knowledge Capital. Tilde University Press.2015. Prahran VIC 3181 Australia
[2] DeShields Jr., O. W., Kara, A. and Kaynak, E. 2005, “Determinants of business student satisfaction and retention in higher education: applying Herzberg’s two factor theory”,
International Journal of Educational Management, 19(2), 28-139.
[3] Johnson, K.E. Golombek, P.R. Mindful L2 Teacher Education: A Sociocultural Perspective on Cultivating Teachers' Professional Development. Routledge. New York. 2016.
[4] Karatzoglou, B.. An in-depth literature review of the evolving roles and contributions of universities to Education for Sustainable Development. Journal of Cleaner Production : Learning for Sustainable Development In Regional Networks 49 : 44-53,2012
[5] Kotler, P., & Clarke, R. N. Marketing for health care organizations. Englewood Cliffs, NJ: Prentice-Hall,1987.
[6] Lai, I.K.W. Hitchcock, M.. Importance–performance analysis in tourism: A framework for researchers. Tourism Management. 48 : 242-267. ISSN 0261-5177,2015
[7] Liu, H. C., Mai, Y. T., Jheng, Y. D., Liang, W. L., Chen, S. M. & Lee, S. J. A novel discrimination index of Importance-Performance Analysis model," 2011 International Conference on Machine Learning and Cybernetics. Guilin. 2011. pp. 938-942. 2011
8
1234567890
International Conference on Information and Communication Technology (IconICT) IOP Publishing IOP Conf. Series: Journal of Physics: Conf. Series 930 (2017) 012039 doi :10.1088/1742-6596/930/1/012039
[9] Martilla, J.A. & James, J.C.. Importance-Performance Analysis. The Journal of Marketing. vol. 41. no. 2: 77–79,1977.
[10] Nunnally, J. C., “Psychometric Theory,” 2nd ed., McGraw-Hill, New York, NY,. 1978
[11] Oh, H. Revisiting importance–performance analysis. Tourism Management. vol 22. no. 6: 617-627.. 2001
[12] Palacio, A. B., Meneses, G. D. & Perez, P. J. PThe configuration of the university image and its relationship with the satisfaction of students. . 2002. Journal of Educational Administration, 40(5), 486-505.
[13] Race, P.. The Lecturer's Toolkit: A Practical Guide to Assessment, Learning and Teaching Fourth Edition. Routledge. New York,2015
[14] Roberts, J. Language Teacher Education. Routledge. New York, 2016
[15] Scrivener, J. 2011. Learning Teaching: The Essential Guide to English Language Teaching. MACMILLAN Publishers Limited. UK.
[16] Sever, I. Importance-performance analysis: A valid management tool?. Tourism Management vol. 48 : 43-53, 2015.
[17] Smith, R. & Ennew, C. Service quality and its impact on word of mouth communication in higher education. Online: http://www.unim. nottingham.ac.uk /dbm/papers/ 2001
[18] Solomon, M. R. (1996). Consumer behavior. Englewood Cliffs, NJ: Prentice-Ha