SUBJECTIVE WELL-BEING EVALUATION OF PUBLIC TRANSPORT
USERS DURING TRAVEL AND ACTIVITIES IN BANDAR LAMPUNG
CITY USING DAY RECONSTRUCTION METHOD (DRM)
Winny Novalina1, Muhamad Rizki2, Ofyar Z Tamin3
1Civil Engineering Department, Institut Teknologi Sumatera (ITERA), Lampung, Indonesia 2Directorate of Transportation, Indonesian Ministry of National Development Planning (BAPPENAS),
Jakarta, Indonesia
3Civil Engineering Department, Institut Teknologi Bandung (ITB), Bandung, Indonesia
Abstract:
The question regarding daily travel and activities implication to individuals’ well-being was heavily debated from past decades. This research is motivated by relationship between travel, activity, and wellbeing, specifically for public transport users. The modification of day reconstruction method applied in data collection to capture the changes of personal preference during travel and activities. The one day travel activities survey questionnaire distributed to public transport user in Bandar Lampung. Furthermore, 420 samples distribute based on sampling criteria which the result of survey evaluated based on completeness and variance. Key findings of this study are in line with the past study of wellbeing yet found some crucial findings. It is found that subjective well-being preference is changes during period when moving from activity to another activity. Furthermore, this papers also found that majority of individuals’ have negative experience on their daily travel.
Keywords: subjective well-being, public transport users, travel
1. Introduction
Individuals’ activity engagement strongly depends on the transport system, as they rely on the amount
of travel time needed to reach activity locations through the transport system. Furthermore, the transport
system is often identified as one indicator of people’s quality of life [1]. Efficient transport service contributed to the stability of individuals’ decision to engage in their desired activities, and in the same
time, positively influence their experience of travel and activities [2,3]. In contrast, when transport systems offer inefficient quality of service marked by unreliable and inefficient travel times, people are not able to reach their desired destinations and participate in activities in a satisfying and productive way [4].
Individuals’ consequently evaluate their experience in travel and activities, which influences their overall
well-being [5,6]. There are substantial number of literature that define the concept of well-being. Despite various concept of well-being has been heavily debated [7,8,9]. In this study we define well-being as subjective well-being [10] i.e. individuals’ cognitive assessment and affective experience of their life in general.
The implications of travel on well-being can actualized in two ways. First, the travel experience may
influence individuals’ mental and physical aspects and thereby their overall well-being. Negative experiences during travel such as unreliable travel time and poor level of service affect individuals’ moods negatively. In terms of physical aspects, reliable and availability of various transport infrastructure
influence individuals’ health positively [11,12]. Second, reliable and acceptable travel times will give individuals’ the opportunity to participate in their desired activities to fulfil their social and economic needs, leading to higher levels of well-being [13]. In contrast, if travel consumes more time, there will be less time for activities, and sooner or later some of the activities must be foregone [14].
Western contexts in that standards of living are lower for parts of the population. Therefore, public transport development as a promising solution to the urban complex problems needs to be seen in the
view of its implication to individuals’ well-being.
Furthermore, this research is motivated by relationship between travel, activity and well-being, specifically for public transport users. Encouraging public transport use policy such as increasing public transport services is heavily depends on how individuals react to them where individuals’ preference on them is the fundamental point. Therefore, the aim of this research is to explore on how public transport
users’ preference regarding their travel and activities and how their well-being reflect in their travel and activities preference.
2. Methodology
2.1 Subjective Well-Being
Increasing quality of life fundamentally always be the target of the infrastructure development, public and social policy, and social development [15]. There are a broad of literature that defining well-being which the context of happiness and quality of life are strongly relate to it. However, well-being subject has a long history in philosophy areas and originally developed by critical thinker such as Aristotle, Bentham, etc.
Under the psychology area, well-being associated with individualized and subjectively experienced way of being. Therefore, well-being context strongly related to behaviour and objective circumstances (e.g. objective health, social and physical environment). In extend to that concept, a study identifies transportation-focused approach to explore relation between transportation and well-being that consist
of four aspects of individuals’ well-being:
1. Transportation related to individuals’ physical well-being is refers to one’s fitness, energy and the absence of illness or physical dysfunction;
2. Transportation related to individuals’ mental well-being is refers to one’s psychological health, happiness, mood and self-perception;
3. Transportation related to individuals’ social well-being is refers to the quality of one’s social support network, family or personal relationships and level of community involvement;
4. Transportation related to individuals’ economic well-being is reflects to one’s financial resources and access to employment as well as opportunities to self-development to purse more of financial benefit.
For example, the act of walking for transport, bicycling, or walking to transit as form of physical wellbeing such as health and social interaction with the environment which has contribute also into mental well-being such as minimize stress and negative mood [16,17]. From perspective of mental well-well-being, travel congestion and lower transport service of travel will contribute to high mental stress and reducing
individuals’ happiness [18].
In term of social aspects, a higher risk of social exclusion among those who conducted fewer trips or activities [19]. As they focus only to mandatory activities and have no time to do activities that contribute to social well-being. Declining of mobility will decrease social integration as well as community activity.
On the other hand, transportation can negatively impact to individuals’ physical health as increasing
pollution and other environment impact due to inefficient transport infrastructure came along with rapid growing of private vehicle.
2.2 Day Reconstruction Method (DRM)
There is growing needs to capture the individuals’ preference and behaviour from past decades. Which
lead to substantial needs of strategic and efficient method of data collection. The Day Reconstruction
Method (DRM) is designed to collect data describing individuals’ experiences during activities and travel
in a day period [20]. The mechanism of the data collection is to reconstruct the following day of the respondent and asking activity and travel participation from time to time with also their preference in every activity and travel.
Sampling Method (ESM) and for some extend reduce memory bias in recall of the feelings [21]. The
DRM also found not disrupt the activities and travel and present comprehensive time to time individuals’
feelings.
The main feature of DRM is reconstruction of the previous day of individuals’ by completing a one-day travel and activities diary. The diary consists of four packets of question. The first and fourth packet
describes general question about individuals’ life, such as general life satisfaction of life in home and
work, individuals’ moods, working and travel characteristics and social-demographic characteristics.
Second packet presents structural question about time during a day and individuals’ preference about
them. Furthermore, the third packets heavily describe individuals’ preference for every single activity which mainly completing the second packet.
Although there are many debates in questioning how significant the DRM reducing memory bias and burdensome of the respondent, DRM found to be substantial tools to capture individuals’ experience during a time. For instance, DRM prevail to reveal interesting patterns of well-being rather than conventional ESM. Unemployed persons most likely have lower life satisfaction than employed persons [22]. It is interesting to note of that their net affect which assessed by the DRM was slightly higher than
that of employed individuals’ when feelings were weighted by the duration of activities. DRM which the
realization of moods scores with shows daily diurnal rhythms [23].
2.3 Data Collection
The data of individuals’ preference collected by adapt the DRM concept. Modification of DRM used to
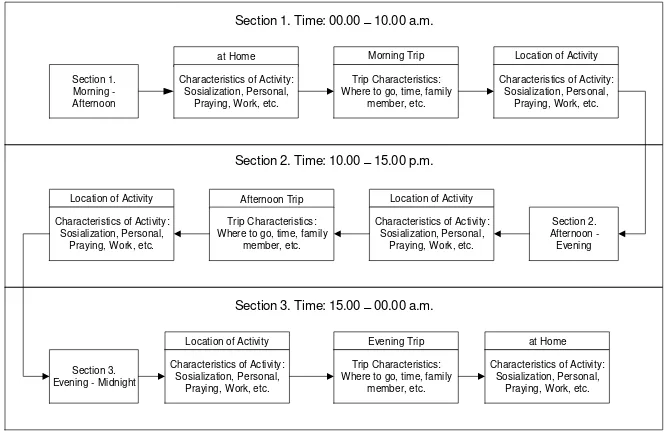
tailor the psychological preference of Indonesian people but not to change the meaning of DRM. The first draft of questionnaire was tested in preliminary survey of 20 respondents. After evaluation of the questionnaire which mainly in DRM question aspect, the final questionnaire established. The final questionnaire consists of four parts i.e. social demographic part, general travel characteristics part, the DRM part and overall evaluation of daily activity and travel part.
Figure 1 Time Diagram of DRM in the Questionnaire (in English)
The number of respondents obtained based on determining sample size [24] and total number students of Bandar Lampung population as much as 220.698. This data was obtained from the Statistics of Lampung Province and the Education Service of Lampung Province [25]. Then the sample size was determined as much as 400 respondents plus 10 respondents for maintain margin of error (α = 5%). The survey was conducted between 6 and 12 of August, 2017. Respondents were collected by being personally approached in the area around the education center. After reviewing the data completeness and consistency, only 402 sets can be used for further analysis.
3. Result
3.1 Data Description
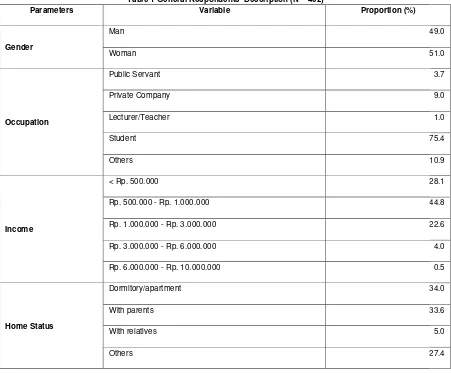
From the survey, it was found that 51% of respondent was female. The distributions of respondents’
occupation are public servant (3.7%), private company (23.4%), lecturer/teacher (1.0%), students (75.4%) and others (10.9%). In terms of income, majority of respondent have income less than 3 million rupiah with 95% which almost 45% respondents have income Rp. 500.000 – Rp. 1.000.000. In terms of home status, 34.0% lived in the dormitory/apartment and 33.6% lived with their parents.
Table 1 General Respondents’ Description (N = 402)
Parameters Variable Proportion (%)
Gender
Man 49.0
Woman 51.0
Occupation
Public Servant 3.7
Private Company 9.0
Lecturer/Teacher 1.0
Student 75.4
Others 10.9
Income
< Rp. 500.000 28.1
Rp. 500.000 - Rp. 1.000.000 44.8
Rp. 1.000.000 - Rp. 3.000.000 22.6
Rp. 3.000.000 - Rp. 6.000.000 4.0
Rp. 6.000.000 - Rp. 10.000.000 0.5
Home Status
Dormitory/apartment 34.0
With parents 33.6
With relatives 5.0
Others 27.4
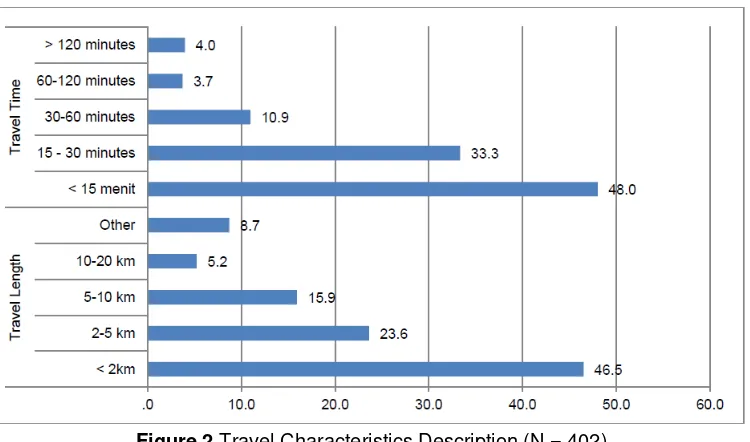
Figure 2 shows the respondents’ travel characteristics description i.e. travel length and travel time.
Majority of respondent have short distance trip (less than 2 km) with 46.5%. The travel time description also shows same pattern which majority in less than 15 minutes travel time. This description most likely related to home status of the respondent which is in the dormitory or apartment.
Figure 2 Travel Characteristics Description (N = 402)
3.2 Individuals’ Preference Fluctuations
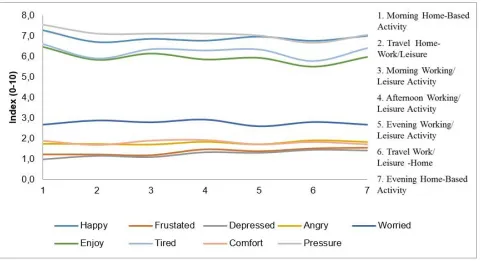
The subjective well-being (SWB) captured in the data collection which consists of nine (9) feelings’ characteristics, later define as positive and negative feelings. Positive feelings distributed in three (3) aspects which are happy, enjoy and comfort. While negative feelings captured in six (6) various aspects which are frustrated, depressed, angry, worried, tired and pressure.
The analysis divided in three (3) different fluctuations. First is analysis of the aggregate data of SWB. Figure 3 shows the fluctuations of SWB from the aggregate data. It shows that happiness index (happy) is varies among time. Happiness index show high number in the morning but later on in travel activities decrease slightly about 0.3 indexes. It is also noticeable that the index in the morning and the evening tend to similar. It might be could be related to feelings in finishing the day. In terms of negative feelings, the fluctuations of depressed feelings moving similar with happiness feeling.
Furthermore, in extend to analysis of the travel experiences, found that there are slight decrease of happiness and enjoyment feelings during the travel activity (2 and 6). This finding could be related to the public transport services which still lower from the standard. However, the negative feelings such as worried, frustrated, tired and depressed tend to stable during day.
Figure 3 Aggregate Data SWB Fluctuations (N=402)
In extend to that analysis, the SWB fluctuations analysis also divided based on weekdays and
weekends. The weekdays’ analysis (Figure 4) shows some distinguished characteristics. Similar with the findings above, the positive feelings (i.e. happiness and enjoyment) are decrease during travel time in the morning and the evening. While the negative feelings (i.e. worried, frustrated, tired and depressed) tend to stable from one activity to another.
Figure 4 Weekdays Data SWB Fluctuations (N = 283)
Furthermore, the weekends’ fluctuations (Figure 5) show some similarity. Negative feelings such as tired
and pressure are decrease during travel time. While happiness index increased during the activities and decrease during travel time. The similarity findings most probably related to occupation sample majority which is students. Students tend to have similar activity in weekends and weekdays with extending their study schedule in the weekends.
Figure 5 Weekends Data SWB Fluctuations (N = 119)
Moreover, the overall activity and travel satisfaction also been investigating to see the pattern. From Figure 6 could be seen that overall preference for the travel, activities and overall is satisfied. More than 80% respondent satisfied with the activity and their overall activity and travel. However, found that the satisfaction of travel is smaller than activity with percentage of dissatisfaction reached almost 23%. This finding supported the findings above which related to morning and travel satisfaction.
Figure 6 Overall Satisfaction Characteristics
Table 2 analyse the distribution of satisfaction based on gender and mode choice by the chi square test. Found that the satisfaction is not varies based on gender, but it is varies based on mode choice. This finding probably related to service differences among type of public transport in Bandar Lampung. Public
11.7
71.1 4.7
1 2.5
10.2
66.9 21.6
1.2
14.2
70.4 13.9
1.5
.0 10.0 20.0 30.0 40.0 50.0 60.0 70.0 80.0 Very satisfied
transport in Bandar Lampung consists of large bus and paratransit which have different quality of services.
Table 2 Satisfaction Based on Gender and Mode Choice
Parameters Ge nder Mode Choice
Chi Sig. Chi Sig.
Overall Satisfaction 2.113 0.549 23.6 0.023
Travel Satisfaction 0.202 0.977 22.7 0.030
Activity Satisfaction 4.86 0.977 25.89 0.011
3.3 Travel Liking Description
Travel liking is related to the concept of travel not purely seen as disutility, but also give positive utility
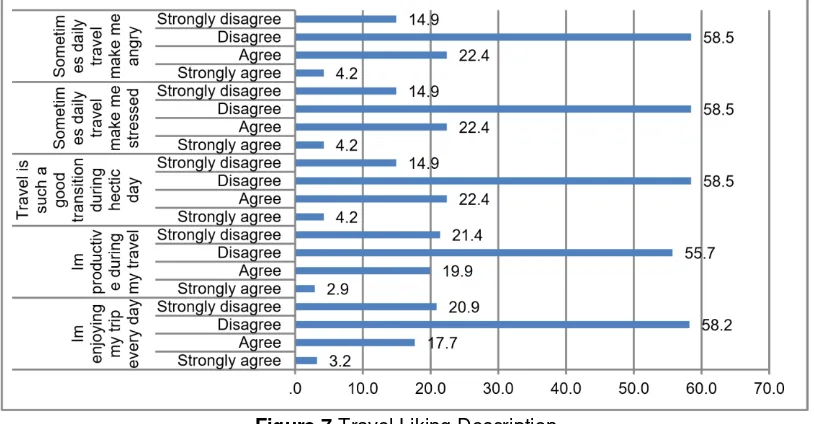
to individuals’ [26]. Activity during travel for some extend gave positive opportunity that maximize by individuals’ to push their activity needs. The travel liking concept was asked to see the pattern of respondent of this concept. The questions consist of anger and travel, stress and travel, the productivity of travel, good transition of travel and enjoyment of travel.
Figure 7 shows some unique findings. Majority of the responden think that travel time give them different impression than Mokhtarian and Salomon (2001) concept. More than 70% of the respondent is disagree that travel is good transition in the hectic day and do not have a productive time during their travel time. However, the majority of respondent do not think that travel give them some negative feeling such as anger and stress.
Figure 7 Travel Liking Description
Furthermore, the Table 3 analyse the distribution of travel liking based on gender and mode choice. The chi square test found that the travel liking is not varies based on gender. In contrast, the findings is varies based on mode choice except the productive parameters. This finding supports the findings below and adding one new interesting fact. The similar distribution of negative preference in productivity among mode choice most probably related to the conditions of existing public transport in Bandar Lampung. This finding indicates that the public transport service in Bandar Lampung still not accommodate the
needs to fulfil individuals’ productivity during travel time.
Table 3 Travel Liking Based on Gender and Mode Choice
Parameters Gender Mode Choice
Chi Sig. Chi Sig.
I’m enjoying my trip every day 1.665 0.645 27.218 0.007
I’m productive during my travel 2.598 0.627 13.967 0.601
Travel is such a good transition during hectic day 2.483 0.478 23.763 0.022
Sometimes daily travel made me stressed 0.683 0.877 21.787 0.040
Sometimes daily travel made me angry 0.509 0.917 27.039 0.008
4. Conclusion
The main purpose of daily travel is to enabling individuals’ to maximize their economic and social needs
through activity participation. Therefore, transportation infrastructure plays substantial role in
accommodate individuals’ activity needs. This paper investigates the reflection of individuals’ well-being
in their daily travel and activities participation. Moreover, we focus in Bandar Lampung’s public transport
user to analyse and see the pattern distribution along one day period.
This study adapted the day reconstruction method [20] with the concept of repeating the previous daily travel and activities. Nine (9) feelings define as positive and negative feelings of well-being are explored in this study. Positive feelings consist in three (3) aspects which are happy, enjoy and comfort. While negative feelings captured in six (6) various aspects which are frustrated, depressed, angry, worried, tired and pressure.
Evaluation of individuals’ experience of travel and activities strongly connected one and another. One
of main evident from the result is individuals’ evaluation of subjective well-being is changes during period as similar findings showed by past study [23]. This finding is predicted because of the relationship between activities and travel. As an illustration, the quality of life in the morning with certain activities will have implications for the quality of life in the afternoon. The changes are highly dynamic depending on the internal and external aspects of the individual. However, complexity of individuals’ decisión process generate varies subjective well-being preferences among individuals’. Thus, the different subjective well-being preference expected subject of different social-demographic, spatial and multidimensional characteristics.
Furthermore, daily travel depends on activities. Therefore, the pattern of well-being between working days and non-working days will be different. However, this study showed the pattern is not slightly different. One potential reason is majority of the respondents is students that have similar pattern in weekdays and weekends due to task and homework. As social demographic characteristics such as
occupation influence to individuals’ activities and leading to different subjective well-being preferences.
In additional, this research also explored the satisfaction of travel and travel liking characteristics [26]. The result indicates that individuals tend to not productive at their travel time and most of them have negative preference of travel. This findings could be related to quality of public transport in Bandar Lampung which have low level of service. Poor public transport infrastructure leads to declining opportunity to be productive.
The travel preferences can be the basis for the development of policies, both for the development of public transport and the control of private transport users. On-going research must accomodate and explore more further the well-being as a subject of planning policy. As the substantial improvement of public transport will lead to greater well-being if the policy planner formulates the right improvement strategy.
5. Acknowledgment
The author wishes to thank the civitas academia of Institut Teknologi Sumatera (ITERA). This research
is fully funded by ITERA’s research grant.
6. References
[1] Hagerstrand, T., “Impact of Transport on the Quality of Life” This paper was presented at the 5th International Symposium on Theory and Practice in Transport Economics, Transport in the
19801990 Decade, Athens, October, 1974.
[2] Abou-Zeid, M., “Measuring and Modeling Activity and Travel Well-Being”, PhD Thesis, Massachusetts Institute of Technology, Cambridge, MA, USA, 2009.
[4] Archer, M., Paleti, R., Konduri, K., Pendyala, R., Bhat, C., “Modeling the Connection between Activity-Travel Patterns and Subjective Well-Being”, Transportation Research Record: Journal of the Transportation Research Board, (2382), 2013, pp. 102-111.
[5] Bergstad, C., A. Gamble, T. Gärling, O. Hagman, M. Polk, D. Ettema, M. Friman, and L. Olsson,
“Subjective Well-Being Related to Satisfaction with Daily Travel”, Transportation 38(1), 2011, pp. 1–15, doi:10.1007/s11116-010-9283-z.
[6] Cao, J., Ettema, D., “Satisfaction with Travel and Residential Self-Selection: How Do Preferences Moderate the Impact of the Hiawatha Light Rail Transit Line?”, Journal of Transport and Land Use, 7(3), 2014, pp. 93-108.
[7] Ryff, C. D., “Happiness is Everything, or is it? Explorations on the Meaning of Psychological Well-Being”, Journal of Personality and Social Psychology, 57(6), 1069, 1989.
[8] Diener, E., Suh, E. M., Lucas, R. E., Smith, H. L., “Subjective Well-Being: Three Decades of
Process”, Psychological Bulletin, 125(2), 1999, pp. 276–302.
[9] Ryff, C.D., Singer, B.H., “Know Thyself and Become What You Are: A Eudaimonic Approach to
Psychological Well-Being”, Journal of Happiness Studies 9(1), 2008, pp. 13–39, doi:10.1007/s10902006-9019-0.
[10] Diener, E., “Subjective Well-Being”, Psychological Bulletin, 95, 1984, pp. 542-575.
[11] Ettema, D. and Smajic, I., “Walking, Places, and Well-Being”, The Geographical Journal, 181(2), 2015, pp. 102-109.
[12] Lee, R. J. and Sener, I. N., “Transportation Planning and Quality of Life: Where Do They
Intersect?”, Transport Policy, 48, 2016, pp. 146-155.
[13] Stanley, J., “Social Exclusion and Travel”, Handbook of Sustainable Travel, Springer Netherlands, 2014, pp. 165-184.
[14] Kitamura, R., Fujii, S., Pas, E., “Time-Use Data, Analysis and Modeling: Toward the Next
Generation of Transportation Planning Methodologies”, Transport Policy 4(4), 1997, pp. 225 -235. [15] De Vos, J., Schwanen, T., Van Acker, V., Witlox, F., “Travel and Subjective Well
-Being: a Focus on Findings, Methods and Future Research Needs”, Transport Reviews, 33(4),
2013, pp. 421-442. [16] Ettema, D., Gärling, T., Eriksson, L., Friman, M., Olsson, L. E., Fujii, S.,
“Satisfaction with Travel and Subjective Well-Being: Development and Tests of a Measurement
Tool”, Transportation Research Part F, 14, 2011, pp. 167-175.
[17] Andrews, G. J., Hall E., Evans, B., Colls, R., “Moving Beyond Walkability: on the Potential of
Health Geography”, Social Science and Medicine, 75 1925, 2012, pp. 32.
[18] Abou-Zeid, M., Ben-Akiva, M., “Well-Being and Activity-Based Models”, Transportation, 39(6), 2012, pp. 1189-1207.
[19] Stanley, J. K., Hensher, D. A., Stanley, J. R., Vella-Brodrick, D., “Mobility, Social Exclusion and Well-Being: Exploring the Links”, Transport Research Part A Policy Practice. 45, 2011, pp. 789–801, http://dx.doi.org/10.1016/j.tra.2011.06.007.
[20] Kahneman, D., Krueger, A. B., Schkade, D. A., Schwarz, N., Stone, A. A., “a Survey Method for
Characterizing Daily Life Experience: The Day Reconstruction Method”, Science, 306(5702), 2004, pp.
1776-1780.
[21] Diener, E., Tay, L., “Review of the Day Reconstruction Method (DRM)”, Social Indicators Research, 116(1), 2014, pp. 255-267.
[22] Knabe, Andreas, Steffen Rätzel, Ronnie Schöb, and Joachim Weimann, “Dissatisfied with Life but Having a Good Day: Time-Use and Well-Being of the Unemployed”, Economic Journal, 120(547), 2010, pp. 867-889.
[23] Stone, A. A., Schwartz, J. E., Schkade, D., Schwarz, N., Krueger, A., Kahneman, D., “a Population Approach to the Study of Emotion: Diurnal Rhythms of a Working Day Examined with the
Day Reconstruction Method”, Emotion, 6(1), 2006, pp. 139.
[24] Israel, G. D., “Determining Sample Size”, PEOD6, Agricultural Education and Communication Department, Florida Cooperative Extension Service, Institute of Food and Agricultural Sciences, University of Florida, Gainesville, FL, 2012.
[25] Statistics of Lampung Province, “Lampung Province in Figure 2016”, Biro Statistics of Lampung Press, Lampung, 2016.
[26] Mokhtarian, P. L., Salomon, I., “How Derived is the Demand for Travel? Some Conceptual and
Measurement Considerations”, Transportation Research part A: Policy and Practice, 35(8), 2001, pp.