P-ISSN.2503-0817, E-ISSN.2503-0825
CrossMark
Abstract
Objective: This study aims to collect data on the mandibular cortical thickness of the woman inhabitants in the Toraja tribe.
Material and Methods: The subjects of this study that underwent panoramic radiography were vulnerable women aged 45-90 years from the Toraja tribe. The technique used to assess cortical thickness was the measurement Mental Index (MI) by panoramic radiography.
Results:MI detected a reduction in bone mass density in elderly women using panoramic radiography.
Conclusion: Osteoporosis can be detected by measuring the MI using panoramic radiographs. This has been developed to detect osteoporosis.
Keywords: Mental Index, Mandibular cortex
Cite this Article: Rieuwpassa IE, Asmawati. 2018. Thickness cortex mandible on Toraja viewed from women’s groups radiographic panoramic. Journal of Dentomaxillofacial Science 3(1): 41-45. DOI: 10.15562/jdmfs.v3i1.697
Thickness cortex mandible on Toraja viewed from
women’s groups radiographic panoramic
Irene E. Rieuwpassa*, Asmawati
Introduction
Along with increasing the quality of health services in developed and developing countries, the average life expectancy is also increasing. This means that there will be an increase in the elderly popula-tion. Diseases that are commonly found in elderly patients are metabolic diseases and chronic degen-erative diseases. Osteoporosis becomes one of the disorders in the elderly that can degrade the quality of life.1
Osteoporosis is a disease characterized by a reduction in bone mass accompanied by dete-rioration of bone microarchitecture resulting in decreased quality of bone tissue. This situation is considered a high risk factor because the bones will become brittle and crack or even break. Over the past few decades, fractures due to osteoporosis have been reported to increase resulting in the loss of independence and mobility as well as substantial costs required for maintenance.2,3
The incidence of osteoporosis increases with the increasing aging population. In 2005, there were 18 million elderly in Indonesia and this number will increase to 33 million by 2020 with a life expec-tancy of 70 years.
Osteoporosis is more common in women than men. This is due to the influence of estrogen levels that begin to decline from the age of 35 years while in the male hormone testosterone does not fall until the age of 65 years. According to world statistics, 1 in 3 women are prone to osteoporosis.
Currently the gold standard used to diagnose osteoporosis is bone mineral density (BMD) because it is the best predictor of individuals
who may be suffering from bone fractures. BMD is usually measured using dual energy x-ray absorptiometry (DXA). DXA is considered as one of the tools that can detect osteoporosis most accurately at the moment. DXA for osteoporosis examination has a sensitivity of 90% and accuracy of 90-99%. This examination uses special tools to measure the bone density (g/cm2) in the peripheral axial skeleton. Unfortunately, in Indonesia, DXA devices are still relatively limited in hospitals in big cities and cannot easily perform diagnostics using the DXA device.4
Osteoporosis can also be detected by performing a panoramic radiograph technique. A panoramic radiographic picture is frequently used by dentists for their representation of oral and maxillofacial complex structure that helps in obtaining a diagnosis to treatment plan. Panoramic radiographs have been used widely to obtain a comprehensive picture of the structure of the maxillofacial complex.5
The aim of this study is to gather data obtained from mandibular cortical thickness of the inhabitants of the Toraja, detect the presence of osteoporosis in elderly women using panoramic radiographs and determining the prevalence of osteoporosis in the elderly population in the Toraja using the panoramic radiographic results.
Material and Methods
Bone mass measurement is a measurement of BMD using special X-rays, CT scans, or ultrasounds. From the results of these measurements, the strength of bone can be estimated. This measurement is Department of Oral Biology,
Faculty of Dentistry, Hasanuddin University, Makassar, Indonesia
*Corresponding to:
Irene E. Rieuwpassa, Department of Oral Biology, Faculty of Dentistry, Hasanuddin University, Makassar, [email protected]
intended to measure the current risk and risk in the future. Examination of bone mass with a densi-tometer is an accurate and precise examination to assess the prognostic factors, predictive diagnosis of fracture and osteoporosis risk. However, the examination of bone mass is relatively expensive so it cannot be achieved by the whole public layer. Therefore, alternative methods are needed to look at bone health that can be used on a large scale.6
Radiography is an investigation that is often done to help establish a diagnosis. Radiographs in dentistry are divided into intra-oral and extra-oral radiographs. Extra-oral radiographs are most often used in the field of dentistry known as panoramic radiography. Panoramic radiography is a tech-nique to produce images of bone structure of the face including the maxillary, mandibular and other supporting structures.5
Panoramic radiographs can be used to detect osteoporosis. The panoramic radiography index used to detect osteoporosis in elderly women is the mental index (MI). Mental index can be used to detect osteoporosis because previous studies showed that depletion of the mandibular cortical thickness below the mental foramen has a signifi-cant correlation with low BMD or osteoporosis.7
This study uses panoramic radiography as a research medium because it displays the entire image in a single film. Panoramic radiography was selected in the framework of early osteoporo-sis because the examination is easier to perform, more equipment is available and inspection costs are more affordable. Panoramic radiography alters some of the maxillary and mandibular bones to detect the risk of bone loss. Several indices have been developed to assess and measure the quality of mandibular bone mass and to observe the signs of resorption on panoramic radiography. The panoramic mandibular index (PMI) is the thick-ness of the mandibular mental foramen divided by the distance to the inferior cortex of the mandible. The mandibular cortical index (MCI) is a classifica-tion of the morphology of the mandible that illus-trates the porosity of the mandible and is associated with the mandible bone density. MI is a mandibular cortical thickness based on the mental foramen.8
One way that can be used to measure the qual-ity of the mandible bone mass is to use a MI. MI is the average thickness calculated bilaterally on panoramic radiographs in the area below the fora-men fora-mental, which is between the teeth P1 and P2. Samples were diagnosed with osteoporosis based on MI index values ≤ 3 mm.7
This type of research is observational analytic. The design of this study was a cross-sectional study. Panoramic Radiography Techniques: The techniques used to obtain a complete picture of the overall maxillofacial
included the maxillary and mandibular along with the supporting structure. Osteoporosis: If the average thickness of the mandibular cortex is greater than 3 mm, then elderly women: The women belong to a group of people who are going through a process of gradual change over several decades. In this case, the age was limited women between 50-80 years. Sixty dental patients of the Toraja tribe (age range between 45-90 years) were evaluated at the Department of Oral Diagnosis and Radiology at Hasanuddin Universi-ty. There were 32 samples ranging from 45-59 years, 22 samples ranging from 60-70 years and 6 samples ranging from 71-90 years. The age of menapouse in each patient, the dental status, the age and the status of osteoporosis was recorded according to the patients medical history. All panoramic images were made using a panoramic machine (Planmeca PM 2002 CC Proline; Helsinki, Finland) by radiology technicians. A researcher evaluated each image according to the patient’s position, head alignment, film density and contrast to avoid including any distorted radiography.
All data was analyzed using the Statistical Package for the Social Sciences (SPSS) V.17.0 (SPSS Inc. Chicago, Illinois, USA). Descriptive statistics, cross-tabulations, and Chi-square statistics were computed with the statistical significance set at P<0.05.
The methodology of this has been approved by researched etichs commitee of faculty of Medicine Hasanuddin University (Reg no. 01961/H4.8.4.5.31/ PP36-KOMETIK/2014).
Results
The research was compiled to determine the relationship between age and mandibular cortex thickness. The 60 (100%) samples in this study consisted entirely of women. There were 32 women (53.3%) aged 45-59 years, 22 women (36.7%) aged 60-70 years and 6 women (10%) aged 71-90 years.
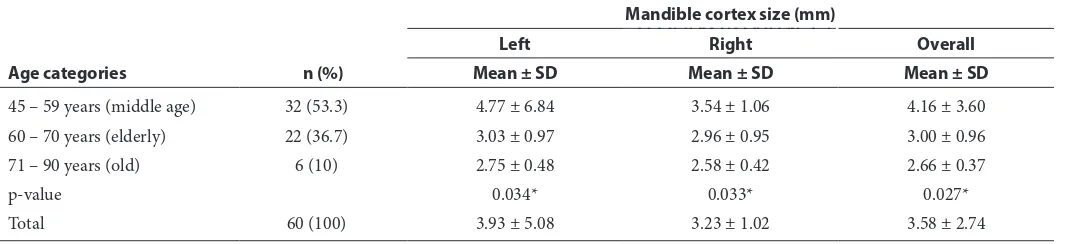
Differences of the mandibular cortical thickness (mm) by age category are shown in table 1. The age categories in this study following the guidelines of the WHO. The results showed that the largest average thickness of the cortex of the mandible was observed at 45-59 years, while the smalle st average thickness was observed at 71-90 years. Figure 1
to only 2.66 mm. The Kruskal Wallis statistical test results show that there are significant differences in mandibular cortical thickness in the left (p = 0.034), right (p = 0.033) and overall (p = 0.027) between the age categories (p <0.05).Table 2 shows the results of the Mann Whitney U-test between the age categories in the left, right and overall mandibular cortex. Visible on the left side of the cortex of the mandible, there are significant differences (p = 0.040, P <0.05) of 1.737 mm between cortex thickness age of 45-59 years and 60-70 years. It also followed between the ages of 45-59 years and 71-90 years (p = 0.033, p <0.05). However, there are no significant differences between the age of 60-70 years and 71-90 years (p: 0.682, p> 0.05). On the right side of the cortex, there were no significant difference between the
age of 45-59 years to 60-70 years (p: 0.051, p> 0.05) or between the ages of 60-70 years to 71-90 years (p; 0.460, p> 0.05). However, there are significant differences between the age of 45-59 years and 71-90 years (p: 0.026, p <0.05). In the overall cortex, differences in the mandibular cortical thickness were significantly between the ages of 45-59 years to 60-70 years, and between the ages of 45-59 years to 71-90 years. However, there was no signifi-cant difference between the age of 60-70 years to 71-90 years.
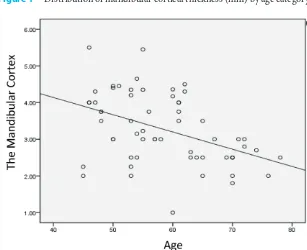
Table 3 and figure 2 show the relationship of age with mandibular cortical thickness. The results showed that there is a significant relation-ship between age and left mandibular cortical thickness (p: 0.001, p <0.05), right mandibular cortical thickness (p: 0.003, p <0.05), and overall Table 1 Differences in the size of the mandibular cortex (mm) by age category
Age categories n (%)
Mandible cortex size (mm)
Left Right Overall
Mean ± SD Mean ± SD Mean ± SD
45 – 59 years (middle age) 32 (53.3) 4.77 ± 6.84 3.54 ± 1.06 4.16 ± 3.60
60 – 70 years (elderly) 22 (36.7) 3.03 ± 0.97 2.96 ± 0.95 3.00 ± 0.96
71 – 90 years (old) 6 (10) 2.75 ± 0.48 2.58 ± 0.42 2.66 ± 0.37
p-value 0.034* 0.033* 0.027*
Total 60 (100) 3.93 ± 5.08 3.23 ± 1.02 3.58 ± 2.74
Normality test; Shapiro-Wilk test: p>0.05, data distribution normal *Kruskal Wallis test: p<0.05: significant
Table 2 Results of Mann Whitney U-test between the age categories in the mandibular cortex regions
Cortex of the mandible Age(i) years Comparison (j)years Mean Difference (i-j) p-value
Left 45 – 59 60 – 70 1.737 0.040*
71 – 90 2.023 0.033*
60 – 70 71 – 90 0.285 0.682
Right 45 – 59 60 – 70 0.579 0.051
71 – 90 0.963 0.026*
60 – 70 71 – 90 0.383 0.460
Overall 45 – 59 60 – 70 1.158 0.046*
71 – 90 1.493 0.014*
60 – 70 71 – 90 0.334 0.723
*Post Hoc test:Mann Whitney U-test; p<0.05: significant
Table 3 Relationship to the thickness of the mandibular cortex
Age (years) Mean ± SD Mandibular Cortex
p-value r / r2
Part Mean ± SD
58.45 ± 8.85 Left 3.93 ± 5.08 0.001 -0.414 / 0.171
Right 3.23 ± 1.02 0.003 -0.376 / 0.141
Overall 3.58 ± 2.74 0.001 -0.411 / 0.168
mandibular cortical thickness (p: 0.001, p <0.05). Visible correlation coefficient (r) is negative meaning there is an inverse relationship between age and mandibular cortical thickness. The r value of -0.411 indicates that the relationship between these two variables have moderate strength. The power shows a clearer understanding because the value of the determination coefficient is 0.168 or 16.8%. Thus, the overall research data shows older persons will be followed by a decrease in the mandibular cortical thickness of 16.8%.
Discussion
Bone is constantly resorbed and formed in the process known as remodelling. Bone formation takes place not only during growth, but throughout life. From age 30-50, the amount of bone formed approximately equals the amount resorbed. From the menopause in women and from about the sixth decade in men, bone resorption starts to exceed
bone formation. The earliest suggestion of an association between osteoporosis and oral bone loss was made in 1960.10,11
Researchers have studied the alveolar bone which they believed best resembled the vertebral bodies because neither of the bones have muscular insertions. They utilized dental radiographs and commented that with standardized techniques and proper control, radiographs of the alveolar process might prove to be the better indicator of systemic osteoporosis.11
Based on histological quantification, it was also found that the cortical porosity of the mandible increased with age and that there was consider-able intra-mandibular variation in cortical porosity, with bone resorption and deposition being most active in the alveolar process as opposed to mandibular body. However, the alveolar bone is influenced by local factors, such as periodontal disease and denture quality, and hence the bone values from a single biopsy of the alveolar process cannot be used to indicate the general structure of the mandible.12-14
In the present study, radiomorphometric indices of the mandible were measured and assessed in the panoramic radiographs. Since dental panoramic radiography is used as a routine screening tool in general dental practice, assessment of radiomor-phometric indices may be helpful to identify low BMD and create awareness of osteoporosis.15
In this study the MI of the cortex of women in the Toraja tribe between the ages of 45-59 years had a thickness average of 4.16 mm. At the age of 60-70 years the thickness decreased to 3.00 mm and the smallest average thickness was observed at the age of 71 -90 years at 2.66 mm. The average MI has a general declining trend with age up to the sixth decade when the values begin to fall sharply compared to the average for the popu-lation. Variations in index averages, compared to Benson et al., Dan Ledgerton et al., can be trusted with variations in ethnicity and smaller sample sizes.16,17
A cortical width of 3 mm is the most appropriate threshold for referral to bone densitometry.18,19
Conclusion
There is a significant relationship between age and mandibular cortex thickness. The largest average mandibular cortex thickness in the Toraja women was obtained at the age of 45-59 years, while the smallest average thickness was shown at the age of 71-90 years. As the person’s age there will be a decrease in the thickness of the mandibular cortex by 16.8%.
Figure 1 Distribution of mandibular cortical thickness (mm) by age category
Acknowledgment
The government of the study country and the World Health Organization did not influence this analysis nor the decision to publish these findings. The study did not receive any financial support
Conflict of Interest
The author report no conflict of interest.
References
1. Colon EC, Lyles KW, Levine DA. Prevalensi and predictor of osteoporosis Treatment of nursing home resident with known osteoporosis or recent fracture 2007;18: 553-559. 2. Johnell O, Kanis JA, Oden A, et al. Fracture risk following
an osteoporotic fracture.Osteoporos Int 2004;15: 175-179. 3. Alhorg HG, Rosengren B, Jarvinen TL. Prevalensi of osteo-porosis and hip fracture incidence in women over 30 years of secular trends. Musculosceletal BMC disord 2010;11. 4. Boel T. Manifestasi Osteoporosis Di Rongga Mulut. J
Dentofasial 2003;1: 174-177.
5. Noerjanto RPB, Savitri Y, Putri MC. Sensitivitas, spesifitas dan akurasipengukuran mentale indeks pada radiografi panoramic wanita pascamenopause. Dentomaxillofac Radiol 2014;5: 8-13.
6. Nasrulloh R, Norjanto B, Savitri Y. Ketebalan korteks man-dibula pada pria dan wanita suku Jawa ditinjau radiografik panoramik. Dentomaxillofac Radiol 2013;4: 20-24. 7. Yunus B. Keterbatasan Radiografi Panoramik dalam
pengukuran ketidaksimetrian mandibular. J Dentofasial 2007;6: 16-20.
8. Hastar E, Yilmaz HH, Orhan H. Evaluation of mental index, mandibular cortical index and panoramic mandibular index on dental panoramicradiographi in the elderly. European Journal Dent 2011;5: 60-67.
9. Bajoria AA, Asha ML, Kamath G, et al. Evaluation of radiomorphometric indices in panoramic radiograph-a screening tool. The Open Dent J 2018;12.
10. Wahner HW, Riggs BL. Methods and application of bone densitometry in clinical diagnosis Crit Rev Clin Lab Sci 1986;24: 217-233.
11. Groen JJ, Duyvensz F, Halsted JA. Diffuse alveolar atrophy of the jaw (non-inflammatory form of paradental disease) and pre-senile osteoporosis Gerontol Clin (Basel) 1960;2: 68-86.
12. Manson JD, Lucas RB. A microradiographic study of age changes in the human mandible Arch Oral Biol 1962;7: 761-769.
13. Atkinson PJ, Woodhead C. Changes in human mandibular structure with age Arch Oral Biol 1968;13: 1453-1464. 14. Von-Wowern N. Variations in bone mass within the cortices
of the mandible Scand J Dent Res 1977;85: 444-455. 15. Von-Wowern N, Klausen B, Kollerup G. Osteoporosis: a
risk factor in periodontal disease J Periodontol 1994;65: 1134-1138.
16. Benson BW, Prihoda TJ, Glass BJ. Variations in adult cor-tical bone mass as measured by a panoramic mandibular index Oral Surg Oral Med Oral Pathol 1991;71: 349-356. 17. Ledgerton D, Horner K, Devlin H, etal. Radiomorphometric
indices of the mandible in a British female population Dentomaxillofac Radiol 1999;28: 173-181.
18. Devlin H, Horner K. Mandibular radiomorphometric indices in the diagnosis of reduced skeletal bone mineral density. Osteoporos Int 2002;13: 373-378.
19. Azhari, Sitam S, Hidajat NN, et al.The development of osteoporosis detective analysis method in trabecular condylus of menopause women using panoramic radiograph. J Dentomaxillofac Sci 2016;1: 80-84.