Excess burden of criminality and redistribution
Dominique Demougin
a,*, Robert Schwager
ba
Otto-von-Guericke-Universita¨t, Magdeburg, Germany
bZentrum fu¨r Europa¨ische Wirtschaftsforschung, GmbH, Mannheim, Germany
Received●●●; accepted 17 February 2000
In the Western world, some provision for those threatened by the extremes of indigence or starvation due to circumstances beyond their control has long been accepted as a duty
of the community.. . .The necessity of some such arrangement in an industrial society is unquestioned— be it only in the interest of those who require protection against acts of
desperation on the part of the needy . . . F. Hayek1
Abstract
A model where a portion of the population participates in illegal activities is developed. The propensity to participate in crimes depends on the probability and the opportunity cost of being arrested. The government can influence these variables by law enforcement expenditures and by social transfers. We analyze the cost minimizing policy mix and the incentive of wealthy agents to finance redistribution. We compare this approach with standard modelling where redistribution follows from altruistic preferences. © 2000 Elsevier Science Inc. All rights reserved.
1. Introduction
In the present paper, we examine the need for security asraison d’eˆtrefor the introduction of distributional objectives. We find that tax payers are, indeed, willing to finance transfers to reduce criminality if the safety to be implemented exceeds a critical value. Whether the
* Corresponding author. Tel.:149-391-671-8546; fax:149-391-671-1218. E-mail address:[email protected] (D. Demougin).
1Hayek, F.,
The Constitution of Liberty, p. 285 (1960).
optimal security level reaches that pivotal threshold is shown to depend on the presence of anexcess burden of criminality.
To substantiate our questioning consider one of the standard arguments advanced in literature to theoretically justify income maintenance policies. For example Wildasin2states that “the rich are assumed to be altruistic toward the poor and, therefore, to be willing to incur tax liabilities to support redistributive transfers to the poor.” These alleged altruistic preferences are then formalized in the form of a welfare function. That function pins down a specific marginal rate of substitution between the income of wealthy and poor agents. What factors determine altruism and the ensuing marginal rate of substitution between income groups? How is this rate affected by variations in the underlying economic structure? In order to provide a possible answer to some of these questions, we introduce a model where an altruistic like behavior is founded on tax payers’ demand for safety. In our model, rich members of society consider and may, indeed, care about the income level of the less favored. They care not because of genuine altruism but because income of the poor influences their opportunity costs of a criminal activity. Seen from that perspective, transfers become one instrument to produce the public good of safety.3
Explicitly, we model the incentives of potential criminals. We consider a world with two types of individuals distinguished by their productivity. High productivity agents pay taxes and may also become victim of a crime. Low productivity agents could receive welfare payments and may decide to become thieves. The incentive to get involved in such a crime will depend on the probability and the opportunity costs of being arrested. Governments can influence both variables by spending more or less money on law enforcement,4 and by varying the level of welfare benefits.5 In a first result, we derive the cost minimizing policy mix for an exogenously given level of public safety. We find that for a high level of criminality, it is cost effective to exclusively rely on law enforcement, and to pay no transfer. However, we also show that in order to achieve a low level of criminality, it will at some
2Wildasin, D., Income redistribution in a common labor market, 81American Economic Review757, 774
(1991), at 757.
3See Hayeksupranote 1. Heuristically, the argument can also be found in Pauly, M., Income redistribution
as a local public good, 2Journal of Public Economics35, 58 (1973), at 38, who points out that “if poverty contributes to the incidence of crimes against property and persons, one way to reduce crime may be to redistribute income.” For an early formalization of this argument in a partial equilibrium model, see Brennan, G., Pareto desirable redistribution: The non-altruistic dimension, 14Public Choice43, 67 (1973). A more recent model highlighting the crime reducing impact of social transfers is presented by Zhang, J., The effect of welfare programs on criminal behavior: A theoretical and empirical analysis, 35Economic Inquiry120, 137 (1997). None of these papers, however, deals with the optimal choice problem of the taxpayers, which is our main focus.
4We abstract from all considerations of private provision of security because of the well-known public good
nature of safety.
5From today’s perspective, such a motivation for the welfare state might appear quite extreme to some.
point become advantageous to redistribute income. Heuristically, transfers can only be effective if there is a possibility to lose them when an agent undertakes a crime. Hence, one must first rely on law enforcement. At this stage, whether or not altruistic like behavior occurs, depends on the desired level of safety.
However, safety itself is an endogenous variable that should be determined within the model. Following standard practice, we analyze this choice from the point of view of those who finance transfers.6This approach can readily be motivated if the proportion of productive agents is large enough. In that case the optimal choice of the productive agents also solve the median voter problem. More generally, the perspective of the wealthy is important because one would expect that it generates a lower bound solution (i.e. extending the social objective to incorporate the preferences of the poor could only increase optimal transfers). When optimizing the rich trade off the damage of criminality against the costs of security. The latter costs are given by the tax required to finance the policy mix along the expansion path and the associated excess burden. In analogy to taxes, we introduce the idea of an excess burden of crime as the difference between the gain to the offender and the damage to the victim.7We find that this difference plays a crucial role in the analysis. When there is no such excess burden of criminality, redistribution through the tax system is never optimal.8 To use a metaphor, we are in an environment where taking the medicine makes the patient worse off than the actual illness. Specifically, to reduce the cost of criminality by 1$ using transfers would always impose a burden of more than 1$, and this for two reasons. First, because taxation causes a deadweight loss. And second, because social security cannot discriminate between potential criminals and other poor individuals. As a result, to reduce criminality via a tax-transfer scheme all the unproductive agents would have to be ‘bribed’. Consequently, in the absence of an excess burden of crimes altruistic like behavior cannot be founded on safety considerations.
However, such a deadweight loss appears very reasonable. In the case of theft, an obvious justification is that stolen goods cannot be sold at market prices. Further examples are the possibility of physical pain inflicted by an injury, the psychological suffering or even risk aversion concerns on the part of victims.9If one of these excess burdens is large enough, it becomes optimal even for the wealthy to advocate a redistribution of income in order to increase public safety. This shows that the presence of an excess burden of crime can justify
6For example, Wildasin assumes that “redistributive transfer policy is set in such a way as to maximize the
welfare of the rich” (supranote 2, at 763). A similar approach is used by Pauly,supranote 3.
7For an introduction in the concept of the excess burden of a tax see e.g. Rosen, H.Public Finance, 3rd ed.,
Irwin, Homewood and Boston (1991) at 305-306.
8Thinking of Robin Hood in Sherwood Forest, it should be noted that criminality is also a form of
redistribution. However, unlike the standard tax system, it only imposes a lump-sum burden.
9For example, Anderson provides a lower bound of such a deadweight loss for the US. According to his study
“the value of injuries” caused by criminality in the US amount to as much as $135 Billions per year or approximately $50 millions per 100,000; see Anderson, D., The aggregate burden of crime, XLIIJournal of Law and Economics611, 642 (1999) at 636.
10United Nations Surveys of Crime Trends and Operations of Criminal Justice Systems 1995,a
Statistisches Jahrbuch fu¨r die Bundesrepublik Deutschland (1998), p. 364,bAnnuaire statistique de la France (1998), p. 967, c
Statistisches Jahrbuch der Schweiz (1999), p. 474.
altruistic like behavior. However, the resulting trade-off between the income of the wealthy and that of the poor is not fixed by a true altruistic preference structure. Instead it reflects cost minimizing behavior of the rich where the occupational choice of the unproductive agents enters as a constraint. Accordingly, any changes in the underlying parameters, like e.g. the excess burden of crime, will affect the trade-off.
Before discussing existing literature, some rough numbers might be useful to appreciate the magnitudes involved. Table 1 summarizes some data on law enforcement and criminality for a few OECD countries. Figures on social assistance are harder to compare because the welfare systems differ across countries. Some countries guarantee a minimum subsistence level. For a single person in Denmark, this amounts to about 40% of per capita GDP. The corresponding figures in Germany and France are 33% and 25% respectively. In the US and in Switzerland, welfare is decentralized. Overall, the Swiss cantons provide a benefit level comparable to the one in Germany. In contrast, it is well known that in the USA, social assistance is substantially lower than in all these countries, in particular for young, single, healthy males. Without reading too much into these numbers, they nevertheless suggest that there is a negative correlation between the generosity of the welfare state and the amount of criminality.
Since according to our reasoning, welfare benefits contribute to reducing criminality, it may be instructive to compare the aggregate expenditures for law enforcement and social welfare payments across countries. In Germany, the latter summed up in 1998 to $26 billion per year. Given that the US has more than three times the German population, this seems high compared to about the same figure for the American AFDC program wich added up to approximately $24 billions in 1995. However, Table 1 suggests that Germany recovers a large part of its social assistance payments through lower expenditures on law enforcement.12 Our paper is closely related to two recent articles. Imrohoglu, Merlo and Rupert13 investigate similar issues, though, with an entirely different methodological approach. Where we solve a stylized model analytically, they set up the problem, calibrate the relevant
12Anderson
supranote 9 estimates annual costs for police, corrections, and the legal and judicial costs of state and local criminal cases in the USA at $47, $36 and $19 billion respectively. These figures show that the lower level of law enforcement activities in Germany as displayed in table 1 translates into substantial cost savings.
13Imrohoglu, A., A. Merlo and P. Rupert, On the political economy of income redistribution and crime, Federal Reserve Bank of Minneapolis Research Department Staff Report216 (1996).
Table 1
Law enforcement10(1990) and criminality11(1996) per 100 000 inhabitants
USA D F CH DK
Police personnel 330.3 248.5 336.7 243.7 250.8
Prison population 464.9 a
Robbery and violent theft 202.44 82.60 136.95 31.59 43.42
a
Statistisches Jahrbuch fu¨r die Bundesrepublik Deutschland (1998), p. 364.
bAnnuaire statistique de la France (1998), p. 967. c
variables using US data from 1990 and then simulate some policy changes and solve for a median voter equilibrium. Of course, such a procedure is very useful because it generates some rough quantitative estimates of the relevant trade-offs. In contrast, our simple analytical framework allows us to explicitly point out the importance of the acceptable crime level and of the excess burden of criminality to understand the optimal policy mix. Benoit and Osborne14use the same type of approach as we do and are complementary to our work. Both papers taken together employ three different instruments to reduce criminality which are (i) the severity of punishment, (ii) law enforcement and (iii) redistributive transfers. In contrast to Imrohoglu, Merlo and Rupert15and the present analysis, Benoit and Osborne16aggregate the latter two instruments into a single variable and study its trade-off with the severity of punishment.
More generally, our analysis is part of a broad literature initiated by Becker’s17 seminal work on the economics of crime. We follow Furlong,18 by studying an equi-librium model.19However, Furlong20does not examine the effect of redistribution on the choice of criminal activity. This effect is touched upon in a recent paper by Chiu and Madden.21 However, there the optimal policy is not derived. Finally, Wong22 and Zhang23 also address some similar issues, though mainly from an empirical perspec-tive. Using British time series and US cross section data, these authors confirm our main argument: the crime rate decreases if the standard of living of poor persons is raised.
Finally, our paper also contributes to a second strand of literature. Indeed, many other reasons have been advanced as to why transfers to the poor may be in the interest of taxpayers. For example, redistribution may emerge from a social contract concluded under the veil of ignorance,24 or it may provide an insurance against income shocks occurring during the life cycle.25In this kind of argument, those who end up rich might want to avoid
14Benoit, J.P. and M. Osborne, Crime, punishment and social expenditure, 151(2)
Journal of Institutional and Theoretical Economics326, 347 (1995).
15
Supranote 13.
16Supranote 14.
17Becker, G., Crime and punishment: An economic approach, 76
Journal of Political Economy169, 217 (1968).
18Furlong, W., A general equilibrium model of crime commission and prevention, 34
Journal of Public Economics78, 103 (1987).
19For other related references, see e.g. Ehrlich, I., On the usefulness of controlling individuals: An economic
analysis of rehabilitation, incapacitation and deterrence, 71American Economic Review307, 322 (1981); Usher, D., Police, punishment and public goods, 41Public Finance96, 115 (1986).
20Supranote 18.
21Chiu, W.H. and Madden, P., Burglary and income inequality, 69
Journal of Public Economics123, 141 (1998).
22Wong, Y., An economic analysis of the crime rate in England and Wales, 1857-92,62
Economica235, 246 (1995).
23See
suprafootnote 3.
24Rawls, J.,A Theory of Justice, Oxford University Press, Oxford (1972). 25Varian, H., Redistributive taxation as social insurance, 14
taxationex postbut redistribution increases their utilityex ante. Moreover, Atkinson26claims that income maintenance policies may induce the recipients to take more risk, and Gru¨ner27 shows that transfer payments may improve the allocation of venture capital since able but poor entrepreneurs become more credit-worthy. Such an improvement in the allocation of risk presumably is also beneficial to those who finance transfers. Finally, genuine altruism cannot be ignored. Indeed, its existence can be explained by evolutionary models, e.g. Stark.28Our approach does not contradict any of these arguments. It shows, however, that fighting criminality in itself can be a sufficient motivation for redistribution, albeit not the only one.
The remaining of the paper is organized as follows. In the next section, we present the model. In Section 3, we analyze the trade off between law enforcement and redistribution for a given level of criminality. This generates the cost function of public safety. In Section 4, we provide our main result. Section 5 offers some concluding remarks.
2. The model
As discussed in the introduction, we stylize society by a model with a public sector and two types of agents. We proceed by describing the incentives faced by potential criminals. In the aggregate we obtain a relationship expressing the level of criminality as a function of transfers and law enforcement expenditures (for brevity, we often refer to this second public activity as police but, of course, it is thought to aggregate many other policy variables like court, prison etc.). In order to finance these variables, we introduce the government budget constraint and search for the optimal policy.
The agent’s type is denoted bya [ {0, a} interpreted as productivity. The proportions of types within the population are exogenously fixed and given byufor the non productive individuals.
2.1. Legal activity
For simplicity low productivity agents (typea50) are assumed to have no labor income at all.29However, through a welfare system non-working individuals may receive a lump sum transfertÄ0. For parsimony, we assume that all the agents have the same preferences which can be represented by a utility function that is linear in revenue. The utility of a law abiding type-0-person becomes [Eq. (1)]:
26Atkinson, A.,
Incomes and the Welfare State: Essays on Britain and Europe, Cambridge University Press (1995). For a theoretical analysis of this argument, see Sinn, H.-W., A theory of the welfare state, 97 Scandinavian Journal of Economics495, 526 (1995).
27Gru¨ner, H., Redistribution as a selection device,mimeo, University of Bonn (1998). 28Stark, O.,
Altruism and beyond, Cambridge University Press, Cambridge (1995) at chapter 6.
29A possible interpretation of this assumption is that the productivity of the individuals is below minimum
v0~t!5t. (1) An agent with high productivity receives a positive income net of her effort costs, which is denoted bya. However, in order to finance police and transfers the productive participants are subjected to a tax system. In order to raiseT dollars of tax revenue from a type-a-agent, it is necessary to impose on her a utility loss of k(T) $ T. The functionk(T) includes the actual tax payment T and the excess burden of taxation. Tax revenue is assumed to be bounded above by T#, reflecting the maximum of the Laffer curve. This interpretation ofk
imposes some natural restrictions:k(0) 5 0, k9(0) 5 1, k9(T#) 5 ` andk0(T) . 0 for all 0 ¶ T ¶ T#.
2.2. Criminal activity
Individuals may become criminally active. For simplicity, the model is designed in such a way that type-a-agents never choose to do so. This should not be interpreted as a better moral on the part of high productivity players. Rather it is thought to reflect different incentives. Specifically, the income of productive agents is assumed to be large enough that her opportunity cost of undertaking a criminal activity becomes prohibitive.30 The same argument also guarantees that, in our model, it does not pay for a type-a-agent to stop working in order to draw from social security.
Criminals are assumed to rob only once and either obtainx, 0 , x ¶ a 2 k(T), if they encounter a type-a-agent or 0 otherwise. We denote byp0 the conditional probability that a type-0-agent becomes criminal. Taking into consideration that only a low productivity agent will find it optimal to engage in a criminal activity, the probability that a randomly chosen agent is a thief becomesp 5 up0. Agents are assumed to encounter only one other person at random. Thus,p also denotes the probability that ana 5 a agent will be robbed.31
While x gives the return of a successful crime, we allow for an excess damage imposed on the victim. Specifically, a type-a-person, who may be robbed with the probabilityp, sees her expected utility reduced by d(p) Ä px. The resulting excess burden, measured by the differenced(p)2px, can be justified in numerous ways. For example, we would expect that a criminal cannot sell stolen goods at market prices, thus, driving a wedge between the loss to the victim and the gain to the criminal. A further justification is the possibility of
30A sufficient condition for this is:
a.k~T#!112u
u T# 1~12u!x1d~u!.
It should be noted that conclusions would not be affected if we allowed a proportion of type-a-agents to become criminally active.
non-pecuniary damages to the victim either due to pain inflicted by an injury or more generally to risk aversion considerations. The function d satisfies d9(p) Ä x and d0(p) Ä
0 for all 0 ¶ p ¶ u. Altogether, the utility of a productive agent becomes [Eq. (2)]:
va~T, p!5a2k~T!2d~p!. (2)
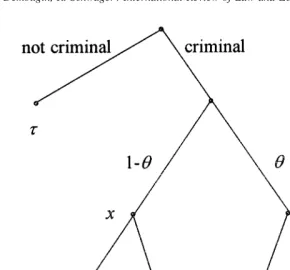
2.3. Occupational choice
The decision process of a type-0-agent is summarized in Figure 1. Since an offender chooses a victim at random, his expected gain from crime becomes (12u)x. Thus, conditional on not being arrested, a thief will enjoy the expected utilityvNA5(12u)x1t.
If arrested, the criminal is assumed to lose his entire monetary assets consisting of x
andt. For simplicity, we assume that these values are dissipated rather than confiscated. In addition, an arrested criminal suffers a nonmonetary utility loss from being sentenced to prison with the monetary equivalent measured bys, which for parsimony is taken tobe independent of the success or failure of the crime.32Hence, conditional on being arrested
vA5 2sis the expected utility of an offender. The disutility of imprisonment is assumed
32Implicitely what we assume is that society punishes the intent of criminal activity. Following the well
known Becker argument,supranote 17, we assume that the time spent in prison is always maximal. Of course,
to be a random variable reflecting different preferences on the part of the agents. For parsimony, s is assumed to be uniformly distributed on the interval [0, s].33
From the point of view of a criminal, rdenotes his probability of being arrested and found guilty through law enforcement efforts. The cost inducingrisc(r) per capita of the unproductive part of the population, henceuc(r) per capita of the overall population.34 We assume c(0)5
c9(0)50, forr.0,c9,c0 .0, andc9(1)5 1`. Thus, a criminal will enjoyvNAwith probability
(12r) andvAwith probabilityr. Hence, his overall expected utility becomes [Eq. (3)]:
vc5~12r!@~12u!x1t#2rs. (3)
Typea 50 individuals will engage in a criminal activity if it generates a higher expected utility than respecting the law. Provided that some, but not all do so (i.e. in the case of an interior solution), we can solve for the critical agent who is just indifferent between either activity (vc 5 v0). Thus, the critical sc is defined by [Eq. (4)]:
~12r!~12u!x2rt 5 rsc. (4)
Because of the assumption of a uniform distribution fors, we conclude that35
p05
5
other policies are also possible. For example in Benoit and Osborne,supranote 14, penalty is endogenous with the trade-off resulting from the risk of wrongful punishment.
33From the point of view of our main conclusions, the assumption of a uniform distribution is inessential.
We use it because of its simplicity and because it avoids second-order derivatives. Its main weakness is that the support must be bounded. It should be noted that in our model a raise insshifts the distribution of
s according to first-order stochastic dominance which can be interpreted as making punishment more painful.
34In this modelization, the per capita cost ofris assumed to be independent from the actual size of the
criminal sector. Heuristically, police is presumed to control persons and not investigate crimes. An example of this may be the monitoring of income tax returns where a given proportion of returns are verified.
35In the case that some of the thieves are
smart(seeSupranote 31) letbdenote the proportion of thieves who can identify the productivity of their victim. Then the formula becomes
p05
S
1r21
D
@12~12b!u#x2tFrom this equation, it is immediately obvious that p0 is decreasing in r and t. This reflects that in our model police activity and welfare payments are two policy instru-ments that may be used to reduce crime.36Law enforcement increases the risk and, thus, the expected cost of unlawful behavior, whereas redistribution37 increases the expected opportunity cost of losing transfers. As can be seen from the equation, this second effect can only occur when there is some level of law enforcement since otherwise transfers can never be lost.
To conclude this section, we note that our modelisation is only one of many possible ways38to introduce the required degree of heterogeneity among the low productivity agents (with homogeneous individuals either all would become thieve or none). A natural inter-pretation of our framework is that s measures the individual present value of a future punishment. The variation in s can then be taken to result from different discount rates. According to that interpretation, it is the impatient agents who become thieves, which is, indeed, a well documented empirical fact.39
3. The cost of public safety
In this section, we keep the level of public safety—measured by p0— constant and minimize expenditures. We derive the cost function of crime deterrence and the optimal instrument mix between r and t. The resulting conditions are necessary for any policy to maximize welfare. Moreover, the analysis is interesting in its own right because of the dual problem. Indeed, due to structural seperation of competence many countries are organized in such a way that lower level governments with no discretion over tax revenues, have to make a choice to allocate funds to different expenditure categories.
3.1. The government budget
It is useful to give the government’s budget constraint in per capita terms. Since only type-a-agents pay taxes, the revenue per individual is (12u)T. From the foregoing section, per capita expenditures for police areuc(r). Finally, transfers are only paid to low
produc-36If s is interpreted as the level of punishment—as suggested in footnote 33—then criminality is also
decreasing with respect to that variable. Benoit and Osbornesupranote 14 analyze the trade off betweensand the aggregated costs associated with the other two instruments.
37This redistribution effect formalizes the argument of Hayek,
supranote 1, and Pauly,supranote 3, cited earlier.
38There are numerous other possibilities. For example, we could have introduced individual specific moral
costs (this would have marginally changed some formulae since these kind of costs would incur even if a thieve is not caught) or, alternatively, assumed that criminals have different degrees of risk aversion.
39See DiIulio, J. Jr., Help wanted: Economists, crime and public policy, 10Journal of Economic Perspectives
tivity agents, thus, yielding an average expenditure for transfers of ut. Altogether, the government’s budget constraint per person becomes [Eq. (6)]:
~12u!T2uc~r!2ut 50. (6)
For any given level of tax T, the government’s budget equation pins down a functional relationship between police and transfer which in the remaining is referred to as the isoexpenditure curve at T. As can be seen from Figure 2, it generates a strictly concave budget constraint defined by [Eq. (7)]:
t 512u
u T2c~r! (7)
with the slope
dt
dr52c9~r!<0 (8)
which is zero atr50 and strictly negative otherwise [Eq. (8)]. Higher revenuesTgenerate a parallel upward shift of the budget constraint.
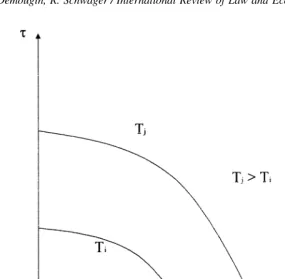
3.2. Isocriminality curves
The definition of p0 in Eq. (5) yields a map of strictly convex isocriminality-curves represented in Figure 3 [Eq. (9)]:
t 5~12u!x
r 2@sp01~12u!x# (9)
with slope [Eq. (10)]
dt
dr52
~12u!x
r2 ,0. (10)
Geometrically, reducingp0shifts the isocriminality curve outward, the intuition being that in order to reduce crime the government must either increase transfers or law enforcement or both. Forr51, the probability of crime drops to zero even without any transfer. This is a natural property in any model with rational agents: nobody will choose to become criminally active if the probability of being arrested is 1. Hence the nocrimi-nality-curve cuts the horizontal axis atr51. At the other extreme, thep051-curve cuts the axis at
r05
~12u!x
s1~12u!x. (11)
Heuristically,r0denotes the highest arrest probability such that without transfers all the low productivity agents choose to become thieves. From Eq. (11), it appears reasonable to think of s as being large relative to (1 2 u)x (i.e. r0 is small). Specifically, we assume (1 2
u)x,s.40In Figure 3 the area to the left of the curve going through pointr0represents the set of policies that inducep0 51. At the other extreme, policies depicted in the area above the curve going through the point r5 1 generate zero criminality.
3.3. Optimal expenditure mix
In this subsection, we define the cost function of public safety, C(p0), as the minimal expenditure necessary to keep criminality41to an exogenously predetermined levelp5up
0. From the minimization problem, we further obtain the optimal instrument mix. We use the definition ofp0 from Eq. (5). It is easily seen that forp051 the cost minimizing policy mix yields T 5 r 5 t 5 0. The intuition should be obvious: if one is ready to accept the maximal possible level of criminality one will not engage in any public safety expenditures. For all other levels of public safety,p0 [ [0, 1), we solve:
C~p0!5min
The first inequality states that criminality must not exceed the predetermined level p0. Geometrically, it implies that the set of permissible policies are to the north-east corner of thep0-isocriminality curve. The second constraint [Eq. (13)] guarantees that transfers cannot become negative, i.e. that poor agents cannot be taxed. In order to solve the above minimi-zation problem, we write the Lagrangian [Eq. (14)]
L5c~r!1t 1 l
S
p02~r2121!~12u!x2t
s
D
1mt (14)which yields two first-order conditions
40Thus,r
0,1/2. The assumption is used only once, in the analysis of the case without any excess burden
of criminality, see proposition 3.
41To defineC(p
0) as public safety is a marginal abuse of language, since it actually denotes the public costs
L
withl,m¶0 since we have a minimization problem. Using these equations [Eq. (18)], we now characterize the solution to problem (I).
First, we observe thatl,0. Indeed, ifl50 were feasible, then from Eq. (15)c9(r) 5
0. By assumption this would implyr50, hence~r
21
21!~12u!x2t
s 5 `, which would
violate Eq. (12). Intuitivelyl 50 is only feasible at the pointr5t 50, which has been ruled out.
From the second multiplier, we have two possible cases:
1. m50. In that case, we have an interior solution with
c9~r!5~12u!x
r2 (19)
andt follows implicitly by Eq. (17).
2. m,0. In that case, we have a corner solution witht50 andrfollows implicitly by Eq. (17).
The optimal policy mix is summarized in the following proposition.
Proposition 1. Definerˆ as the solution of Eq. (19). Forp0 5 1, we have r* 5t* 50. For p0 [ [0, 1) we obtain
1. ifp0 ¶ (rˆ21 2 1)(1 2 u)x/s then r* 5rˆ andt* is implicitly defined by Eq. (17).
2. if p0 . (rˆ
alternative way to restate this observation is that if government could tax unproductive agents (t , 0), it would marginally do so and spend the revenue generated on police.
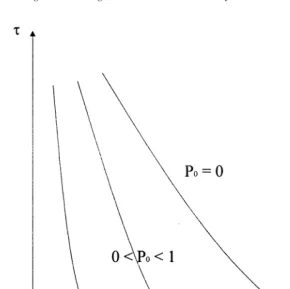
Figure 4 gives the expansion path which results when we vary the level of criminalityp0. For the no criminality case, i.e. p0 5 0, we argue that a corner solution (m , 0) is not possible. This follows immediately from the foregoing paragraph because at the point r5
1,t 50 the marginal rate of substitution along the isocriminality curve is bounded but the marginal rate of transformationc9(1) is infinite. By continuity, the argument extends top0 close to zero. For small shifts, we remain in an interior solution. Thus, police expenditure remains constant with r* 5 rˆ and an increase in p0 implies a reduction in transfers. This downward movement along the expansion path is bounded by one of two situations. Either
p0 becomes 1 or we reach a corner solution 42
—as in Figure 4 —where transfers are zero. Obviously, once this point is reached any further increase in criminality can only be accommodated by a reduction in law enforcement.
42In figure 3, we have represented the case where for somep
0a corner solution results. This will occur
if and only ifrˆ $r0. This will only happen if at the pointr0a corner solution is optimal, i.e. analytically
if
c9~r0!<
~12u!x
r0 2 .
How robust are the conclusions summarized in Figure 4? Our interpretation is that the horizontal part of the expansion path should always result. The heuristic is that transfers can only reduce crime if there is the possibility of losing them,43thus, requiring an established system of law enforcement. In practice, how is the critical value rˆ of police activity determined? From the analysis, it is defined by setting transfers at zero and requiring equality between the marginal rate of substitution along the isocriminality curve and the marginal rate of transformation along the budget constraint. Consequently all the variables that affect these slopes are relevant. For an empirical application one would have to gather data on the cost function for police,c(r), the aggregate wealth in society which influencesx, the distribution of that wealth stylized in the model byu, and factors such as the severity of punishment or morality which we have summarized by s.
The vertical part of the expansion path is an artefact of the simple specification of the model, which is due to the linear way in which transfers enter into the budget constraint and the isocriminality curve. While linearity is a natural requirement for the budget constraint, it is clearly a simplification in the case of the isocriminality curve which was introduced for parsimony. More realistically, one would expect transfers to reduce crime at a decreasing rate. This would generate an expansion path with a positive slope.
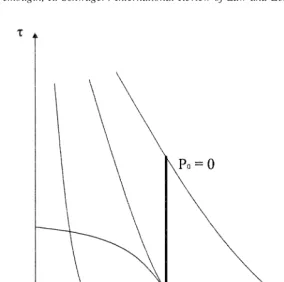
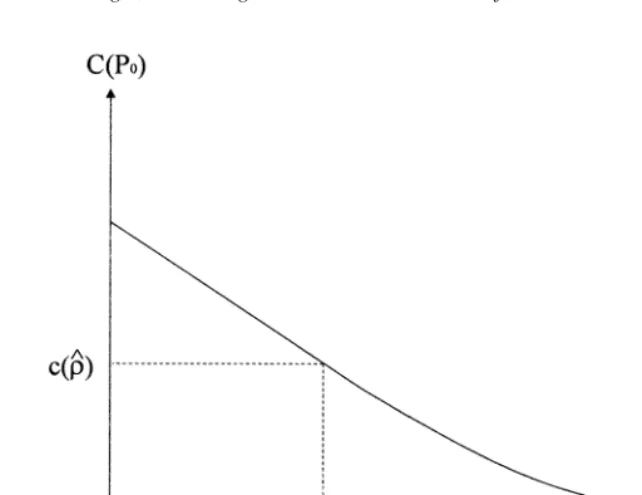
As a result from the optimization, we obtain the cost functionC(p0) which denotes the public expenditure of keeping criminality atp0. From the envelope theorem, we know that
C9(p0) 5 l 5 2s(1 1 m), where the second equality follows from Eq. (16). We have shown earlier that l , 0, thus, costs are strictly decreasing in criminality or equivalently increasing in public safety. As long as we are in an interior solution, the marginal cost inp0
is2s. Geometrically, we are on the vertical part of the expansion path and any variation in public safety is entirely absorbed by an appropriate variation in transfers. As a result, marginal cost follows from the partial p0/t. In the case of the corner solution, the government cannot keep the marginal costs of both instruments equalized. Therefore a further increase inp0 translates in less cost saving, i.e.2C9(p0) ,s. Results are summa-rized in Figure 5.
The last two figures are also of interest for the dual problem where a local government maximizes public safety for an exogenously given level of income. Given a level of revenue, we can read from Figure 5 the optimalp0 and from figure 4 the resulting policy mix.
4. When would the rich desire redistribution?
In this section we complete the analysis by solving the trade-off between taxes and public safety. We do this from the perspective of a representative type-a-citizen only.44 Our approach is motivated by the question at hand: does the demand for public safety induce the
43This is exactly the kind of mechanism that Bismarck alluded to in the citation of footnote 5. 44See
taxpayers to behave as if they were altruistic? Specifically, we ask under what circumstances does it become advantageous for those who finance the transfers to redistribute income.45
The interest in this question can be further motivated from a public choice perspective. If the rich are the majority (u , 1/2) then, of course, their optimal policy choice is also the median voter equilibrium. Furthermore, as we show in the next section, in any other kind of social choice mechanism satisfying the Pareto-criterion, the optimal decision of the rich provides a lower bound for transfers.
To solve the problem of the rich, we reformulate the issue at hand in terms of the policy mix summarized in Figure 4. Specifically, when is it optimal for the rich to choose a point on the vertical part of the expansion path (the “altruistic” case) and when should they choose a policy mix on the horizontal part of that same path (the “non-altruistic” case). To answer the question, we use the cost function for public safety to define the indirect utility of a representativea-type agent [Eqs. (20 –21)]:
v*a5max
T,p0 va~T, up0!5a2k~T!2d~up0! (II)
C~p0!5
~12u!
u T (20)
45At this point, it is worthwhile to go back to the issue of private provision of safety which was ruled out by
assumption (seesupranote 4). Since in our model, all the wealthy agents are identical, their demands for safety will be the same. Thus, the choice of public safety by the representative agent would crowd out any private provision of security.
0<T<T# (21)
Though it is analytically feasible for the no tax solution to be optimal, we do not regard this case as particularly interesting.46 Such a situation would only occur if all the low productivity agents choose to be criminally active. From an empirical perspective this case does not appear convincing. Indeed, as stated by Blank47“criminal activity . . . are, even in the poorest neighborhood, the activity of a few.”48For that reason, we restrict attention to the case where p*0 is strictly below unity.
Substituting the cost of public safety in the objective function of the representative type-a-agent and maximizing with respect to p0 yields the following condition:49
2k9
S
u~12u! C~p0!
D
u
~12u! C9~p0!5ud9~up0!. (22)
This equation has a straightforward interpretation. It equates the marginal damage of criminality (the right handside) to its marginal benefit from the reduction in required taxes. This benefit depends itself on the marginal cost of taxes and on the effectiveness of government revenue to affect criminality.
Since minimizing public expenditure is a necessary condition to resolving (II), we can immediately apply proposition 1 to p*0. Thus:
Corollary 2:For p*0 [ [0, 1), we obtain:
1. if p*0 , (rˆ21 2 1)(1 2 u)x/s then t* . 0, 2. if p*0 Ä (rˆ21 2 1)(1 2 u)x/s then t* 50.
In this form the result is not very interesting. All it states is that transfers will be positive if the optimal level of criminality is smaller than the level represented by the isocriminality curve going through the pointrˆ. However, the corollary allows us to compare our approach with the standard modelling where redistribution is derived from optimization of a welfare function. The trade-off between the incomes of wealthy and poor individuals is not fixed by the form of such a function, but depends on the equilibrium behavior of individuals. Specifically, consider the definition ofp0 in Eq. (5) which describes the occupational choice of low-productivity agents. In a situation wherep*0 ,(rˆ2121)(12u)x/s, one can insert
46Since
k9(T#)5 `, a solution will never implyT5T#. On the other hand, a corner solution withT50 is possible because of the discontinuity ofC(z) at the pointp051. This corresponds to the maximum level of criminality. From figure 3, we note that the p0 5 1-curve is bounded away from the origin. In other words,
starting atp051, a marginal decrease in criminality requires a discrete jump in taxation. Yet the resulting benefit can only be marginal since all the other curves are differentiable. Thus, there always is a local maximum atT5
0.
47Blank, R.,
It Takes a Nation: A New Agenda for Fighting Poverty, Princeton University Press, Princeton (1996).
48
Id. at 51.
49It is easy to derive that the objective function is concave for allp
0,1. This follows from the slope and
p0 into the utility function va in (II) and use r* 5 rˆ to compute the marginal rate of substitution between the tax and the transfer [Eq. (23)]:
dT dtuna5
ud9
sk9 .0. (23)
However, if p*0 Ä (rˆ21 2 1)(1 2 u)x/s, the wealthy agents will always choose t* 5 0 and the marginal rate of substitution is [Eq. (24)]
dT
dtuna50. (24)
Thus the marginal willingness to pay for redistribution does not only depend on the preferences of the wealthy agents. In addition, the marginal damage of criminality (d9), the excess burden of taxes (k9), the incentives faced by potential criminals ((12 u)x and s), and the marginal costs of law enforcement (c9(r)) are important. In particular, these structural variables determine which of the cases of the corollary is relevant, and hence, whether the wealthy agents do indeed behave as if they had altruistic preferences.
In the rest of the section, we provide some intuition for the kind of economic environments which generate such altruistic like behavior. We do this by presenting several specifications for the damage functiond(p) which highlight the conditions leading to a positive transfer. First, we consider the case where there is no excess burden of criminality, i.e.
d~p!5px. (25)
Here [Eq. (25)], the loss of the victim is exactly as large as the gain for the offender. In this formulation, crime can be thought a ‘pure and socially costless redistribution of income’. As we now show, if this were true, it would never pay to use transfers to reduce criminality.
Proposition 3:If there are no excess burdens of criminality then transfers are always zero.
Proof:Used9 5 x, k9 . 1 ands . (12u)x. It followsp*0 Ä (rˆ21 21)(1 2 u)x/s. Q.E.D.
To understand the intuition of this result, let us initially imagine that all the unproductive population became involved with crime. It is easy to see that transfers would never be used. Indeed, as mentioned above, both transfers and stealing can be thought as one way to redistribute income, but transfers are more expensive due to the excess burden of taxes. The argument is even further reinforced when only a fragment of the unproductive population engages in crimes because transfers cannot discriminate and, thus, be targeted to potential offenders. From this we learn that redistribution will only be considered by the rich as a possible instrument when there is an excess burden of criminality. In other words, the existence of a deadweight loss of crimes is a necessary condition for altruistic like behavior to occur. It should be noted that the same conclusion would follow more generally even if we considered the costs of criminality on the less favored.
prices. As a result, the damage to a victim is larger than the gain to the thief. We denote with
y, y . x, the loss to the victim which yields
d~p!5py. (26)
With this formulation [Eq. (26)], a transfer is optimal if y is large enough. Specifically
Proposition 4.Defineyˆ 5 s 12uk9
S
u
12uc~rˆ!
D
, then ifd(p) 5 py, for ally . yˆ, the optimal transfer is strictly positive.The proof follows immediately from Eq. (22) and is left for the reader. Heuristically, variations in y leave the marginal benefit of criminality (the left handside of Eq. (22)) unchanged. However, the marginal damages of criminality increase linearly inyreducing the optimal level of criminality p*0. At some point, p*0 will attain the critical value (rˆ21 2
1)(12u)x/s. Any further increase inywill move the optimal policy along the vertical part of the expansion path and transfers become positive.
Finally, we consider a case where the excess burden is due to risk aversion considerations on the part of the type-a-agents. For simplicity, we assume a mean-variance-preference structure. We abstract from other kinds of excess burden so that the expected loss ispx and the variancep(1 2 p)x2. Thus, we may write [Eq. (27)]
d~p!5px1rzp~12p!x2, (27) where r . 0 measures the degree of risk aversion. As long as the probability of being a victim of a crime is less than one half, reducingp will not only reduce the expected loss but also the variance. This increases the marginal cost of a crime and hence makes the optimal tax larger, and the optimalp0 smaller. When risk aversion becomes large enough, again the optimal level of criminality falls below the critical value (rˆ21 2 1)(1 2 u)x/s, and the optimal transfer must be strictly positive.
Proposition 5.Define rˆ as the implicit solution of [Eq. (28)]
s To summarize, transfers are the more likely to be used as an instrument to reduce criminality, the higher the wedge is between the benefit of crime for the criminal and the cost of crime for the victim. If this deadweight loss of criminality is large enough, altruistic like behavior can indeed be founded on the demand for public safety on the part of taxpayers.
5. The Pareto frontier
results. We characterize the Pareto frontier50 and prove the claim made in the foregoing section that the optimal transfer from the point of view of the rich is a lower bound for the solution of any welfare maximizing problem satisfying the Pareto-criterion.
To derive the Pareto frontier, we fix the utility of a representative unproductive agent at an exogenously given level v#0 and solve for the maximal feasible utility which a type-a -individual can obtain, i.e. [Eq. (29)]:
max
t,r,T,p0va5a2k~T!2d~up0! (III)
s.t.v05t >v#0 (29)
p05
~r2121!~12u!x2t
s (30)
~12u!T5ut 1 uc~r!. (31)
Feasibilty requires that the level of criminality is given by Eq. (30) and that the govern-ment budget constraint [Eq. (31)] is satisfied. We followed standard practice by ignoring the
50The usual economic condition for efficiency is the Pareto criterion. Considering all the feasible
combina-tions of utility for the poor and the rich, the criterion requires that it is not possible to increase the utility of one person without reducing that of the other. The Pareto frontier is the set of all such combinations.
welfare benefits of criminality to a thieves. For parsimony, we also neglect all the potential costs of criminality to the poor.51
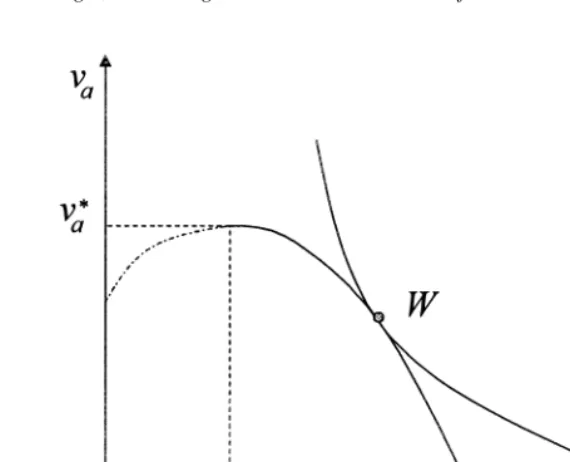
The solution of (III) is represented graphically in Figure 6 for the case of an excess burden of criminality large enough thatt*.0. It should be noted that the Pareto frontier consists only of the downward sloping part of the curve. The dotted part results when we imposet5
n#0.
Of course, whent*.v#0, imposing such a constraint hurts both groups in the population. The poor suffer because they get less transfers and the rich because the total costs of criminality are not minimized.
In the figure we have also drawn the social optimum for an arbitrary Paretian welfare function. As can be seen, this optimum will never be to the left of the point (t*, v*a). We immediately conclude thatt* provides a lower bound for the welfare maximizing level of the transfer.
6. Conclusion
We have shown that redistribution can in some cases be in the interest of those who finance transfers because it promotes public safety. From a cost minimizing perspective, we found that transfers across income groups are only optimal if a high level of public safety is to be achieved. Otherwise our model suggests that pure law enforcement minimizes expen-ditures. We also derived the optimal amount of taxes which wealthy agents are willing to pay in order to reduce criminality. We found that, when there are no excess burdens of criminality, the level of taxes chosen is so low that no transfers are ever paid. However, the assumption of no excess burden does not appear very realistic. We constructed two simple cases where an excess burden will lead the wealthy agents, for some parameters, to find redistribution optimal. Intuitively, this occurs when the excess burden is large. Thus, our paper showed that safety concerns lead to the same behavior as altruistic preferences if and only if criminality creates a substantial deadweight loss.
The conclusions of our paper were derived in a very stylized framework. A natural question is whether the deductions generalize in a more elaborate environment. Our general perception is that the core trade-offs should be fairly robust to variation of modelling specifications. For example, a natural generalization would be to introduce more than two types of productivity possibly all the way to a continuum. In contrast to our framework, the proportion of welfare recipients would have to be determined within the model. Nevertheless a prerequisite for transfer to be effective for reducing criminality is the existence of a well functioning law enforcement system. Similarly, the use of transfer can only be rational in the presence of an excess of crime.
51Alternatively, we could introduce a damage function for the poor analogous tod(p). It is easily seen that
Acknowledgment