QUANTITATIVE GEOMORPHOLOGICAL ANALYSIS & LAND USE/ LAND COVER
CHANGE DETECTION OF TWO SUB-WATERSHEDS IN NE REGION OF PUNJAB,
INDIA
M. Kaur*, S. Singh, V.K. Verma and B. Pateriya
Punjab Remote Sensing Centre, Ludhiana- 141004, India *E-mail: [email protected]
KEY WORDS: Morphometric Parameters, Land Use/Land Cover Change, GIS and Remote Sensing.
ABSTRACT
Morphometric analysis is the measurement and mathematical analysis of the landforms. The delineation of drainage system is of utmost importance in understanding hydrological system of an area, water resource management and it’s planning in an effective manner. Morphometric analysis and land use change detection of two sub-watersheds namely Kukar Suha and Ratewal of district Shahid Bhagat Singh Nagar, Punjab, India was carried out for quantitative description of drainage and characterisation. The stream order, stream number, stream length, mean stream length, and other morphometric analysis like bifurcation ratio, drainage density, texture, relief ratio, ruggedness number etc. were measured. The drainage pattern of Kukar Suha and Ratewal is mainly dendritic. The agriculture and settlements came up along the drainage network causes the pattern disturbance in the watershed. The study was undertaken to spotlight the morphometric parameters, their impact on the basin and the land use land cover changes occurred over the period of time. Morphometric parameters such as linear aspect, areal aspect and relief aspect of the watershed are computed. The land use/land cover change was extracted from LISS IV Mx + Cartosat1 PAN data. ASTER data is used to prepare DEM (digital elevation model) and geographical information system (GIS) was used to evaluate various morphometric parameters in ArcGIS10 software.
1. INTRODUCTION
A watershed is an area of land that drains all the streams and rainfall to a common outlet such as the outflow of a reservoir, mouth of a bay, or any point along a stream channel. The word watershed is sometimes used interchangeably with drainage basin or catchment (Source: USGS). The fundamental unit of virtually all watershed and fluvial investigations is the drainage basin. An individual drainage basin (a.k.a. catchment or watershed) is a finite area whose runoff is channelled through a single outlet. In its simplest form, a drainage basin is an area that funnels all runoff to the mouth of a stream. The haphazard population growth, unplanned irrigation methods and industrialization elevate the demand of water at much higher extent than the previous times. Scarcity and disturbed patterns of rainfall leads to deeper subsurface water label. In such areas the watersheds are the main source of irrigation and these areas acts as hotspots for new agriculture activities. The management of such areas becomes more important for developing the groundwater resource. So, the watershed management arise as an integral part of sustainable development. Morphometric analysis of a watershed provides a quantitative description of the drainage system, which is an important aspect of the characterization of watersheds. The qualitative morphometric analysis establishes the relationship between various aspects of the drainage pattern of the basin the numerical terms.
1.1 Study Area
The Kukar Suha and Ratewal sub-watershed is located between the Latitudes of 31º5'0" to 31º12'08" N and Longitudes of 76º15'0" to 76º22'51"E and 31º01'25" to 31º88'55" N and longitude of 76º20'00" to 75º25'22" E respectively. Kukar Suha watershed covers an area of 3745 hectares and Ratewal covers an area of 4830 hectares. Alluvial plain, piedmont plain and
Siwalik Hills are the major geomorphologic units of the study area (Figure: 1).
Figure: 1 Location Map of Watersheds
2. RESULTS AND DISCUSSION
Detailed qualitative analysis has been carried out for the study area. The various morphometric parameters have been done for both the watersheds. The area, altitude, slope, profile and texture of landforms comprise principal parameters of the investigation (Pareta 2011) which further grouped into linear, aerial and relief aspect, analysed and discussed below. The land use land cover change is an important component to understand the interactions of the human activities with the environment. The topography of an area demonstrates and controls the land use land covers changes of the region. The study area went through number of changes in a period of time; the course of The International Archives of the Photogrammetry, Remote Sensing and Spatial Information Sciences, Volume XL-8, 2014
rivulets witnesses the flourishing of the various commercial and agriculture activities along the channel.
2.1 Morphometric Parameters
2.1.1 Linear Aspects
Linear aspects such as stream order, stream number of various orders, bifurcation ratio, stream lengths of various stream orders and stream length ratio are computed and described below.
a) Stream Orders: The initial work of morphometric analysis of drainage basin is started by demonstrating stream orders. In the present study the number of stream ordering is carried out using the method given by Strahler (1964). The whole drainage in both watersheds is disseminated in five orders. The highest numbers of streams are in 1st order and number of steams decreases with increase in stream order (Figure: 2.1 and 2.2).
Figure: 2.1 Stream ordering of Ratewal Watersheds
Figure: 2.2 Stream ordering of Kukar Suha Watersheds
Regression Algorithm between Stream Order & Stream Number
Regression Algorithm between Stream Order & Stream Number
b) Bifurcation ratio: The bifurcation ratio is the ratio between the number of streams of given order to the number of streams in the next higher order. Horton (1945) and Schumm (1956) considered the bifurcation ratio as an index of relief and dissection. In the study area it is noted that bifurcation ratios upto second order are near to 3 which are indicative of erosionally controlled streams. Below second order range varies from 3 to 1 indicates that the area have structural disturbances and at the risk of flooding in both Kukar Suha and Ratewal watershed.
c) Stream Length & Mean Stream Length: The stream length is computed based on the law proposed by Horton (1945). The stream number and stream length are higher for first order and decreases as stream order increases. The mean stream length is calculated by dividing the total stream length of a given order and number of stream in the same given order. The mean stream length of the given order is higher than the previous order and lower than the next successive order.
d) Stream Length Ratio: Stream length ratio is expressed as the ratio of the mean length of the given order of the stream to the next lower order. Horton’s (1945) law of stream length refers that mean stream lengths of stream segments of each of the successive orders of a watershed tend to approximate a direct geometric sequence in which the first stream length is the average length of segments of the first order. Changes in the stream length ratio of various orders indicate their late youth stage of geomorphic development (Table: 1).
Stream
Table 1: Results of linear aspects morphometric parameters of both watersheds.
2.1.2 Aerial Aspects
Aerial aspects include drainage density, stream frequency, form factor, circulation ratio, elongation ratio, and length of over land flow, drainage texture.
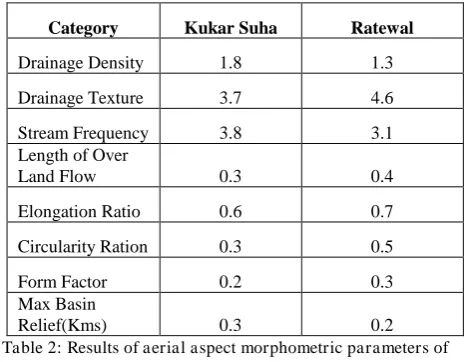
a) Drainage Density: Drainage density is a significant factor to understand land forms element in stream eroded topography. It is the ratio between the total stream lengths within the basin to the basin area. Higher the range of drainage density faster the runoff will be. The drainage density of Kukar Suha and Ratewal watersheds are 1.8 and 1.3 respectively, indicates that the region has highly permeable subsoil, vegetation cover and low relief.
b) Stream Frequency: It is obtained by dividing the total number of streams segment of all order by the total drainage area (Horton 1932). Stream frequency indicates a positive correlation with drainage density suggesting as increase in stream population with increase in drainage density. Stream frequency reflects the texture of the drainage density. Stream frequency of both watershed Kukar Suha and Ratewal 3.8 and 3.1 respectively shows positive relationship with drainage density.
c) Circularity Ratio: Circularity ratio is dimensionless and expresses the degree of circularity of the basin depends on stream flow in the watershed. C.R. is influenced by the length and frequency of streams, geological structures, land use/ land cover, climate and slope of the basin. The C.R. value of Kukar Suha and Ratewal is 0.3 and 0.5 indicates that the watershed is more and less elongated in shape.
d) Form Factor: It is the ratio between the basin area and the square of the basin length and is quantitative expression of drainage basin outline (Horton 1932).Value greater than 0.78 indicated the perfectly circular basin, smaller values suggests the elongated form of basin. With form factor 0.2 and 0.3 for Kukar Suha and Ratewal respectively represents narrow and deep channels.
e) Length of Overland Flow: It is defined as length of flow path, projected to the horizontal of non channel flow from point on the drainage divide to a point on the adjacent stream channel (Horton 1945). Length of overland flow is an important variable affecting hydrologic and physiographic development of
drainage basin. Higher the values of Length of overland flow lower will be the relief and lower the values higher will be the relief. The value of length of overland flow in Kukar Suha is 0.3 and in Ratewal is 0.4. textures. The drainage texture of a Kukar Suha watershed is 3. 7 which indicate coarse texture and Ratewal has moderate drainage texture with value 4.6.
g) Elongation Ratio: Elongation ratio is defined as the ratio of diameter of the circle of the same area as the drainage basin and maximum length of the basin (Schumm 1956). Singh and Singh 1997 said that the circular basin appear more efficient in the (<0.7).Values reaches near to 1 it indicated region of low relief and values ranges between 0.6-0.8 are usually indicative of high relief and steep ground slope (Strahler, 1964). The elongation ratio value of Kukar Suha watershed is 0.6 and Ratewal is 0.7 indicates that the relief is less elongated and moderate to slightly steep ground slope.
Table 2: Results of aerial aspect morphometric parameters of both watersheds
2.1.3 Relief Aspect
The relief aspects include relief ratio, relative relief and ruggedness number and results of the analysis are given below.
a) Relief Ratio: The relief ratio is obtained when basin relief is divided by the maximum basin length (Schumm 1954). Relief ratio measures the overall steepness of a drainage basin and is an indicator of the intensity of erosion process operating on slope of the basin. The relief ratio of Kukar Suha and Ratewal is 0.017 and 0.018 respectively.
b) Relative Relief: Relative relief maximum vertical distance between the lowest and the highest points of the basin. The maximum and lowest height for Kukar Suha is 459m and 215m respectively and for Ratewal the same is 448m and 215m
Category Kukar Suha Ratewal
Drainage Density 1.8 1.3
Circularity Ration 0.3 0.5
Form Factor 0.2 0.3
Max Basin
Relief(Kms) 0.3 0.2
respectively. Using the basin relief the relief ratio was computed as suggested by Melton’s (1957), the relative relief for Kukar Suha and Ratewal comes out as 0.6 and 0.7 respectively.
c) Ruggedness Number: Ruggedness number is product of basin relief and drainage density. Extreme high values of ruggedness number occurs when both variables are large, this is when slope are not steep but long as well (Strahler, 1964). The ruggedness number of Kukar Suha is 0.4 and Ratewal is 0.3.
3. LAND USE AND LAND COVER CHANGE
3.1 Kukar Suha watershed
The Kukar Suha watershed witness many changes over the period of time. The major changes occur in the agriculture and plantation patterns, as the area under both practises increased tremendously (Figure: 4). In year 2002 the agriculture and plantation occupies the area of approx 1946.482 and 46.457 respectively which attains area of 2058 and 111 hectares in year 2009 respectively. The main conversion was done in the scrub land along the streams, choes and nalas, these having area of about 206.093 and 63.769 respectively in year 2002 and in year 2009 it is reduced by 2.184 % with 100.696 hectares. The most conversion is done from scrub to agriculture and agriculture plantations (Table: 3).
Category 2002 2009
Crop 1946.482 2058.967
Plantation 46.457 111.335
Rural 185.958 174.967
Forest 1294.357 1291.3532
Pond 2.271 2.594
Scrub 206.093 100.696
Choe/Nala 63.769 5.475
Total 3745.387 3745.387
Table: 3 Land Use Land Cover of Kukar Suha in Year 2002 And 2009
Figure: 3 Land Use/ Land Cover Change in percentage of Kukar Suha.
Figure: 4 Landuse land cover (2009).
3.2 Ratewal watershed
Ratewal watershed too has major changes in agriculture and notable change in agriculture plantation with 1733.711 and 59.304 hectares in year 2002 and 2294.253 and 78.993 hectare in year 2009 respectively (Figure: 6). The Choe/ nala area is also decreased by 1.257% as in year 2002 it has total area of 107.272 hectare and in 2009 it contains area of about 46.538 hectares (Table: 4). The rural areas are expanded and the settlements are relatively larger in size. The new settlements also came up along the drain causes exploitation of the watershed.
Category 2002 2009
Crop 1733.711 2294.253
Plantation 59.304 78.993
Rural 244.272 294.317
Forest 1915.894 1694.303
Pond 2.742 1.114
Scrub 767.130 420.807
Choe/Nala 107.272 46.538
Total 4830.325 4830.325
Table: 4 Land Use Land Cover of Ratewal in Year 2002 And 2009
Figure: 5 Land Use/ Land Cover Change in percentage of Ratewal
Figure: 6 Landuse land cover (2009).
4. CONCLUSIONS
The present study demonstrates the vital role played by remote sensing and GIS in preparation of drainage maps, morphometric analysis and study of change in land use / land cover in a timely and cost-effective manner. The morphometric parameters studied show that the watersheds are greatly affected by the structural disturbances, deforestation and haphazard changes in the land use/ land cover patterns. The old course of the natural drains has disturbed due to unplanned and unorganised agricultural practices. Change in agriculture patterns and emergence of commercial agriculture (plantation and orchards) and social compulsion caused an immense impact on the land use and in turn causes natural environmental degradation.
REFERENCES
1. Bhavana, N., et al., 2013. Quantitative Geomorphological Analysis for Characterization of Selected Watersheds in Western Maharashtra, India. IJRSG 2013, Vol. 2, Issue 2, pp. 8-15.
2. Dwivedi, S. C., 2011. Morphometric Analysis of Four Sub- Watersheds in Bah Area of Agra District Using Remote Sensing and GIS Techniques. 12th Esri India User Conference, 2011.
3. Horton, R. E., 1932. Drainage Basin Characteristics, Transactions, American Geophysical Union, 13, pp. 350-61.
4. Horton, R. E., 1945. Erosional Development of Streams and their Drainage Basins, Bulletin of the Geological Society of America, 56, pp. 275-370.
5. Magesh, N. S., et al., 2012. GIS Model-Based Morphometric Evaluation of Tamiraparani Sub basin, Tirunelveli District, Tamil Nadu, India. Springer Arab J. Geosci.
6. Melton, M. A., 1957. An analysis of the relations among elements of climate, surface properties, and geomorphology. Project NR 389-042, Tech. Rept. 11, Columbia University, Department of Geology, ONR, Geography Branch, New York.
7. Minakshi, et. al., 2014. Land Resources Appraisal Using Satellite Remote Sensing and GIS: A Case Study of Rajni Devi Sub-watershed (District Hoshiarpur).Indian Journal of Ecology, 2014, 41(1), pp. 23-26.
8. Pareta, K., et al., 2011. Quantitative Morphometric Analysis of a Watershed of Yamuna Basin, India Using Aster (DEM) Data and GIS. International Journal of Geomatics and Geosciences, Vol.2, No 1, pp. 248-269.
9. Parveen, R., et al., 2012.Geomorphometric Characterization of Upper South Koel Basin, Jharkhand: A Remote Sensing & GIS Approach. Journal of Water Resource and Protection, 2012, 4, 1042-1050, pp.1042-1050.
10.Schumm, S.A (1954). The Relation of Drainage Basin Relief to Sediment Loss, International Association of Scientific Hydrology, pp 216-219.
11.Schumm, S.A (1956), “Evolution of Drainage Systems &
Slopes in Badlands at PerthAnboy, New Jersey”, Bulletin of the Geological Society of America, 67, pp 597-646.
12.Sethupathi, A.S., 2011. Prioritization of Mini Watersheds Based on Morphometric Analysis using Remote Sensing and GIS techniques in a Draught Prone Bargur – Mathur Sub Watersheds, Ponnaiyar River Basin, India. International Journal of Geomatics and Geosciences, 2011, Vol. 2, No 2, pp 401-414.
13.Snehal, J., et al., 2013. Morphometric Analysis with Reference to Hydrogeological Repercussion on Domri River Sub-basin of Sindphana River Basin, Maharashtra, India. Journal of Geosciences and Geomatics, 2013, Vol.1 No.1, pp 29-35.
14.Soni, S. K., et al., 2013. GIS Based Morphometric Characterization of Mini Watershed – Rachhar Nala of Anuppur District Madhya Pradesh. International Journal of Advanced Technology & Engineering Research, 2013, Vol 3, Issue 3, pp. 32-38.
15.Strahler, A. N., 1964. Quantitative Geomorphology of Drainage Basin and Channel Network, Handbook of Applied Hydrology, pp 39-76.