A NEW SPATIAL AND TEMPORAL FUSION MODEL
Jing Wanga, Bo Huanga, *
a
Institute of Space and Earth Information Science, The Chinese University of Hong Kong, Shatin, Hong Kong -([email protected],
[email protected])
Commission VII, WG VII/6
KEY WORDS: Auto-regression Error, Image Fusion, Landsat, MODIS, Spatial and Temporal Model
ABSTRACT:
As Moderate Resolution Imaging Spectroradiometer (MODIS) and Enhanced Thematic Mapper Plus (ETM+) has a tradeoff between the high temporal resolution and high spatial resolution, this paper proposed a spatial and temporal model with auto-regression error correction (AREC) method to blend the two types of images in order to obtain the composed image with both high spatial and temporal resolution. Experiments and validation were conducted on a data set located in Shenzhen, China and compared with Spatial and Temporal Adaptive Reflectance Fusion Model (STARFM) in several objective indexes and visual analysis. It was found that AREC could effectively predict the land cover changes and the fusion results had better performances versus the ones of STARFM.
1. INTRODUCTION
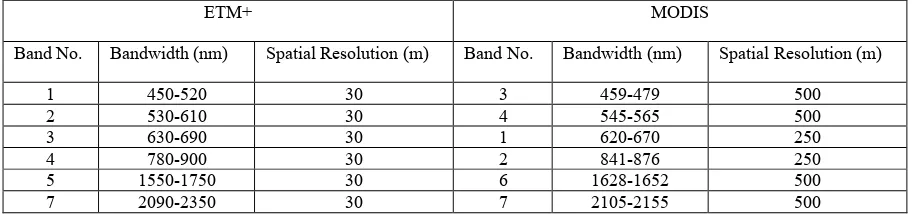
Due to sensor technological limitations, the Enhanced Thematic Mapper Plus (ETM+) has low temporal resolution of 16-day revisit cycle but fine spatial resolution of 30 m while the Moderate Resolution Imaging Spectroradiometer (MODIS), visits the globe once or twice per day with coarse resolution about 250-1000 m. Besides the difference in spatial and temporal resolution, MODIS has corresponding bands to the ETM+ but different bandwidths (Table1). Thus the combination of ETM+ and MODIS data is a necessary and feasible solution to the trade-off between spatial and temporal resolution due to current satellite sensors limits. This paper (Gao et al., 2006) proposed a Spatial and Temporal Adaptive Reflectance Fusion
Model (STARFM) in 2006. The spatial temporal auto-regression (STAR) model (Cliff and Ord, 1975; Szummer and Picard, 1996) was a linear model, which also could be introduced to spatial and temporal fusion.
This paper proposes a spatial and temporal model with auto-regression error correction (AREC) to predict daily surface reflectance at Landsat spatial resolution. The Shenzhen data set included two pairs of registered Landsat-MODIS images acquired on the same dates in the same region. The results of visual analysis and quantitative evaluation between the AREC and STARFM turn out that the AREC could capture the change information and improve the accuracy of surface reflectance prediction.
ETM+ MODIS
Band No. Bandwidth (nm) Spatial Resolution (m) Band No. Bandwidth (nm) Spatial Resolution (m)
1 450-520 30 3 459-479 500
Table 1. The corresponding bandwidths and spatial resolution in ETM+ and MODIS
2. METHOD
This method is based on the spatial temporal auto-regression model. The processing scheme can be summarized as follows. First, we apply an unsupervised classification method to classify the input MODIS images into corresponding clumps. Then we detect the changed area by a threshold method. If an area did not change, we apply the regression model on spatial corresponding pixels. Otherwise, we search the classification result and find the spectrally similar pixels. Following this, we apply the regression model on spectrally similar pixels. Next, in order to improve the detail information and visualization, we perform post-processing such as back projection. Finally, we can generate the fusion result with Landsat resolution and MODIS change information.
2.1 First step
Firstly, an unsupervised classification is performed on a pair of MODIS images. This method employs the unsupervised classification (K-Means or IsoData) method to classify the MODIS images into 8-10 categories (according to the specific
ISPRS Annals of the Photogrammetry, Remote Sensing and Spatial Information Sciences, Volume III-7, 2016 XXIII ISPRS Congress, 12–19 July 2016, Prague, Czech Republic
This contribution has been peer-reviewed. The double-blind peer-review was conducted on the basis of the full paper.
���(�,�)=|�!(�,�)−�!(�,�)| (1)
where ��� �,� is the absolute value of the surface reflectance difference between MODIS �
! (�!) and MODIS �! (�!) in a given pixel (x, y). The threshold is set as dıf, which means the
average difference between MODIS images. If the absolute value lies beyond the threshold, the surface is marked as similar one according to the Euclidean distance. Then the auto-regression error model (2)(3) is applied to the new spectrally corresponding pixels. In all other cases it means that the surface reflectance is nearly the same with the previous date, and we apply the spatial corresponding pixels by auto-regression error model (2)(3) (Wang et al., 2012).
corresponding location at the different time �
!, (�,�)!∗! is the and �� are positively correlated. When the surface reflectance
has changed, we suppose that the relationship between MODIS and Landsat of different time are the same in the term of imagery mechanism and system errors. Then, we can get �!
!=�!!. We can use the relationship between MODIS and Landsat in the time �
! and get change information from MODIS time �
! to obtain the predict Landsat image namely �!,!(�,�)!∗! =�!,!(�,�)!∗!�+�.
2.3 Third step
The final step uses a back projection (Irani and Peleg, 1991) to MODIS � and band 4 (Near Infrared), band 3(Red) and band 2 (Green) of Landsat image for displaying in Figure 1.
Then we applied the AREC and STARFM method to generate the predicted ETM+ images independently. The visualization of the result is shown below (figure 2).
(a) (b)
ISPRS Annals of the Photogrammetry, Remote Sensing and Spatial Information Sciences, Volume III-7, 2016 XXIII ISPRS Congress, 12–19 July 2016, Prague, Czech Republic
This contribution has been peer-reviewed. The double-blind peer-review was conducted on the basis of the full paper.
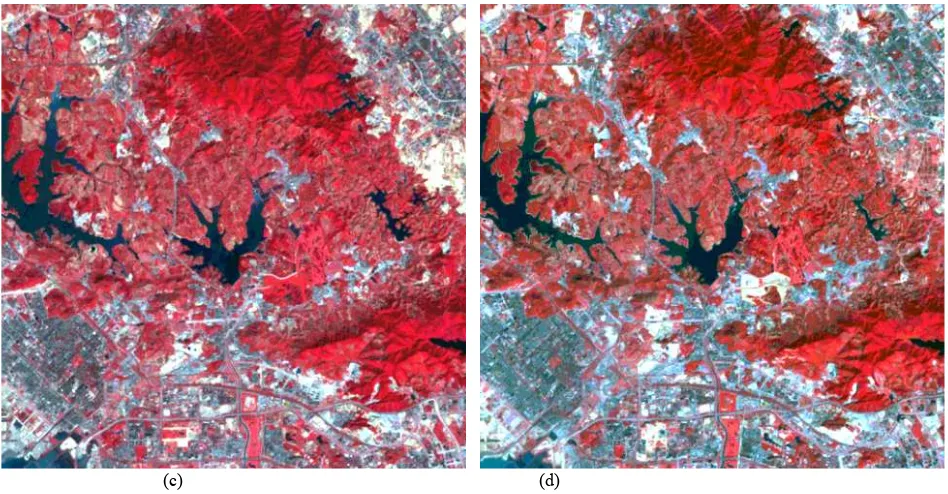
(c) (d)
Figure 1. Shenzhen, China Data Set. The upper two are NIR-red-green composites of MODIS surface reflectance at 250 m spatial resolution (red band has 500m spatial resolution which has been interpolated to 250m), the lower two show corresponding Landsat
surface reflectance at 30 m spatial resolution. (a) MODIS 2000, (b) MODIS 2002, (c) Landsat 2000, (d) Landsat 2002.
(a) (b)
Figure 2. Comparison of the results by STARFM and AREC methods. (a) STARFM (b) AREC
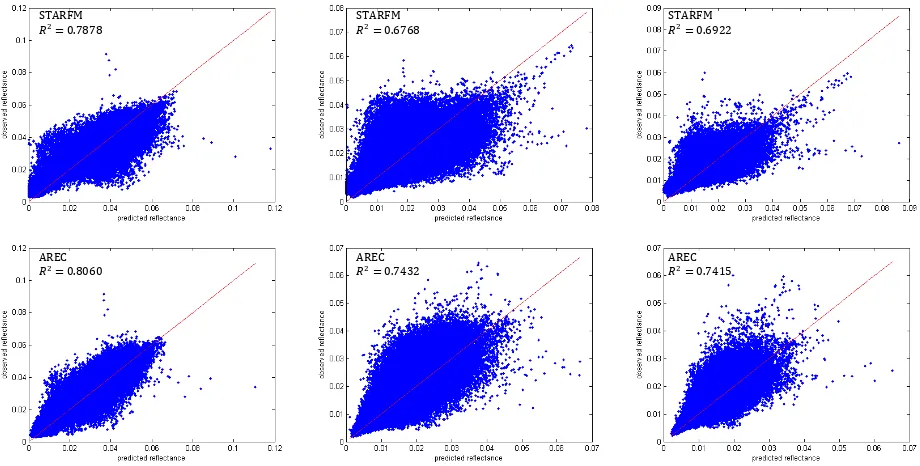
We can see from Figure 2(a) that the STARFM method could detect part of the land cover changes and preserve the high frequency information. Figure 2(b) shows that the main changes have been detected and the edges and borders are articulated. Scatter plots in Figure 3 show the relationship between the predicted and actual reflectance on 7, Nov 2002 for the three bands respectively. All the scatter points fall close to the diagonal line (1:1). Table 2 evaluates the two methods using
quality indexes, namely average absolute differences (AAD), average differences (AD), Root mean square error (RMSE),
erreur relative globale adimensionnelle de synthese (ERGAS)
(Wald, 2002) and correlation coefficient (CC) in three bands respectively. According to the above indexes, both algorithms have small difference compared with reference one, while the AREC method has a better performance and captures more type changes than STARFM (areas in yellow circles of Figure 2).
NIR band Red band Green band
ISPRS Annals of the Photogrammetry, Remote Sensing and Spatial Information Sciences, Volume III-7, 2016 XXIII ISPRS Congress, 12–19 July 2016, Prague, Czech Republic
This contribution has been peer-reviewed. The double-blind peer-review was conducted on the basis of the full paper.
Figure 3. Scatter plots of the predicted reflectance and the real one product by STARFM and AREC for NIR, Red and Green band in Shenzhen data set
Method AAD (10!!) AD (10!!)
NIR Red Green NIR Red Green
STARFM 0.37 0.32 0.25 0.14 0.02 -0.04
AREC 0.30 0.25 0.19 0.05 -0.02 -0.03
RMSE (10!!) CC
STARFM 0.52 0.50 0.37 0.8876 0.8227 0.8320
AREC 0.42 0.39 0.29 0.8978 0.8621 0.8611
ERGAS
STARFM 1.7750
AREC 1.3851
Table 2. The Shenzhen data set fusion results evaluated by objective indexes for STARFM and AREC methods
4. CONCLUSIONS
The experiment results illustrated that this method can obtain a fusion image with the high spatial resolution of ETM+ and high temporal resolution of MODIS image. While this method still have some shortcomings. The details of changed area can not be preserved as well as before. Also this method takes more time than STARFM. This problem occurs when applied into big data sets.
REFERENCES
Cliff, A.D., Ord, J.K., 1975. Space-Time Modelling with an Application to Regional Forecasting. T I Brit Geogr, pp. 119-128.
Gao, F., Masek, J., Schwaller, M., Hall, F., 2006. On the blending of the Landsat and MODIS surface reflectance:
Predicting daily Landsat surface reflectance. Ieee T Geosci Remote 44, pp. 2207-2218.
Irani, M., Peleg, S., 1991. Improving Resolution by Image Registration. Cvgip-Graph Model Im 53, pp. 231-239.
Szummer, M., Picard, R.W., 1996. Temporal texture modeling. International Conference on Image Processing, Proceedings - Vol III, pp. 823-826.
Wald, L., 2002. Data Fusion: Definitions and Architectures— Fusion of Images of Different Spatial Resolutions. Les Presses, Ecole des Mines de Paris, Paris, France.
Wang, H., Wang, J., Huang, B., 2012. Prediction for spatio-temporal models with autoregression in errors. Journal of Nonparametric Statistics 24, pp. 217-244.
STARFM �!= 0.7878
STARFM �!= 0.6768
STARFM �!= 0.6922
AREC �!= 0.8060
AREC �!= 0.7432
AREC �!= 0.7415
ISPRS Annals of the Photogrammetry, Remote Sensing and Spatial Information Sciences, Volume III-7, 2016 XXIII ISPRS Congress, 12–19 July 2016, Prague, Czech Republic
This contribution has been peer-reviewed. The double-blind peer-review was conducted on the basis of the full paper.