AGRICULTURAL LAND CLASSIFICATION BASED ON STATISTICAL ANALYSIS OF
FULL POLARIMETRIC SAR DATA
M. Mahdian a, *, S. Homayouni b, M. A. Fazel a, F. Mohammadimanesh a
a Dept. of Geomatics Engineering, College of Engineering, University of Tehran, Iran - (m.a.fazel, m.mahdian)@ut.ac.ir
b
Dept. of Geography, University of Ottawa, Canada - [email protected]
KEY WORDS: Unsupervised Classification, Expectation Maximization (EM), Polarimetric Synthetic Aperture Radar, Mellin transform, Markov Random Field (MRF)
ABSTRACT:
The discrimination capability of Polarimetric Synthetic Aperture Radar (PolSAR) data makes them a unique source of information with a significant contribution in tackling problems concerning environmental applications. One of the most important applications of these data is land cover classification of the earth surface. These data type, make more detailed classification of phenomena by using the physical parameters and scattering mechanisms. In this paper, we have proposed a contextual unsupervised classification approach for full PolSAR data, which allows the use of multiple sources of statistical evidence. Expectation-Maximization (EM) classification algorithm is basically performed to estimate land cover classes. The EM algorithm is an iterative algorithm that formalizes the problem of parameters estimation of a mixture distribution. To represent the statistical properties and integrate contextual information of the associated image data in the analysis process we used Markov random field (MRF) modelling technique. This model is developed by formulating the maximum posteriori decision rule as the minimization of suitable energy functions. For select optimum distribution which adapts the data more efficiently we used Mellin transform which is a natural analytical tool to study the distribution of products and quotients of independent random variables. Our proposed classification method is applied to a full polarimetric L-band dataset acquired from an agricultural region in Winnipeg, Canada. We evaluate the classification performance based on kappa and overall accuracies of the proposed approach and compared with other well-known classic methods.
*
Corresponding author.
1. INTRODUCTION
Polarimetric Synthetic Aperture Radar (PolSAR) data remote sensing has a significant contribution in tackling problems concerning environmental applications. It is mainly because, such data are available with any weather conditions and the useful radiometric and geometric information which these data are contained. The number of studies and applications involving polarimetric SAR data is increasing steadily (J. S. Lee and Pottier 2009). These data are formed by sending and receiving the electromagnetic signal in both horizontal and vertical polarization and thus, they may carry a larger amount of information than that available from a single band. Though there is currently no sensor operating in different bands and polarizations, studies in this area are useful. In addition, the discrimination capability of PolSAR data can make them a unique source of information. One of the most important applications of these data is land cover classification of different phenomena of the earth surface (Lim et al. 1989)(Hoekman, Vissers, and Tran 2011).
Classification of PolSAR data is an important and continually developing issue for automatic analysis of land covers mapping. Compared to single polarization measurement, more detailed classification of objects and phenomena can be expanded by using the physical parameters and scattering mechanisms (Hoekman, Vissers, and Tran 2011). Various strategies of supervised and unsupervised have been proposed for classification of optical and radar remote sensing data. Supervised methods need a priori information about the classes
of interest, while unsupervised approaches work on pixel or the feature vector directly extracted from original data with any knowledge. Although many advanced approaches have been proposed for classifying of SAR data (Alberga 2007), there is still a lack of studies concerning statistical properties of PolSAR data to be modelled for an efficient classification. Numerous classification methods have been proposed in the literature such as region based (Wu et al. 2008), thresholding methods (J.-S. Lee, Grunes, and Kwok 1994), model based segmentation (Lombardo et al. 2003), object based technique (Corr et al. 2003) and multi-resolution techniques (Benz et al. 2004).
In this study, we have proposed a contextual unsupervised classification approach for full PolSAR data, which allows the use of multiple sources of statistical evidence, i.e., the context, texture and a specific probability density function. These parameters and information can reflect the heterogeneity of the targets. Then Expectation-Maximization (EM) classification algorithm is performed to estimate the class parameters and classifying the PolSAR images. The EM algorithm is an iterative algorithm that formalizes the problem of parameters estimation of a mixture distribution (Zhang, Brady, and Smith 2001). This algorithm has three steps, first is the initialization for defining equally probable proportions. Second step is the E-STEP, which updates the posterior probabilities of each pixel and finally M-STEP updates the parameters estimation. In this research we used three different strategies to initialize the main EM classification method. Random initialization, H/alpha classification (Ferro-Famil, Pottier, and Lee 2001) map and International Archives of the Photogrammetry, Remote Sensing and Spatial Information Sciences, Volume XL-1/W3, 2013
primary classification map which produced by Mellin transform (Anfinsen and Eltoft 2011) are these initialization techniques. To represent the statistical properties and integrate contextual information of the associated image in the analysis process we used Markov random field (MRF) modelling. MRFs represent a general family of stochastic models that allow both contextual information and pixel-wise information sources to be integrated in Bayesian image processing (Li 2009). This model is developed by formulating the maximum posteriori decision rule as the minimization of suitable energy functions.
In the rest part of this paper, we first introduce EM classification method, and then principals of MRF models and Mellin transform are presented. Finally implementation of our approach on real full PolSAR data, results and discussion conclude this paper.
2. METHODOLOGHY
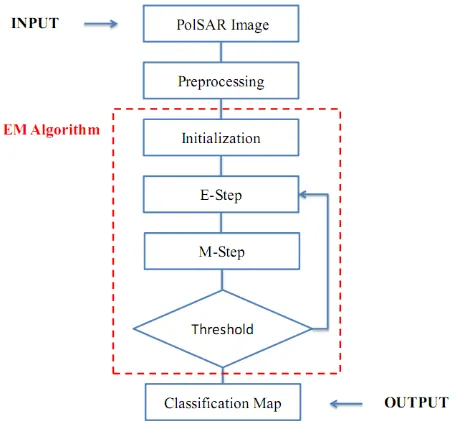
Overall flowchart of our proposed method for unsupervised classification of PolSAR data is presented in figure 1. In the continuation more details of several steps is introduced.
Figure 1. Overall flowchart for proposed unsupervised contextual classification algorithm.
2.1 EM Classification method
The EM algorithm starts with an initial segmentation with c classes and distribution parameter vector and works in an iterative manner. In each iteration, estimated parameters of current cluster are used to classify the image and the new segments are used to recompute the cluster parameters. Therefore it is necessary to consider the mixture model density function for the observation which can be formulated as:
i i
s i s r s s
i si
s f C pL i L r f C
C
f( ) ( ) ( | , ) ( |) (1)
Where p(Lsi|Lr,rs) is perior probability for the class of
pixel s, Ls noted as I while the neighbouring pixels r in the neighbourhood s are marked as Lr.
Particularly the EM algorithm has three steps (Carson et al. 2002):
a. Initialization: Initializing the parameter of class c according to the training samples. Initialization is one of the important steps of this approach because it has a certain impact on the final result. Poor initialization can converge in the local minima, and then the algorithm fails. Hence, we apply EM algorithm with three different initialization data. These initial data are random initialization, H/alpha classification maps and primary classification map which produced based on Mellin transform. In the next sections we will discuss them with details.
b. E-step: In this step, for each given observation, the posterior probabilities associated with the clusters are estimated using the current class-conditional PDF components and mixture proportions. For each pixel, the local MRF probability is calculated based on the classification result from the last iteration which updates all class parameters.
c. M-step: This step updates the distribution parameters for all the distribution models. For estimation of the texture parameters in the PolSAR distribution models, the method of matrix log-cumulant is applied (Anfinsen and Eltoft 2011). The EM algorithm sequentially repeats the E- and M-steps until the convergence point is met i.e. the percentage of pixels which are changing their classes is under a pre-set value.
2.2 Adaptive Markov Random Field
In the present paper, the method is proposed for PolSAR data classification by developing a Markovian energy function for the data statistics conditioned to each class, and an MRF model for the spatial context. To explore contextual information, MRF models are frequently used in many remote sensing applications. MRF assumes a local dependency for the spatial correlations. Under this assumption, the prior probability of a pixel s labelled as Ls considering that its neighbouring pixel r in the neighbourhood s are marked as Lr can be modelled with Gibbs law (Li 2009):
s r s
s s r
s U L L r
Z r
L L
p( | , ) 1 exp ( | , (2)
where Zs is a normalizing factor and U denotes an energy function.
2.2.1 Adaptive neighbour structures: MRF theory enables the modeling of contextual dependencies between a set of sites. These sites might be pixels in an image or individuals in a social network. First and second-order neighbourhood systems are introduced as illustrated graphically in figure 2 and 3.
Figure 2. First-order neighbourhood system and its division into cliques. The black squares represent the site of interest and the
white squares represent the neighboring sites. International Archives of the Photogrammetry, Remote Sensing and Spatial Information Sciences, Volume XL-1/W3, 2013
Figure 3. Second-order neighborhood system and its division into cliques.
To preserve the shape details from over-averaging, a finite number of the neighbour templates were given to constrain the analysis region in specific shapes as illustrated in figure 4.
Figure 4. Candidate neighbourhoods for adaptive MRF.
Specifically, the first square shape is used to analyse the homogenous area, while the linear templates are used for the boundaries and linear features. For each pixel, one candidate which has the lowest standard deviation on the span image will be selected from the five templates as pixel’s neighbourhood.
2.2.2 Adaptive energy function: The energy function U in equation (2) was modified by adding an adaptive factor bs, which is used to represent the different impact of the contextual analysis according to the homogeneities of the area:
decision and a uniform class type is most likely to be present in this area. On the other hand, in heterogeneous area the MRF has less effect and various classes will be found.2.3 Mellin transform
Analysis of the real PolSAR images shows that non-Gaussian models give a better representation of the data. Several distributions could be used to model PolSAR image texture with different spatial correlation properties and various degrees of inhomogeneity. For select optimum distribution which adapts the data more efficiently we used Mellin transform. Mellin transform is a natural analytical tool to study the distribution of products and quotients of independent random variables. The application of the Mellin transform to analysis of matrix-variate radar data builds on results in probability and the theory of statistical distributions. The separability induced by the Mellin transform and the simple expressions obtained for the Mellin kind statistics of common radar distributions such as their characteristic function, moments, cumulant and log-cumulant functions (Anfinsen and Eltoft 2011). If the product model of PolSAR data defined by Z=TW which Z, T and W are complex and positive definite Hermitian matrices. In this product model formulation T is texture and W contain speckle characteristics. By statistical analysis of product model we able to reach better distribution function which have best fitting to our data in each classes. For this purpose for simplicity of computation we do it in Mellin kind matrix log-cumulants space. In this space
several pixels with same distribution functions getting together and these log-cumulants will lead to more striking results. Second and third order log-cumulants functions defined as (Anfinsen and Eltoft 2011): are defined as(Anfinsen and Eltoft 2011):
v
3. RESULTS AND DISCUSSION
This unsupervised PolSAR classification starts with a preprocessing step for speckle reduction from data images. In the second step, the initialized values are obtained by three solution strategies (random, H/Alpha and Mellin transform). Then, the iteration procedure of E- and M-steps is performed. In the E-step pixel-wise model is combined with the MRF contextual model to take into account the spatial correlation between class labels. The classifier based on pixel statistics only, is severely affected by overlapping class statistics due to speckle noise. This problem is reduced by incorporating spatial contextual information. The EM algorithm is modified to include the contextual energy in the calculation of the posterior probabilities, and also, the spatial interaction parameter of the MRF model β is estimated in the iteration process. The final classification map is obtained when the algorithm satisfy the statistical threshold.
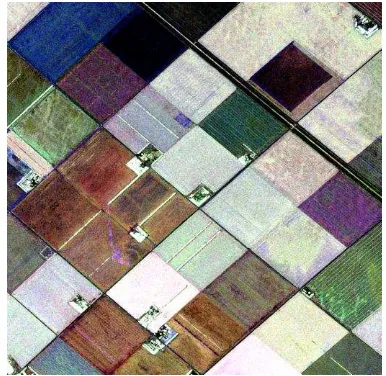
The proposed algorithm has applied to a L-band PolSAR data sets, acquired by the UAVSAR over an agricultural area in Winnipeg, Canada. This area consists of a rich variety of annual crops including cereals, wheat, oilseeds, soybeans, corn, and pasture/forage. The images have been acquired in 5 July 2012 and are in multi look stokes matrix format. Figure 5 shows a 512×512 subsample of pauli decomposition which is used in this research.
Figure 5. Pauli decomposition sub-sample images acquired in 5 July 2012.
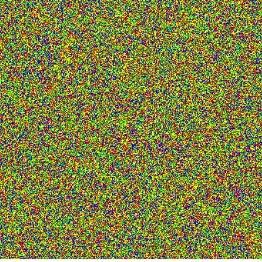
To initialize the algorithm, first the image is randomly partitioned into a given number of segments. Figure 6 shows a random image used in this step.
Figure 6. Random initialization of proposed method.
Second method for initialization is based on H/alpha classification map. Entropy and alpha parameters of selected sub-sample are shown in figure 7.
Figure 7. alpha (a) and entropy (b) parameters for selected sub-set of PolSAR data.
Third strategy for initialization stage is a classification map generated based on Mellin transform. By separating different distribution functions of several classes based on Mellin transform we can reach a primary classification map. For this reason we present data in log-cumulant variable space. In this space, for each pixel the values of K2 and K3 are computed. This work helps to reach proper separation between several classes and distribution functions. Figure 8 illustrate log-cumulant diagram of used data.
Figure 8. The matrix log-cumulant diagrams.
Final result of proposed approach for unsupervised classification is presented as in figure 9.
Figure 9. Final classification map produced with proposed method.
This visual result show efficient performance of proposed approach for unsupervised PolSAR classification and boundaries of classes are detected properly. For the quantitative validation of presented approach 50 pixels are used to evaluate the confusion matrices, kappa coefficient and overall accuracy. These data have been uniformly selected from several classes. Table 1 shows quantitative comparison between the results of our approach with different initialization strategies and Wishart classification method.
Table 1. Quantitative comparison of the results.
In this table, overall accuracy and kappa coefficient show improvement of the proposed method by using Mellin transform for initialization stage. It is also clear even by random initialization the algorithm is able to reach acceptable results. Also the comparison of the Mellin-based initialized results with other well-known unsupervised algorithm is shown in figure 10.
Figure 10. Comparison between kappa and accuracy of unsupervised classification algorithms Method/
Accuracy Sigma
2
Kappa Overall Accuray (%)
Wishart method 3.87e-6 0.8721 89.13
Proposed Random 1.96e-6 0.8734 89.49
Proposed H/alpha 8.34e-7 0.9269 92.76
Proposed Mellin 2.59e-7 0.9755 98.02 International Archives of the Photogrammetry, Remote Sensing and Spatial Information Sciences, Volume XL-1/W3, 2013
4. CONCLUSION
In this paper a statistical approach is presented to unsupervised classification of PolSAR data images. This method by concerning contextual characteristics of PolSAR data, and using several strategies to initialize EM classification method leads to more reliable results. The importance of contextual analysis is revealed in the unsupervised classification using high resolution PolSAR data. Contextual analysis which is arrived by MRF has an important role for correct image modeling in classification. But the classical MRF’s energy function cannot involve relationship between pixels in PolSAR data in a neighboring system. For solving this problem, in this paper an adaptive energy function is presented which have a better contextual smoothing outcome. The quantitative comparison of the results emphasizes the efficiency of the proposed approach and the results demonstrate that developed unsupervised technique can be efficiently applied to PolSAR images from agricultural land and even urban area. The best results are achieved using Mellin-based initialization with contextual EM method and adaptive MRF. The proposed approach is able to produce homogenous mapping results with high accuracy and resulted classification map can be used in several applications of radar remote sensing.
ACKNOWLEDGMENT
The authors acknowledge NASA/JPL-Caltech for UAVSAR data over the SMAPVEX12 area in Winnipeg, MN, Canada, and Dr. H. McNairn from Agriculture and Agri-Food Canada for her helpful support and useful discussion.
References:
Alberga, V. 2007. “A Study of Land Cover Classification Using Polarimetric SAR Parameters.” International Journal of Remote Sensing 28 (17): 3851–3870.
Anfinsen, Stian Normann, and Torbjørn Eltoft. 2011. “Application of the Matrix-variate Mellin Transform to Analysis of Polarimetric Radar Images.” Geoscience and Remote Sensing, IEEE Transactions On 49 (6): 2281–2295.
Benz, Ursula C., Peter Hofmann, Gregor Willhauck, Iris Lingenfelder, and Markus Heynen. 2004. “Multi -resolution, Object-oriented Fuzzy Analysis of Remote Sensing Data for GIS-ready Information.” ISPRS Journal of Photogrammetry and Remote Sensing 58 (3): 239–258.
Carson, Chad, Serge Belongie, Hayit Greenspan, and Jitendra Malik. 2002. “Blobworld: Image Segmentation Using Expectation-maximization and Its Application to Image Querying.” Pattern Analysis and Machine Intelligence, IEEE Transactions On 24 (8): 1026– 1038.
Corr, D. G., A. Walker, U. Benz, I. Lingenfelder, and A. Rodrigues. 2003. “Classification of Urban SAR Imagery Using Object Oriented Techniques.” In Geoscience and Remote Sensing Symposium, 2003.
IGARSS’03. Proceedings. 2003 IEEE International, 1:188–190.
http://ieeexplore.ieee.org/xpls/abs_all.jsp?arnumber= 1293719.
Ferro-Famil, Laurent, Eric Pottier, and Jong-Sen Lee. 2001. “Unsupervised Classification of Multifrequency and Fully Polarimetric SAR Images Based on the H/A/Alpha-Wishart Classifier.” Geoscience and
Remote Sensing, IEEE Transactions On 39 (11): 2332–2342.
Hoekman, Dirk H., Martin AM Vissers, and Thanh N. Tran. 2011. “Unsupervised Full-polarimetric SAR Data Segmentation as a Tool for Classification of Agricultural Areas.” Selected Topics in Applied Earth Observations and Remote Sensing, IEEE Journal Of 4 (2): 402–411.
Lee, J. S., and E. Pottier. 2009. Polarimetric Radar Imaging: From Basics to Applications. Vol. 142. CRC. Lee, Jong-Sen, Mitchell R. Grunes, and R. Kwok. 1994.
“Classification of Multi-look Polarimetric SAR Imagery Based on Complex Wishart Distribution.” International Journal of Remote Sensing 15 (11): 2299–2311.
Li, Stan Z. 2009. Markov Random Field Modeling in Image Analysis. Springer.
Lim, H. H., A. A. Swartz, H. A. Yueh, Jin Au Kong, R. T. Shin, and J. J. Zyl. 1989. “Classification of Earth Terrain Using Polarimetric Synthetic Aperture Radar Images.” Journal of Geophysical Research: Solid Earth (1978–2012) 94 (B6): 7049–7057.
Lombardo, Pierfrancesco, Massimo Sciotti, Tiziana Macrí Pellizzeri, and Marco Meloni. 2003. “Optimum Model-based Segmentation Techniques for Multifrequency Polarimetric SAR Images of Urban Areas.” Geoscience and Remote Sensing, IEEE Transactions On 41 (9): 1959–1975.
Zhang, Yongyue, Michael Brady, and Stephen Smith. 2001. “Segmentation of Brain MR Images through a Hidden Markov Random Field Model and the Expectation-maximization Algorithm.” Medical Imaging, IEEE Transactions On 20 (1): 45–57.