SIMULATION STUDY ON THE EFFECT OF SAND DIGGING AND HEAPING ON SAR
IMAGING IN THE PEARL RIVER ESTUARY
X. Wang a, H. Zhang a, *, B. Fu a, W. Guan a and A. Shi a
a
State Key Laboratory of Satellite Ocean Environment Dynamic, Second Institute of Oceanography, State Oceanic
Administration, Hangzhou,310012,China; E-Mails: [email protected]; [email protected]; [email protected];
[email protected]; [email protected]
KEY WORDS: Simulation, SAR imaging, Sand digging and heaping, The Pearl River Estuary
ABSTRACT:
There are frequent sand digging and heaping activities in shoal in the Pearl River Estuary (PRE). Water depth has changed in patches, which can be imaged by synthetic aperture radar (SAR). According to SAR imaging mechanism of underwater bathymetry, a 3-D hydrodynamic model is used to demonstrate the temporal variations of the shoal topography changes due to sand digging and heaping. A microwave radar imaging of oceanic surface’s program is used to simulate the variation of normalized radar cross section (NRCS) induced by the ocean surface current. The simulation is carried out to study the digging-heaping shape, water depth changes on SAR imaging of shoal bathymetry. Results indicate several points as followings. 1. Circle-shaped sand digging and heaping are imaged clearer by SAR than other shapes. 2. Sand heaping has a greater effect on SAR imaging than sand digging. 3. Bigger depth change induces bigger NRCS variation.
* Corresponding author. E-Mail:[email protected];Tel:+86-571-81963111; Fax: 86-571-88839374. 1. INTRODUCTION
Since the 1980s, with the economic booming in China, there has been great demand of sand for the infrastructure. A large amount of sand is being minded across most rivers in China regions with the largest scale of such activity in the middle and lower reaches of the Yangtze River, the Pearl River Delta, and the adjacent estuarine areas (Jia et al, 2007).Illegal and disordered sand dredging has induced a lot of problems such as fall of water level, serious riverbed deformation as well as turbulent currents in waterways, and then the security of flood control and stabilization of river regime is badly influenced (Xie, 2007; Han et al., 2005). Also, the deterioration of ecological environment in these estuarine areas has something to do with the frequent sand excavation activities (Liu et al., 2006). Thus, the sand excavation has been the focal points of the academic research since the 1990s.
With the rapid population growth and economic development, the Pearl River Delta is the area with the highest urbanization development level. The Pearl River Estuary (PRE), located at the middle south of Guangdong Province, is a bell-shaped estuary with a north-south direction. The shoal alternates with the deep trough within the bay. From west to east, there are the west shoal, the Lingding Channel, the middle shoal (Fanshi shoal), the Fanshi Channel and the east shoal (Chen et al., 2011). There are plenty of sand resources in channels and shoals in the PRE, which can supply raw materials for construction.The sand excavation has a long history in the PRE. There are two kinds of large-scale dredging activities, one is reclamation for construction, and the other is channel dredging (Liu et al., 2005).
Water depth has changed in patches in the shoals of PRE, which can be imaged by synthetic aperture radar (SAR).
Fanshi shoal, the important dredging area, also the mud dumping area of Lingding Channel, has tremendous sand digging and heaping activities. So this paper takes the Fanshi shoal as a case to simulate the sand excavation including sand digging and sand heaping by using hydrodynamic model and SAR remote sensing methods.
2 STUDY AREA AND DATA
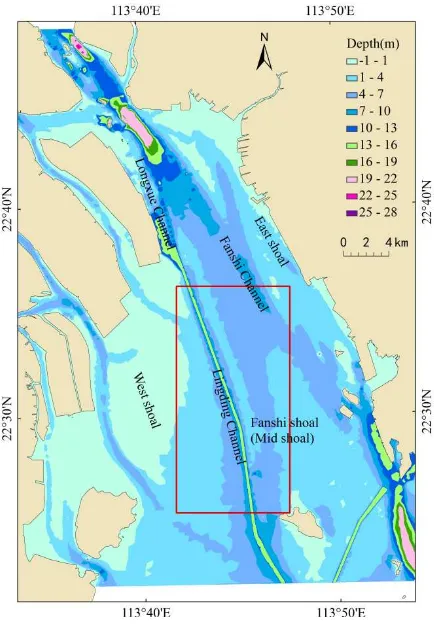
Figure.1 SAR image and study area (in red rectangle) International Archives of the Photogrammetry, Remote Sensing and Spatial Information Sciences,
A stretch of the Lingding Channel and Fanshi Shoal are selected as our study area. The longitude ranges from
113
°
41'37"E to 114
°
47'32"E
, and the latitude ranges from22
°
25'21"N
to22
°
36'5"N
.We collect one Terra SAR-X image of 2010-10-30 (Fig. 1), which was geometric corrected and registered based on SPOT5 fusion images of snapshot of the PRE around the year 2005, which had been registered and had 2.5-m resolution.
There are two depth data of the PRE, one is from a temporal nautical chart, which was published in 2008 by the Chinese Navy Press (Fig.2), and the other is from field collection which was obtained by single-beam echo sounder in 2012.
By scanning the nautical chart and geometrically correcting it, the data was vectorized. Then, it was registered to acquire bathymetric contour and sounding points. The scattered set of points was interpolated using Kriging interpolation method to reconstruct the Digital Elevation Model (DEM) of our study area (Fig.2).
Figure.2 Digital Elevation Model of the PRE (Study area is in red rectangle)
3 METHODS
3.1 SAR imaging mechanism of underwater bathymetry
SAR cannot directly view underwater bathymetry. It images the bottom topography via surface effects induced by tidal flow variation over bottom topography under favorable meteorological and hydrodynamic conditions (wind
conditions 3~ 10 m/ s, tidal current velocity > 0. 5 m/ s) (Jackson and Apel, 2004; Fu, 2005). It is generally accepted that the imaging mechanism of mapping shallow water bathymetry by SAR consists of three stages (Alpers and Hennings, 1984; Cooper and Chubb, 1994).
Firstly, the interaction between tidal flow and bottom topography results in the modulation of surface flow velocity.
Secondly, the modulation by surface flow velocity causes variations of the surface wave spectrum.
Finally the variation of the surface spectrum causes modulation in the level of radar back scatter (Fan et al, 2007).
The radar imaging mechanism of an underwater topographic feature (sand wave) is depicted schematically in Fig. 3 (Alpers and Hennings,1984; Shuchman et al., 1985; Vogelzang, 1997). The tidal current is modified by the variable water depth as indicated by the arrows. The current velocity at the sea surface is higher over shallow areas than over deep areas, giving rise to convergent flow regimes where the sea surface roughness is increased and to divergent flow regimes where roughness is decreased. In the convergent areas, the waves are "squeezed", while in the divergent areas they are "stretched". This leads in the convergent areas to an increase of the amplitude of the Bragg waves responsible for the radar backscattering and thus to an increase of the backscattered radar power; in the divergent areas it leads to a decrease in Bragg wave amplitude. Therefore on radar images the convergent areas appear as areas of enhanced image intensity and the divergent areas as areas of reduced image intensity. In most cases, the surface current is a tidal current. The strongest modulation of the sea surface roughness and thus the strongest variation of the backscattered radar signal is obtained when the tidal velocity is at its peak value. At slack tide, when the tidal velocity is zero, no topographic features can be delineated on radar images.
Figure.3 SAR imaging mechanism of underwater topography
3.2 Model and software used
According to SAR imaging mechanism of underwater bathymetry, A 3-D hydrodynamic model for the PRE has been developed based on a semi-implicit Eulerian-Lagrangian finite-element model (Zhang et al., 2008) to demonstrate the temporal variations of the current changes due to sand digging and heaping. A software toolkit called M4S for numerical simulations of the microwave radar imaging of oceanic surface is used to simulate the variation of normalized radar cross section (NRCS) induced by the ocean surface current, for the current features near the ocean International Archives of the Photogrammetry, Remote Sensing and Spatial Information Sciences,
surface can cause signatures in radar images via hydrodynamic and aerodynamic modulation of the surface wave spectrum. (Romeiser, 2005)
3.2.1 Parameters in the 3-D hydrodynamic model: The simulation time of current of the PRE is the same as the acquisition time of the Terra SAR-X image used in this paper. The input water depth is the field data obtained in 2012.
3.2.2 Parameters in M4S programs: in the computation of spatially varying wave spectra, a limited quadratic source function, the RA surface wave spectrum (Romeiser & Alperse, 1997) and Plant relaxation rate (Plant, 1982) had been chosen. Based on the parameters of the Terra SAR-X images used in this study, the other parameters input in the computation of radar signatures are as follow: the incident angle is 21.3°, the radar frequency is 9.65 GHz, the
radar polarization is VV, the platform altitude is 514.8km, and the platform velocity is 7km/s. The composite surface model was chosen as the radar cross section mode (Romeiser & Alpers, 1997)
3.3 The simulation scheme
The simulation is carried out to study the digging-heaping shape, water depth changes on SAR imaging of shoal bathymetry.
Figure.4 Sand digging and heaping area (the color-labeled place)
3.3.1 Simulation of different shapes: five different shapes are considered in the simulation: circle, ellipse in two directions (N-S direction and W-E direction) and rectangle in two directions (N-S direction and W-E direction). According to the real sand excavation activities in location A (see Fig.1 b), the parameters of the five shapes are set as follows: the diameter of the circle is 1km, the major axis and minor axis of both ellipses are 1km and 0.5 km separately, and the length and width of both rectangles are 1 km and 0.5 km
separately. The average depth in the excavation area is about 5m. So the depth of sand excavation in these five shapes is set as 9m, namely this simulation is actually under the case of sand digging.
3.3.2 Simulation of different depths: The depth of sand digging is defined between 6 m to 11 m with a change interval of every meter while that of sand stacking is defined between 3m to 5.5m with a change interval of every half meter.
4 RESULTS AND DISCUSSION
A relative normalized radar backscattering cross section (NRCS) has been defined as Δσ0 = ︱σ0 - σ0
0
︱, σ0
is the SAR NRCS of underwater bathymetry, whileσ0
0 is the SAR NRCS in the ambient field without current filed modulation. Δσ0 can demonstrate the clarity of the dark
and bright streaks in the SAR imaging of underwater bathymetry. SBD (dB) is the absolute value of the difference value of the dark and bright streaks which can reflect the imaging capability of SAR underwater bathymetry (Fan et al, 2007).
Fig.4 shows that the Δ σ0 of circle-shaped sand
digging is bigger than others, while there is no significant difference between ellipse-shaped and rectangle-shaped sand digging. Also, with the same shape, theΔ σ0 in W-E
direction is bigger than that of N-S direction, we suppose this has something to do with the current direction in this area, which is N-S direction in the acquisition time of the Terra SAR-X used in our study .
Figure.5 The relative NRCS of sand digging under different shapes along the white solid line in Fig.4, the profiles of sand
digging area are between two black solid line.
A circle-shaped sand heaping with a depth of 3m has been carried out, to compare with the circle-shaped sand digging, as mentioned before, whose depth is 9m. The result shows that, when the depth changes 2m (from 5m to 3m), the SBD of sand heaping is 0.6dB, which is equivalent to a average variation of 0.3 dB per meter; when the depth changes 6m (from 5m to 11m), the SBD of sand digging is 0.2 dB, which is equivalent to a average variation of 1/30 dB per meter. Namely, the SBD of sand heaping is bigger than that of sand digging, which means sand heaping has a greater imaging effect by SAR than sand digging. The light streak appears in the left of the sand heaping area, while the dark streak appears in the right, which is contrary to the case of the sand digging (see Fig.6).
Figure.6 The relative NRCS of sand heaping and digging along the white solid line in Fig.4, the profiles of sand digging and heaping area are between two black solid line.
The simulation images of the real topography and sand digging and heaping show similar results. Changes on underwater topography can be clearly reflected by SAR, there are light and dark streaks around the sand digging and heaping area. For sand heaping, the light streaks are located in the NE-SW direction, while the dark steaks are located NW-SE direction, which is contrary to the case of the sand digging. We suppose the directions of light and dark streaks are also related to the tidal flow direction in the study area (see Fig.7).
Figure.7 The simulation images of: Left: sand heaping; Mid: real topography; Right: sand digging.
As Fig. 8 shows, the bigger depth change compared with base depth of 5m, the biggerΔσ0 of sand digging in SAR
image, for example, theΔσ0 of 11m is 0.25 dB, while theΔ
σ0 of 6m is less than 0.1 dB. So it is with sand heaping (see
Fig.9). That means bigger depth change induces bigger NRCS variation.
Figure.8 The relative NRCS of sand digging under different depths along the white solid line in Fig.4, the profiles of sand
digging area are between two black solid line.
Figure.9 The relative NRCS of sand heaping under different depths along the white solid line in Fig.4, the profiles of sand
heaping area are between two black solid line.
5 CONCLUSIONS
Results indicate several points as followings.
(1) Circle-shaped sand digging and heaping are imaged clearer by SAR than other shapes.
(2) Sand heaping has a greater effect on SAR imaging than sand digging. The profile images shows that the light streak appears in the left of the sand heaping area, while the dark streak appears in the right, which is contrary to the case of the sand digging. Similar results are derived from the simulation images. Also, we suppose the directions of light and dark streaks are also related to the tidal flow direction in the study area.
(3) Bigger depth change induces bigger NRCS variation, which is suitable in the cases of both sand heaping and digging.
REFRENCES
Jia,L., Luo, Z., Yang, Q., Ou, S., and Lei, Y., 2007. Impacts of the large amount of sand mining on riverbed morphology and tidal dynamics in lower reaches and delta of the Dongjiang River. Journal of Geographical Sciences, 17(2), pp. 197-211.
Xie, Z., 2007. Research on the effects of sand mining at river course by 2D curvilinear flow and sediment mathematical model. Proceedings of the 20th conference on hydrodynamics. pp. 748-757.
Han, L., Li, W., Lu, Y., et al. 2005. Impact of artificial sand excavation on hydrodynamics and water environment of Dongjiang River network. Journal of Hohai University: Natural Sciences, 33(2), pp.123-126.
Liu, R., Qian, Z., Zhao, Z., 2006. Study on the situation of sand-gravel extraction in the river channel. Journal of Chongqing Jiaotong University, 25(2), pp. 146-149.
Chen, B., Zhang, Y., Chen, X., Wang, Z., Yang, G., 2011. The characteristic of marine environment in Lingding Esruary. Chinese Geographical Science, 11(2), pp. 155-162.
Liu, J., Xu, F., 2005.Analysis of numerical medeling of effects of sand borrowing in Nansha Harbor waters on the operation of the harbor. Pearl River, 3, pp. 17-21.
Jackson, C. R. and Apel, 2004. Synthetic Aperture Radar Marine User’s Manual , Natl. Environ. Satell. Data and Inf. Serv., Nalt. Oceanic and atmos. admin. . Silver Spring, pp.245~ 262.
Fu, B., 2005. Shallow water bottom topography by mapping SAR, PhD thesis. Ocean University of China. ( in Chinese)
Alpers, W. and Hennings, I., 1984. A theory of the imaging mechanism of underwater bottom topography by real and synthetic aperture radar, J. Geophys. Res., 89, pp.10529- 10546.
Cooper, A. L. and Chubb, S. R., 1994. Radar surfaces signature for the two-dimensional tidal circulation over Phelps Bank, Nantucket shoals: a comparison between theory and experiment, J. Geophys. Res., 99(C4), pp. 7865-7883.
Fan, K., Huang, W., He, M., and Fu B., 2007. A review about SAR technique for shallow water bathymetry surveys. China Ocean Engineering, 4, pp. 015.
Shuchman, R. A., Lyzenga, D. R. and Meadows, G. A. 1985. Synthetic aperture radar imaging of ocean-bottom topography via tidal-current interactions: Theory and observations. Int. J. Remote Sens., 6, pp. 1179–1200
Vogelzang, J., 1997. Mapping submarine sand waves with multi-band imaging radar, 1. Model development and sensitivity analysis. J. Geophys. Res., 102, pp. 1163–1181.
Zhang, Y., and Baptista, A. M. 2008. SELFE: a semi-implicit Eulerian–Lagrangian finite-element model for cross-scale ocean circulation. Ocean Modelling, 21(3), pp. 1-96.
Romeiser R. USER'S of M4S Manual. July 2005, 1:31
Romeiser, R., Alpers, W., and Wismann, V. 1997. An improved composite surface model for the radar backscattering cross section of the ocean surface: 1. Theory of the model and optimization/validation by scatterometer
data. Journal of Geophysical Research: Oceans (1978–2012), 102(C11), pp. 25237-25250.
ACKNOWLEDGEMETNS
The authors acknowledge the Marine Scientific Public Welfare Research Special Foundation (No. 201105001) for funding this work. The authors would also like to thank Dr. Roland Romeiser from University of Hamburg, Germany for providing the M4S (version 3.2) and his direction on the use of the model and software separately.