HYDROLOGIC ANALYSIS OF A FLOOD BASED ON A NEW DIGITAL ELEVATION
MODEL
M. Nishio a, M. Mori b, *
a
Graduate School of Humanity-Oriented Science and Engineering, Kinki University, 8208555 Iizuka city, Fukuoka, Japan - [email protected]
b
Dept. of Information Science, School of Humanity-Oriented Science and Engineering, Kinki University, 8208555 Iizuka city, Fukuoka, Japan – [email protected]
Commission VI, WG VI/4
KEY WORDS: Hydrologic analysis, DEM, GIS, HEC-HMS, Flood, Natural disaster
ABSTRACT:
These The present study aims to simulate the hydrologic processes of a flood, based on a new, highly accurate Digital Elevation Model (DEM). The DEM is provided by the Ministry of Land, Infrastructure, Transport and Tourism (MLIT) of Japan, and has a spatial resolution of five meters. It was generated by the new National Project in 2012. The Hydrologic Engineering Center - Hydrologic Modeling System (HEC-HMS) is used to simulate the hydrologic process of a flood of the Onga River in Iizuka City, Japan. A large flood event in the typhoon season in 2003 caused serious damage around the Iizuka City area. Precise records of rainfall data from the Automated Meteorological Data Acquisition System (AMeDAS) were input into the HEC-HMS. The estimated flood area of the simulation results by HEC-HMS was identical to the observed flood area. A watershed aggregation map is also generated by HEC-HMS around the Onga River.
1. INTRODUCTION
Disasters such as floods in the typhoon season cause severe damage in Japan every year (Chan, 2013). Localized heavy rain has increased in recent years. A large flood event occurred on July 19, 2003, around the Onga River in Iizuka City, Japan. At this time, the flood area was not estimated.
The hydrologic processes of a flood are simulated by the Hydrologic Engineering Center - Hydrologic Modeling System (HEC-HMS) (USACE, 2010) to estimate the flood area depending on rainfall. A Digital Elevation Model (DEM) is quite important for estimating hydrologic processes. In the present study, a highly accurate DEM provided by the Ministry of Land, Infrastructure, Transport and Tourism (MLIT) of Japan is used. It has a spatial resolution of five meters, and was generated by the new National Project in 2012 (Mori, 2011).
1.1 Content of the DEM
The MLIT of Japan has started to provide a new DEM to users in 2012, with a spatial resolution of 5 meters and covering almost 70% of the land of Japan. The spatial resolution of the DEM is quite accurate. The digital elevation data is obtained by a laser profiler system. The accuracy of the height of every one point of the laser instrumentation and measurement point in the Airlines laser measurement is ±15cm. The 5m meshes (altitude) assume the height of the laser instrumentation and measurement point included in the mesh of 5m. To decide the height of the center according to the TIN method on the average, the limitation of the accuracy of height is assumed by a standard deviation of 30cm. A 5m mesh (altitude) is made which removes the measurement point data such as buildings and trees. Figure 1 is a structure of 5m mesh (altitude). Thus, heights are shown on a 5m mesh (grid). The data values of these heights are in 10cm units. For instance, "25" indicates
the value 2m50cm. It has become highly accurate compared with past aerial photogrammetry. This altitude data is based on rectangular plane of the world land surveying system. There are steep geographical features in Japan, so an accurate DEM is needed for the hydrologic analysis of a flood.
m m
8 8 8 8 8 8 8 8
Figure 1. Structure of 5m mesh (altitude)
1.2 DEM format
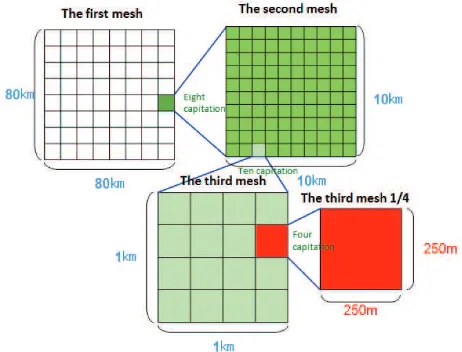
The digital elevation model 5m mesh data offered from MLIT of Japan is in units of the third mesh. The download data is in units of the second mesh. As for the standardized regional mesh, it is provided from the 1st mesh to the 3rd mesh in Japan. Figure 2 shows the area-wide mesh structure.
Figure 2. Mesh structure
Class name Attribute Tag name
FGD Feature - FGDFeature
Geodetic Control Point - GCP
Position pos
Table 1. Allocation of tag name (XML format)
The third order grid unit has divisions based on the first mesh (regional division). In this grid, the first mesh divides latitude in the spacing for 40 minutes, and the longitude was divided into the spacing once. The length of about one of the first division of the mesh is about 80km. The division that is eight capitation of the first mesh to length and breadth becomes a phase two mesh. The second meshes correspond to the division of chart 1 leaf of 1/25,000 topography. The length of one of the second division of the mesh is about 10km. The third divisions that are ten capitations of the second meshes to length and breadth become the meshes. In addition, districts that can be done by dividing the third meshes equally to length and breadth four are 1/4 area-wide meshes.
This Japan Profile for Geographic Information Standards (JPGIS) provides the specification of geospatial data based on the international standard of ISO. The standards of the International Organization for Standardization were revised in 2011, and encoding geospatial data as a rule by the GML format became international standards. As a rule, the offered data is GML format. Moreover, basic map information XML schema definition file is JPGIS-2014(GML) format. Basic map information (digital elevation model) is data by the latitude and longitude coordinates. This data is the mesh data to which the difference of longitude and the difference of latitude were delimited for 0.2 seconds by spacing (5m spacing). The first cell is a northwest edge. First of all, it advances it in the direction of a positive value of the x axis (west → the east). Next, when it reaches the eastern edge, it advances it in the direction of a negative value of the y axis (north → the south). Processing is ended on the southeast edge.
The format of the DEM is XML rather than binary format, so it is quite convenient to convert to various GIS software formats. In the present study, the original five-meter DEM file is not compatible with HEC-HMS format, so it is necessary to convert the DEM file to HEC-HMS format. Table 1 shows the structure of XML of the DEM file of MLIT.
DEM File
Figure 3. DEM file conversion
We developed software that converted the DEM file of MLIT into shapefile and GoeTIFF by using C language and API. The software that we developed can convert two or more DEM files into shapefile and GoeTIFF in bulk. Figure 3 shows the flow of the DEM file conversion. Figure 4 shows 5mDEM file format (GML). The data of the mesh code and the altitude is extracted from among the DEM file (GML form) in the beginning. Next, the positional information is calculated from the extracted mesh
code. Data is converted into shapefile, repeating this processing. Various free software (OS, OpenSouce software, API, and C library, etc.) was used for the software that we newly developed. Moreover, the DEM file is converted into Shapefile and GeoTIFF, and can be easily integrated into general-purpose GIS, etc. Figure 5 converts 5mDEM into Shapefile, and shows the result of integration into GIS.
Figure 4. 5mDEM file format (GML)
Figure 5. MLIT 5mDEM File
2. HYDROLOGIC ANALYSIS OF A FLOOD
2.1 Input data for hydrologic analysis
Several input data files are necessary for hydrologic analysis: DEM, rainfall records, land use/cover, soil types, and channels/streams. Precise records of rainfall data by the Automated Meteorological Data Acquisition System (AMeDAS) are used for HEC-HMS, the gauging stations of which are located every 17 km throughout Japan. The AMeDAS rainfall data of the Japan Meteorological Agency (JMA) is measured every 10 minutes.
Figure 6 shows the system configuration to accumulate the AMeDAS rainfall data. The original AMeDAS data is formatted in binary code, which is in a special and uncommon format. First of all, software was developed to convert this AMeDAS data format into new JMA XML data by using Java and C language. The positional information of the observatory, rainfall, and information such as dates are extracted from the AMeDAS binary data. Precipitation information is accumulated in the database. Information can be easily extracted by specifying the observatory and the date from the accumulating data base. Moreover, the system that we developed corresponds to accumulation rainfall information. Precipitation information is converted into XML format, and a shapefile is made based on the data. Figure 7 shows the flow of the AMeDAS data format conversion processing.
MLIT
Figure 6. System configuration
AMeDAS XML format data is integrated with XML data, and the compound data is converted to shapefile format for GIS analysis. Figure 8 shows the result of integrating the AMeDAS data into GIS.
Figure 7. Flow of AMeDAS data format conversion processing
Figure 8. AMeDAS rainfall information
The records of rainfall by AMeDAS are calibrated and validated with another gauging station at the Onga River Observatory by the MLIT.
The land use/cover and soil type maps for Japan are provided by the Geographical Survey Institute of Japan (GSIJ). Also, basic channel data is provided in the Digital Basic Information Map by the GSIJ, which is inaccurate for hydrologic analysis. Accordingly, precise channels/streams are generated by a Geographic Information System (GIS) based on the new DEM.
2.2 Hydrologic analysis
The hydrologic processes of the flood are simulated by HEC-HMS ver.4.0. HEC-HEC-HMS is one of the most powerful tools applied to hydrologic analysis (Yang, 2005). All the input data are carefully prepared and input into HEC-HMS. HEC-HMS is strongly associated with ArcGIS 10.1. Moreover, ArcGIS and free GIS software (GRASS GIS, etc.) can add an excellent analysis feature and an external extension tool. Figure 9 shows the flow of the data of the hydrologic analysis. Data necessary for the floodwater hydrological analysis is made by using GIS etc.
Geographic information system GIS Basin
Watershed analysis
Figure 9. Flow of hydrologic analysis data
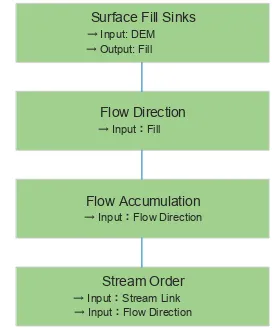
First of all, we used open source GIS, and tested the hydrologic analysis simulation (Flow Accumulation and Watershed). Figure 10 shows the flow of the processing of the hydrologic analysis simulation. Highly accurate Digital Elevation Model (5mDEM) of new MLIT was used for the simulation. Figure 11 shows the result of integrating highly accurate Digital Elevation Model (5mDEM) into GIS.
Surface Fill Sinks
→ Input:Flow Direction
Stream Order → Input:Stream Link → Input:Flow Direction
Figure 10. Flow of hydrologic analysis using GIS
Figure 11. DEM map data
In GIS (ArcGIS, GRASS GIS, etc.), a basic function concerning the hydrologic analysis (analyses such as the current direction, inclinations, and valley fields) is provided by using the DEM data. The hydrologic response of the valley that can be put on the rainfall changes greatly in geographical features (slope gradient) and the watercourse (geological features). River management is provided by national and local government organizations; these organizations provide the standard of each river when the rainfall that falls in the valley flows to and reaches the river.
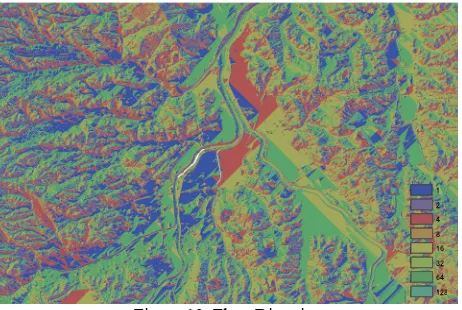
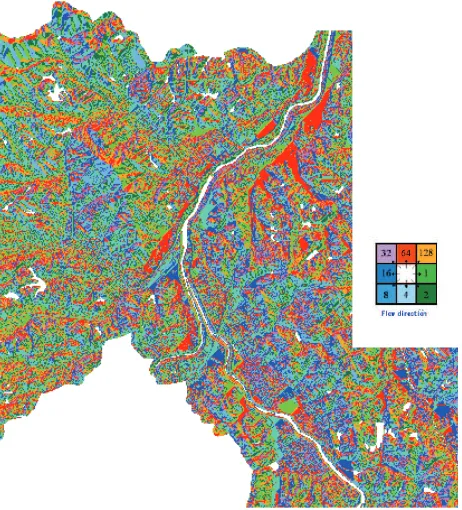
The runoff analysis is done by using topographical information (5mDEM). The direction of current can be analysed by using 5mDEM. The current direction grid from which the direction where each mesh flowed out was requested from DEM that removed the hollow; this was made by using Flow Direction. Figure 12 shows the direction value of the current direction. The direction of current can be analysed by using 5mDEM. Figure 13 shows analytical result (Flow Direction) of the current direction lusterware.
1 = east, 2 = southeast, 4 = south, 8 = southwest, 16 = west, 32 = northwest, 64 = north, 128 = northeast.
64
4 1 128
16
8 2
32
Figure 12. Direction value of current direction
In addition, Flow Accumulation was used to create the accumulation flowing quantity grid from which the number of meshes (accumulation flowing quantity) flowed from the current direction grid into each mesh. The accumulation flowing quantity of the river was analysed from the accumulation flowing quantity grid.
Figure 13. Flow Direction
8 6
6 8
Figure 14 shows the analytical result of Flow Accumulation.
Figure 14. Flow Accumulation
Next, usage of disaster prevention information is tested, and hydrologic analysis software HEC-HMS is looked at. A local municipality has the obligation to make a plan concerning disaster prevention, as part of the region of the municipality; this plan protects the lives, health and property of the residents of that municipality from disasters, and it is executed in conformance with the Disaster Countermeasures Basic Act. The mayor of municipality must inform the residents in the region, especially when a disaster might occur, and is provided with the authority to officially announce evacuation orders, etc. The municipality finds the districts corresponding to the disaster type that can happen when danger arises where a natural hazard is generated, and officially announces the evacuation order, etc.
Moreover, it is necessary to prepare evacuation shelters for two or more flood damage disasters, landslide disasters, etc., according to the region, and it is necessary to take shelter according to the risk of each disaster. It assumes generation by rainfall in which the flooding from two or more rivers is the same, and the evacuation behaviour is taken based on one river with a large flood.
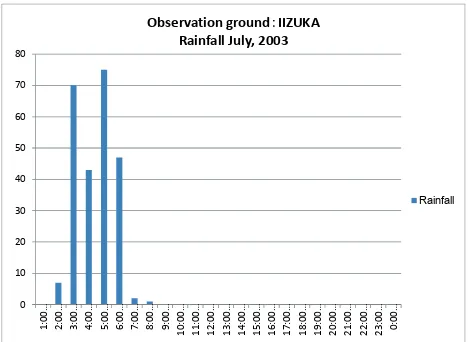
The input data used with HEC-HMS was made by using ArcGIS. The valley is simulated, and its catches and rainfall-runoff process from the upstream to the downstream can be simulated with a system on the tree in which two or more catchment areas gather. Figure 15 shows the catchment area analysed with HEC-HMS. Moreover, the outflow can be calculated with a geographical features spatial distribution of a wide-ranging river basin, in consideration of the urban area and the land cover situation of each catchment area. Figure 16 shows the river network model of HEC-HMS. Moreover, precipitation information in real-time (ten minutes) can be acquired by using AMeDAS data of JMA with precipitation information. Figure 17 shows precipitation information on the accumulation Automated Meteorological Data Acquisition System every hour.
Figure 15. Watershed aggregation overlaid on DEM map
Figure 16. River network
3. RESULTS AND DISCUSSION
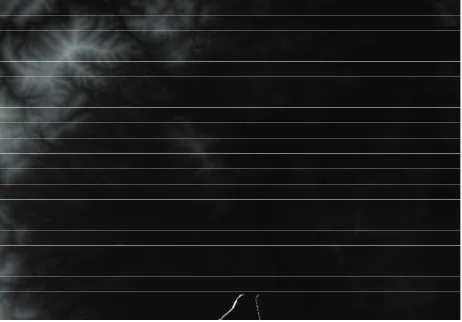
Figure 18 shows an aerial photo image of flood area in Iizuka City on July 19, 2003. That flood brought serious damage to people and Iizuka City. Figure 19 shows the estimated maximum flood area in Iizuka City by HEC-HMS and GIS, which shows the region quite clearly. The estimated flood area is consistent with past flood area. Figure 20 shows the same estimated flood area with classified flooding depths. The region was considered to be in a very serious situation, with a flooding depth of 2.0m - 5.0m, in only several hours. Figure 21 shows water flow directions based on 5mDEM. The colours mean directions in small meshed cells on the ground.
0
Observation ground:IIZUKA
Rainfall July, 2003
Rainfall
Figure 17. AMeDAS rainfall information
Figure 18. An aerial photo image of flood area around the Onga River in Iizuka City on July 19, 2003
Figure 19. Estimated flood area in Iizuka City
Figure 20. Estimated flood area with classified flooding depths
Figure 21. Water flow directions based on 5m DEM
CONCLUSIONS
The present simulation results by HEC-HMS and GIS are consistent with the past flood event in the Onga River in Iizuka City in 2003. The new DEM is quite effective in constructing a 3D model around the Onga River for the present simulation, because the geographical features have not changed since 2003. The accuracy of the DEM is sufficient for flood simulation by HEC-HMS. The flood area in Iizuka City is also estimated by HEC-HMS and GIS.
REFERENCES
Chan, Y., Mori, M., 2013. The construction of flood monitoring system with alert distribution using Google Earth and 3D GIS, Journal of Disaster Research, Vol.8, No.3, pp.512-518.
Mori, M. Chan, Y., 2011. Application of Google Earth for Flood Disaster Monitoring in 3D-GIS, Disaster Management and Human Health Risk, Vol. II, pp.271-276.
U.S. Army Corps of Engineers (USACE), 2010. HEC Hydrologic Modeling System User’s Manual version 3.5.
Yang, J., Townsend, R.D., Daneshfar, B., 2005. A GIS-based approach to river network floodplain delineation, River Basin Management, Vol.3, pp.517-524.
Salvatore, G., Andrea, P., Ettore, A., Fernando, N., 2013. Flood mapping in ungauged basins using fully continuous hydrologic–hydraulic modeling, Journal of Hydrology, Vol.487, 22 April, pp.39-47
Brett, F., 2007. Evaluation of on-line DEMs for flood inundation modeling, Original Research Article, Advances in Water Resources, Vol.30, Issue 8, pp.1831-1843
Li, Z., Bao, H., Xue, C., Hu, Y, Fang, H., 2008. Real-time flood forecasting of Huai River with flood diversion and retarding areas, Original Research Article, Water Science and Engineering, Vol.1, Issue 2, pp.10-24
Brett, F., 2007. Evaluation of on-line DEMs for flood inundation modeling, Original Research Article, Advances in Water Resources, Vol.30, Issue 8, pp.1831-1843
Ali, S., Saeed, S., Reza, M., 2012, Probabilistic flood inundation mapping of ungauged rivers: Linking GIS techniques and frequency analysis, Original Research Article, Journal of Hydrology, Vol.458-459, 21, pp.68-86.