Civilingenjörsprogrammet i energisystem Examensarbete 2015:09 ISSN 1654-9392
Uppsala 2015
Waste-to-Energy in Kutai Kartanegara, Indonesia
Jon Gezelius & Johan Torstensson
SLU, Swedish University of Agricultural Sciences Faculty of Natural Resources and Agricultural Sciences Department of Energy and Technology
Jon Gezelius & Johan Torstensson*
Waste-to-Energy in Kutai Kartanegara, Indonesia Supervisor: Gunnar Bark, Sweco
Assistant supervisor: Syarief Fathillah, Balitbangda
Assistant examiner: Gunnar Larsson, Department of Energy and Technology, SLU Examiner: Åke Nordberg, Department of Energy and Technology, SLU
EX0724, Degree Project in Energy Systems Engineering, 30 credits, Technology, Advanced level, A2E
Master Programme in Energy Systems Engineering (Civilingenjörsprogrammet i energisystem) 300 credits
Series title: Examensarbete (Institutionen för energi och teknik, SLU) ISSN 1654-9392
2015:09 Uppsala 2015
Keywords: waste incineration, biogas, absorption cooling, waste management, sustainability, Borneo, green technology, landfill
Online publication: http://stud.epsilon.slu.se
Cover: Uncontrolled landfill in Muara Jawa, 2015. Photo: Jon Gezelius
* Johan Torstensson performed his thesis within the Master Programme in Sociotechnical Systems Engineering at Uppsala University
Abstract
The thesis outlined in this report is a pre-feasibility study of the potential to use waste-to-energy technology in the region Kutai Kartanegara, Borneo, Indonesia. The project is collaboration between the Kutai Kartanegara government, Uppsala University, the Swedish University of agricultural sciences and technology consultancy Sweco.
The current waste management system in Kutai Kartanegara consists of landfills in the cities and open burnings and dumping in the lesser developed sub-districts. This is a growing problem both environmentally and logistically. The electrification in the sub-districts is sometimes as low as 17 % and access to electricity is often limited to a couple of hours per day. The current electricity production in the region is mainly from fossil fuels.
Data was collected during a two month long field study in Tenggarong, the capital of Kutai Kartanegara. From the collected data, various waste-to-energy systems and collection areas were simulated in Matlab. Results from the simulations show that a system using both a waste incineration and biogas plant would be the best solution for the region.
The chosen system is designed to handle a total of 250,000 tons of waste annually, collected from Tenggarong and neighboring districts. The system will provide between 155 and 200 GWh electricity and between 207 and 314 GWh of excess heat energy annually. Some of this is used in a district heating system with an absorption-cooling machine. The system investment cost is around 42.5 MUSD and it is expected to generate an annual profit of 16 MUSD. The recommended solution will decrease the emissions of CO2-equivalents compared to the current waste system and fossil electricity production with 50%. The results in the study clearly show that there are both economic and environmental potential for waste-to-energy technologies in the region. But the waste
management and infrastructure has to be improved to be able to utilize these technologies.
By implementing waste-to-energy technologies, the supplied waste can be seen as a resource instead of a problem. This would give incentives for further actions and investments regarding waste
Populärvetenskaplig sammanfattning
Examensarbetet är en förstudie av potentialen för användande av waste-to-energy tekniker i regionen Kutai Kartanegara som ligger på Indonesiska Borneo. Projektet är ett sammarbete mellan den lokala regeringen i regionen, Uppsala universitet, Svenska lantbruksuniversitetet och teknik-konsultföretaget Sweco.
Det befintliga systemet för sophantering i Kutai Kartanegara utgörs av deponier i städerna och öppen förbränning och dumpning i de mindre utvecklade underdistrikten. El tillgången i underdistrikten är låg, i vissa fall så låg som 17 % och tillgången är ofta begränsad till några timmar varje kväll. Den el som produceras kommer från fossila källor.
Under en två månader lång fältstudie i Tenggarong, huvudstaden i Kutai Kartanegara, har data samlats in. Den insamlade datan har sedan använts för att kunna simulera olika waste-to-energy system och olika insamlingsområden. Resultaten från simuleringarna visar att ett system som utgörs av både en förbränningsdel samt en biogasdel är det bästa alternativet i regionen.
Det valda systemet är utformat för att kunna hantera 250 000 ton avfall årligen, insamlat från Tenggarong och närliggande distrikt. Systemet kommer då att leverera mellan 155 och 200 GWh elektricitet och mellan 207 och 314 GWh värme. Delar av spillvärmen kommer att användas i en absorptionskylmaskin och ett fjärrkylenät för att öka verkningsgraden och lönsamheten på verket. Investeringskostnaden för systemet är ca 42,5 MUSD och kommer att generera en årlig inkomst på 16 MUSD. Det rekommenderade systemet kommer att reducera klimatpåverkan från utsläpp av koldioxidekvivalenter till hälften jämfört med nuvarande elproduktion och deponier. Resultaten visar tydligt att det finns både ekonomisk och miljömässig lönsamhet i att implementera waste-to-energy tekniker i regionen. Men sophantering och infrastruktur i regionen kommer att behöva förbättras för att kunna utnyttja dessa tekniker.
Genom att implementera waste-to-energy tekniker så hoppas vi att synen på skräp kan förändras från bara ett problem till en nyttig resurs. Detta skulle kunna ge incitament för fortsatta investeringar och projekt relaterat till avfallsproblemet.
Executive summary
Based on the results in this pre-feasability study, the recommendation to the local government in Kutai Kartanegara region is to proceed with a more detailed study regarding waste to energy in the region. Results in this study show that there are both economical and environmental incentments to implement waste to energy technologies in the region.
The recommended system is designed to handle a total of 250,000 tons of waste annually, collected from Tenggarong and neighboring districts. The system will provide between 155 and 200 GWh electricity and between 207 and 314 GWh of excess heat energy annually. Some of this will be used in a district heating system with an absorption-cooling machine. The system investment cost is around 42.5 MUSD and it is expected to generate an annual profit of 16 MUSD. The recommended solution will decrease the emissions of CO2-equivalents compared to the current waste system and fossil electricity production with 50%. However the research also shows that waste management and infrastructure has to be improved to be able to utilize this technologies.
By implementing waste-to-energy technologies, the supplied waste can be seen as a resource instead of a problem. This would give incentives for further actions and investments regarding waste
Forewords
In the fall of 2013 a delegation from Kutai Kartanegara, Indonesia, visited Falun and Borlänge in order to learn from the region's sustainable energy and waste management system. Due to waste- and energy problems in Kutai Kartanegara, the delegation was interested in implementing this sustainable technology to produce green energy and reduce greenhouse gas emissions.
Through Melviana Hedén, Falu Energi och Vatten and Ronny Arnberg, Borlänge Energi, Sweco and IVL were contacted about the project. Sweco and IVL were interested and tried to get funding for a pre-feasibility study where the potential of waste-to-energy would be investigated. Since no funds were available it was decided to be completed as a technical master thesis at University level.
This master thesis was assigned to us, Johan Torstensson and Jon Gezelius, and is the final part of our degree as Master of Science in engineering. Johan has been responsible for the, economical and environmental calculations, waste stream section and co-responsible for the incineration section. Johan will complete a degree in Socio-technical engineering, energy specialization at Uppsala Universitet.
Jon has been responsible for the, biogas section, transportation and waste handling calculations and co-responsible for the incineration section. Jon will complete a degree in Energy Systems at the Swedish Agricultural University and Uppsala University. Gunnar Larsson at the Swedish Agricultural University has been academic supervisor and Gunnar Bark at Sweco has been supervisor in this master thesis.
There have been many people involved in this study, and we would like to take the opportunity to express our gratitude to everyone that have helped along the way which made this study possible.
Gunnar Bark at Sweco for giving the opportunity to carry out this master thesis your strong support
and for assisting with relevant contacts.
Gunnar Larsson at Swedish Agricultural University for your thoughts and quick extensive response on
our emails.
Melviana Hedén at Falu Energi och Vatten for your strong engagement and invaluable help during
the visa application, and contacts in Indonesia. The study could not be completed without you.
Ronny Arnberg at Borlänge Energi and IVL for initiating and introducing us to the project.
ÅFORSK foundation for funding our trip to Kutai Kartanegara.
Mr Hamly for giving important information and support, and showing us around in Samarinda.
Syarief Fathillah at Balitbangda for helping to retrieve all the necessary data, translating it to English
and the laughs at the office. We could never have done the study without you.
Ice, Ape, Hefi and Aldi at Rumah Besar for your hospitality and all the great food. We felt like family
from the first day.
Robi, Jocko, Mariono, Fitri, Arsad, Darman at Rumah besar, for all the fun outside Rumah besar and making us feel very safe at night.
Extended family at Rumah besar for welcoming us to the family and showing us the Kutai Kartanegara culture. It will be a memory forever.
Stepi Hakim for giving insight in the Middle Mahakam project.
Erich Bauer at Martin GmbH, Joel Lybert at Siemens and Camilla Winther at Babcock & Wilcox for
helping with cost information.
Leif Lindow at Biosystems for supporting with knowledge about biogas-systems.
Uppsala, October 2015
Nomenclature
BLH - Badan Lingkungan Hidup BOD – Biochemical oxygen demand CHP – Combined heat and power
CIPS – Chartered Institute of Procurement & Supply CO – Carbon monoxide
CO2 – Carbon dioxide
COD – Chemical oxygen demand COP – Coefficient of performance
DDOC – Degraded degradable organic carbon DH – District heating
DKP – Dinas Kebersihan Dan Pertamanan (Responsible for waste in Samarinda) DOC – Degradable organic carbon
EIA – Energy information administration
EPM – Environmental protection management law EU – European union
EUR – Euro
FOD – First order decay GHG – Greenhouse gases GWh – Gigawatt hour
GWP - Global-warming potential HCl – Hydrogen chloride
HF – Hydrogen fluoride IDR – Indonesian Rupiah
IEA – International energy agency
IPCC – Interngovernmental Panel on Climate Change IPP – Independent power project
IRR – Internal rate of return
IUPTL – Electricity supply business permit
MEMR – Ministry of Energy and Mineral Resources MoF – Ministry of Finance
MSW – Municipal solid waste MWh – Mega Watt hour
NGO – Non-governmental Organization NIP – National Industry Policy
NOx – Nitric oxides NPV – Net present value
PKKK – Pemerintah Kabupaten Kutai Kartanegara (Local government in Kutai Kartanegara) PLN – Perusahaan Listrik Negara (State owned electricity company)
PPA – Power purchase agreement PPP – Public-private partnerships PPU – Private power utilities PVC – Polyvinyl chloride
PwC – Price Waterhouse Coopers
REDD – reduce emissions from deforestation and degradation RGDP – Regional gross domestic product
SCR – Selective catalytic reaction SEK – Swedish crowns
SNCR – Selective non catalytic reaction SOx – Sulphuric oxides
TPS – Temporary waste collection point TS-content – Dry substance
USD – US dollar
VS-content – Volatile solids
WID – Waste Incineration Directives WtE – Waste to energy
Table of Contents
1. Introduction ... 14
Formulate goal and milestones ... 15
1.1. 1.1.1. Milestones ... 15
Limitations in the study ... 15
1.2. 2. Background ... 16 Kutai Kartanegara ... 16 2.1. 2.1.1. Regions ... 18 2.1.2. Energy in Indonesia ... 19
2.1.3. Electricity in Kutai Kartanergara ... 20
2.1.4. Stakeholders and laws on the Indonesian electricity market ... 22
Waste ... 24
2.2. 2.2.1. Municipal Solid Waste in the world today ... 25
2.2.2. Environmental impact ... 26
2.2.3. Laws and regulation for waste management and renewable energy in Indonesia ... 28
3. Waste-to-energy technology ... 31
Waste incineration ... 32
3.1. 3.1.1. Furnaces ... 32
3.1.2. Steam ... 35
3.1.3. Flue gas cleaning ... 38
3.1.4. Residues from waste incineration ... 41
3.1.5. Drying techniques ... 41 Biogas ... 44 3.2. 3.2.1. Anaerobic digestion ... 44 3.2.2. Substrates ... 44 3.2.3. Systems ... 45 3.2.4. Products ... 46
Environmental aspects of WtE ... 47
3.3. 3.3.1. GHG ... 47
3.3.2. Dioxins ... 48
3.3.3. Particles and dust ... 48
3.3.4. Acidification ... 49
3.3.5. Heavy metals ... 49
3.3.7. Hydrogen chloride, HCl ... 50 3.3.8. Hydrogen fluoride, HF ... 50 Economical models ... 51 3.4. 3.4.1. Payback model ... 51 3.4.2. NPV model ... 51 4. Method ... 52 Scenarios ... 54 4.1. 4.1.1. Scenario 1 ... 54 4.1.2. Scenario 2 ... 54 4.1.3. Scenario 3 ... 55 Systems ... 56 4.2. Waste Stream ... 57 4.3. 4.3.1. Waste composition ... 57 4.3.2. Waste supply ... 57 Waste incineration ... 59 4.4. 4.4.1. Heat production ... 59 4.4.2. Boiler ... 61 4.4.3. Steam cycle ... 61 Absorption cooling ... 64 4.5. 4.5.1. Opportunities for district cooling ... 64
4.5.2. Estimation of cooling capacity needed ... 64
4.5.3. Estimation of cooling capacity available ... 64
Drying technique ... 65
4.6. 4.6.1. Air flow bed drying technique ... 65
Biogas production ... 66
4.7. Economy ... 67
4.8. 4.8.1. Investment cost incineration plant ... 67
4.8.2. Annual cash flow ... 69
4.8.3. Revenues ... 69
4.8.4. Expenditures ... 70
Environmental impact ... 75
4.9. 4.9.1. Transport and waste handling ... 75
4.9.2. Waste incineration ... 76
4.9.4. Current situation ... 76
4.9.5. Comparison ... 78
Sensitivity analysis ... 79
4.10. 5. Result ... 80
Waste management in Kutai Kartanegara ... 80
5.1. 5.1.1. Landfill ... 81
5.1.2. Waste Pickers ... 81
5.1.3. Waste management in sub-districts ... 83
Waste streams ... 85
5.2. 5.2.1. Waste composition in Kutai Kartanegara and Samarinda ... 85
5.2.2. Waste supply ... 86 District cooling ... 89 ... 89 5.3. Heating value ... 89 5.4. Heat and electricity production ... 90
5.5. Economic results ... 92
5.6. 5.6.1. Investment costs ... 92
5.6.2. Cash flow ... 94
5.6.3. Economic performance indicators ... 100
Environmental result ... 107
5.7. 6. Recommended solution and design ... 109
Location ... 109
6.1. Waste reception ... 109
6.2. Design of WtE incineration plant... 110
6.3. 6.3.1. Grate ... 110
6.3.2. Boiler ... 110
6.3.3. Flue gas cleaning ... 110
6.3.4. Residues ... 110
6.3.5. Steam cycle ... 111
6.3.6. Existing pipe network ... 111
Design of biogas plant: ... 112
6.4. 6.4.1. Pre treatment ... 112
6.4.2. Reactor ... 112
6.4.4. Energy production ... 112
Design parameters and environmental savings ... 113
6.5. 7. Discussion ... 115
8. Further studies ... 117
References ... 118
Appendix A – Middle Mahakam project ... 122
REDD ... 122
REDD in Kutai Kartanegara ... 123
Evaluation of the energy and waste situation ... 123
Propositions ... 125
Appendix B - Promotional project summary for Pole to Paris ... 128
Appendix C - Summary ORWARE-model ... 132
Appendix D - Matlab codes ... 133
Main programme code ... 133
Boiler code ... 139
Boiler dryer code ... 143
Combustion code ... 148
Combustion dryer code ... 151
Dryer code ... 154
Economics code ... 155
Environment code ... 159
Biogas code ... 162
Waste data matrix from orware ... 162
Appendix E - Extended method transportation cost ... 165
River transport... 165
Road transport ... 165
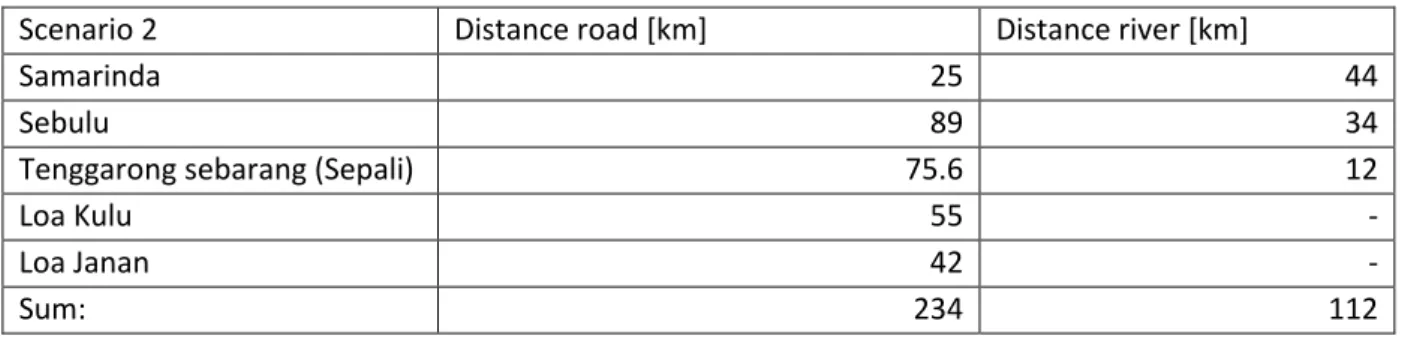
Scenario 2 ... 165
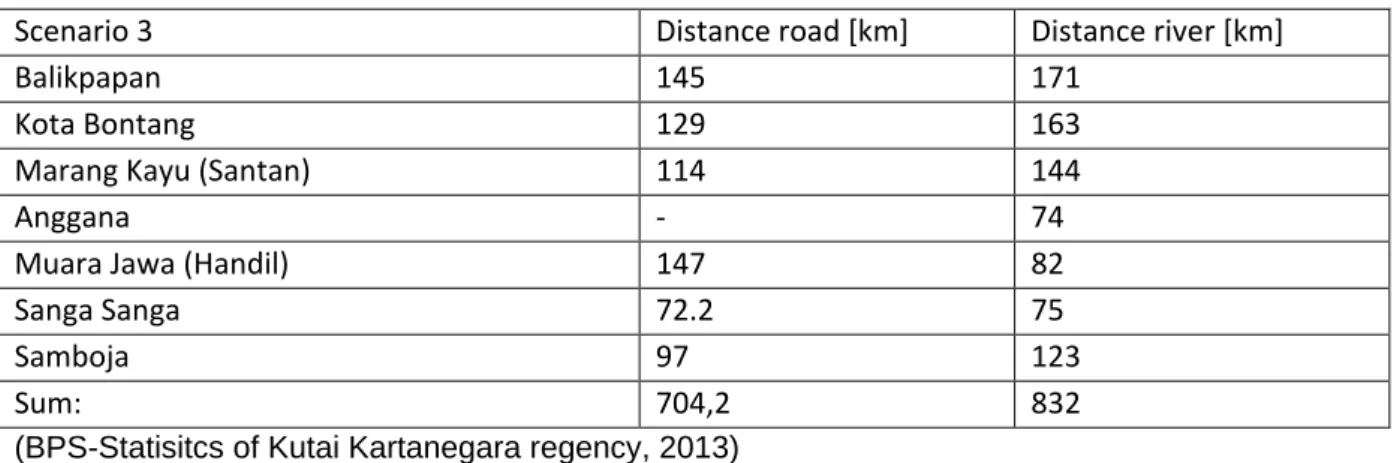
Scenario 3 ... 166
Appendix F - Extended method waste handling cost ... 167
Appendix G - Extended method electricity need biogasplant ... 168
Appendix H - Extended method GHG emissions from transport ... 169
River transport... 169
Road transport ... 169
Appendix I - Extended simulation results ... 170
Energy and economics ... 170
Scenario 1 System inc ... 170
Scenario 1 System inc + dryer ... 171
Scenario 1 System inc + bio ... 172
Scenario 2 System inc ... 174
Scenario 2 System inc + dryer ... 175
Scenario 2 System inc + bio ... 176
Scenario 3 System inc ... 178
Scenario 3 System inc + dryer ... 179
Scenario 3 System inc + bio ... 181
Environmental ... 183
Scenario 1 System inc ... 183
Scenario 1 System inc + dryer ... 185
Scenario 1 System inc + bio ... 186
Scenario 2 System inc ... 188
Scenario 2 System inc + dryer ... 190
Scenario 2 System inc + bio ... 192
Scenario 3 System inc ... 194
Scenario 3 System inc + dryer ... 196
Scenario 3 System inc + bio ... 198
Appendix J - Extended results waste handling cost ... 200
Scenario 1 ... 200
Scenario 2 ... 200
Scenario 3 ... 200
Total ... 201
Appendix K - Extended result waste transport ... 202
Scenario 1 ... 202
Scenario 2 ... 202
Scenario 3 ... 203
Total ... 204
Appendix L - Extended results for GHG emissions from waste handling and transportation ... 205
Scenario 1 ... 205
Scenario 3 ... 205 Total ... 206
14
1. Introduction
Current global municipal solid waste, MSW, generation is approximately 1.3 billion tons a year and is estimated to increase to 2.2 billion tons per year by 2025, waste that in many cases ends up in the wrong place (Hoornweg & Bhada-Tata, 2012).
Many of the developing countries do not have a functional waste management system and do not have the technology to take proper care of their waste. Data from the World Bank (2012) states that low income countries dump 13% of their waste on uncontrolled landfills and either burn or dump 27% of the waste (Hoornweg & Bhada-Tata, 2012).
Indonesia has a rapidly growing middle class and are now experiencing problems related to a more consuming lifestyle. These problems include an accelerated energy demand and an accelerating waste production. The government in Indonesia is beginning to address these problems, but have a shortage in knowledge of technologies (Rawlins, Beyer, Lampreia, & Tumiwa, 2014).
Sweden is right now one of the leading countries in the world when it comes to waste management and energy recovery from waste. This gives the opportunity to help developing countries to solve their problems.
The local government in Kutai Kartanegara regency, Indonesia on Borneo is well aware of their problems and as a step forward they have in cooperation with Sweco, Uppsala University and the Swedish University of Agricultural Sciences initiated this project.
This study addresses three of the larger problems in the world right now: the shortage of energy, the accumulation of waste and the emissions of greenhouse gasses (World Energy Council, 2013). The project aims to investigate waste as an energy resource in Kutai Kartanegara regency as well as estimate the potential environmental impacts of implementing waste-to-energy systems. This project is a prefeasibility study of waste-to-energy in Kutai Kartanagare and also a piloting student exchange, with the potential to become a consultancy project and an on-going collaboration between regions in Sweden and Indonesia.
15
Formulate goal and milestones
1.1.
The goal is to do a pre-feasibility study on the possibility to implement waste-to-energy plants in the Kutai Kartanegara region. The plants should be economically and environmentally sustainable.
1.1.1.Milestones
To accomplish this goal, the following milestones have to be considered:
Map the present energy supply and demand of the Kutai Kartanegara region.
Locate the available municipal solid waste supply in the Kutai Kartanegara region. Investigate the composition and energy potential of the waste.
From available resources and energy demand simulate different kinds of CHP and biogas plants.
Make a sensitivity analysis where different parameters in the model are varied. Examples on varied variables are: moisture in fuel, size of plant and supply of fuel.
Create economical models that calculate the economic viability and payback time. Create a model that calculates the change in greenhouse gas emissions that an implementation would bring.
Present a final proposal of waste-to-energy plant(s) in the region that will optimize the performance and work according to Indonesian laws. The plant(s) will be evaluated in terms of their ability to meet current demand with the available resources and how well they perform from an environmental, economic and technological perspective.
Limitations in the study
1.2.
To be able to finish this study within the time frame, some limitations were needed. When locating the waste streams only the municipal solid waste was accounted for. Industrial waste and
agricultural waste has not been investigated. The different technology solutions might need separation of the available waste. This study will not investigate how this separation can be performed.
In the economical calculations all investment costs have not been included, connection to the grid and pipe lines for district cooling are not included. Taxes and inflation are other parameters that are excluded from the economic models. In the environmental analysis only greenhouse gas emissions are considered. Toxins and pollutants are not investigated.
16
2.
Background
Details about the region, Kutai Kartanegara and municipal solid waste in general are presented in this section.
Kutai Kartanegara
2.1.
Kutai Kartanegara regency is an autonomous region located in East Kalimatan, Borneo, Indonesia, see Figure 2-1. The region is divided into 18 districts and 237 villages over an area of 27,263 km2. In 2012 the total population was 674,464, a 3.6% increase from 2011. The population density in Kutai Kartanegara was 25 people/ km2 in 2012. The 930 km long Mahakam River runs through the region (BPS-Statisitcs of Kutai Kartanegara regency, 2013).
Figure 2-1 Map over the Kutai Kartanegara region, showing the 18 different subdistricts (Gerbang Informasi Kabupaten Kutai Kartanegara, 2013)
The Kutai region is known for its rich natural resources, there are plenty of coal, oil, natural gas and tropical forest compared to other regions in East Kalimantan. The region is located along the equator as shown by the pointer in Figure 2-2, and has a tropical climate which means a stable temperature around 27 Co with a humidity varying within the range 70-90%. There are two minor seasonal periods: one rainy season, November-May, and one dry, June – October. Average rainfall is around 200 mm a month, see Figure 2-3. The region has a unique wildlife with endangered species such as orangutan, siamese crocodile and fresh water dolphin (BPS-Statisitcs of Kutai Kartanegara regency, 2013).
17
Figure 2-3 Rainfall by month, 2010-2102 (BPS-Statisitcs of Kutai Kartanegara regency, 2013)
The infrastructure in the region is not fully developed. The quality and availability of roads and bridges is a major problem. Currently villages in some sub-districts are dependent on the river to access other remote districts and villages. The length and conditions of the roads in Kutai
Kartanegara is presented in Table 2-1. Most of the good roads are situated close to the Tenggarong district and between Tenggarong and major cities in neighbouring regions. Transportation in rural areas are costly due to high fuel prices and time consuming because of the insufficient infrastructure (BPS-Statisitcs of Kutai Kartanegara regency, 2013).
Table 2-1 Conditions of roads in Kutai Kartanegara regency
Condition of road Good Moderate Damaged Heavy damaged Total
Length (km) 294 398 233 639 1564
(BPS-Statisitcs of Kutai Kartanegara regency, 2013)
The economy in Kutai Kartanegara is dominated by the coal mining, oil – natural gas and quarrying sector which stands for around 84 % of the regional gross domestic product, RGDP. Agriculture and forestry is the second biggest sector, it stands for 7% of the RGDP in the region (BPS-Statisitcs of Kutai Kartanegara regency, 2013). Figure2-4 summarizes the different sectors and their contribution to the RGDP in percent. The RGDP per capita with current prices has increased steadily by around 3-4 % per year the last years (BPS-Statisitcs of Kutai Kartanegara regency, 2013).
Figure 2-4 Diagram over the different sectors share of the Regional Gross Domestic Product (BPS-Statisitcs of Kutai Kartanegara regency, 2013)
18
2.1.1.Regions
Figure 2-5 is a map over Kutai Kartanegara regency and its neighbouring regions.
Figure 2-5 Map of Kutai Kartanegara and neighboring regions (BPS-Statisitcs of Kutai Kartanegara regency, 2013)
Tenggarong is the capital and most populous city in the Kutai Kartanegara region. In 2012 the city had 104,044 inhabitants. The city is located in the central part of Kutai Kartanegara, along the
Mahakam River. Since Tenggarong is the capital, a lot of regional government buildings and company buildings are located in the city. Tenggarong also has a lot of civil service buildings, hotels and
markets (BPS-Statisitcs of Kutai Kartanegara regency, 2013). At the moment a new shopping mall and bridge over the Mahakam river is under construction. The bridge will ease travelling to Samarinda. Samarinda is a small region, 718 km2, encircled by Kutai Kartanegara, see Figure 2-5. The region
consists of 6 districts with 53 villages. In 2014 the region had 857,569 inhabitants and a population density of 1,194 inhabitants/km2 (Head of DKPP Samarinda, 2015). The population growth is around 3 % a year (Samarinda Green Clean Health, 2014). The city of Samarinda, Borneo's largest city, is the capital of the East Kalimantan province; it is located 25 km east of Tenggarong, 45 km following the Mahakam river (BPS-Statisitcs of Kutai Kartanegara regency, 2013). Samarinda host many provincial institutions and is also a centre of commerce.
Balikpapan is a 503 km2 region located 145 km south of Tenggarong. The region consist mainly of Balikpapan city which is divided into five districts. In 2014 the population was around 715,000, which gives an approximate population density of 1,421 inhabitants/km2 (Head of Balikpapan Waste Management, 2015). The population growth is around 3 % a year (Abadi, 2014). Balikpapan's economy is based on the oil industry. The city has a large oil refinery and many international oil
19
companies have their Kalimantan headquarter in the city. The presence of international companies has improved the infrastructure, and Balikpapan has an international airport as well as a large port (Head of Balikpapan Waste Management, 2015).
Bontang is a region 129 km north of Tenggarong. It occupies an area of 498 km2 and had a population of 175,830 in 2012, resulting in a population density of 353 inhabitants/km2. The population growth is around 4 % a year (Balitbangda, 2015). The region is dependent on LNG production, coal mining, ammonia and urea production and manufacturing. Most of these products are exported to Japan and South Korea (Balitbangda, 2015).
2.1.2.Energy in Indonesia
Indonesia is a country with rich energy resources. It has a large fossil reserve but also potential in geothermal energy and hydropower. Due to the large fossil resources the electricity generation is highly dependent on fossil fuels. In 2013, around 91 % of the electricity generation used fossil fuels (Aiman & Prawara, 2014), see Figure2-6.
Figure 2-6 Energy resources for electricity production in Indonesia, 2013 (Aiman & Prawara, 2014)
In September 2013 the total installed capacity in Indonesia was 40,533 MW, consisting of 31,815 MW in Java-Bali and 8,718 MW in Sumatra and East Indonesia (PWC, 2013). The generation is spread out in separate grids due to natural geographical reasons. The electrification rate has grown from 62 % in 2008 to 76 % in 2012 (PWC, 2013). Compared to similar countries in the Southeast Asia this
electrification rate is very low, see Table 2-2. In some regions the generation capacity is barely sufficient to meet the demands and the transmission grid is underdeveloped, which results in a low electricity availability (Kelistrikan Kabupaten Kutai Kartanegara, 2014).
Table 2-2 Electrification rate in Southeast Asian countries
Country Electrification rate (%) Population without electricity (million)
Indonesia 76 62,4 Philippines 89,7 9,5 Vietnam 97,3 2,1 Malaysia 99,4 0,2 (PWC, 2013) 5% 20% 4% 5% 14% 52%
Energy recourses for electricity
generation
LNG Gas Geothermal Hydro Fuel oil Coal20
2.1.3.Electricity in Kutai Kartanergara
The electricity provided in Tenggarong is generated and distributed in the 150 kV Mahakam power system. The Mahakam power system is the main system in the Kutai Kartanegara region and stretches from Balikpapan in the south to Bontang in the north (PT PLN, 2013), see Figure 2-7. In 2014 the total power generation of Mahakam system was 429 MW divided on 16 major power producers using 58 power units (Kelistrikan Kabupaten Kutai Kartanegara, 2014). These producers mainly use fossil fuels for power generation. In addition to the Mahakam power system four smaller systems with a total capacity of 115 MW provide the majority of electricity in East Kalimantan. The total installed power generation capacity in East Kalimantan is 544 MW (PT PLN, 2013).
Figure 2-7 Overview of Mahakam power system (PT PLN, 2013)
Due to insufficient infrastructure, all districts in Kutai Kartanegara are not connected to the
Mahakam system. In remote districts and villages small isolated systems are providing electricity (PT PLN, 2013). These isolated systems are using diesel generators and have a total capacity of 9 MW. One exception is the biogas power plant in Kembang Janggut, 8 MW, that supply parts of the Kembang Janggut district (Kelistrikan Kabupaten Kutai Kartanegara, 2014). The electrification rate of households in Kutai Kartanegara is 82 %, where Perusahaan Listrik Negara ,PLN, serve 78 % of the area (Kelistrikan Kabupaten Kutai Kartanegara, 2014), see Table2-3. Even if a household is electrified it is not certain that power is available the whole day. Remote households connected to local grids usually only have access to electricity 6-8 hours per day (Head of Muara Kaman, 2015).
21
Table 2-3 Electrification rate Kutai Kartanegara
District Number of households Connected to an electricity grid PLN share (%) Total (%) Anggana 12,129 10,349 81 85 Kota Bangun 9,211 6,765 71 73 Marang Kayu 7,894 2,361 30 30 Muara Kaman 10,623 10,272 94 97 Muara Muntai 5,406 5,377 74 99 Muara Wis 2,612 457 17 17 Kembang Janggut 7,148 3,729 10 52 Kenohan 3,333 559 16 17 Loa Janan 19,472 19,472 93 100 Muara Badak 11,554 5,936 51 51 Muara Jawa 9,667 7,079 73 73 Semboja 17,271 16,073 93 93 Sebulu 11,049 11,049 100 100 Tenggarong Seb 15,016 14,306 95 95 Loa Kulu 13,251 11,963 90 90 Tenggarong 24,594 22,679 89 92 Tabang 2,849 1,207 42 42 Sanga-sanga 5,634 5,634 98 100 Total 188,713 155,267 78 82
(Kelistrikan Kabupaten Kutai Kartanegara, 2014)
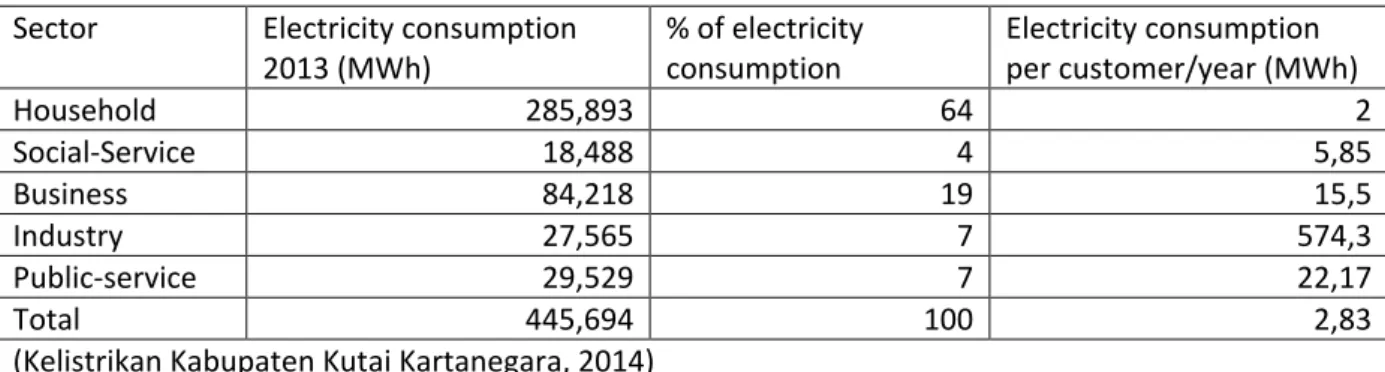
The household sector is the sector that demands most electricity in the region. In 2013 64 % of the generated electricity was used by households (Kelistrikan Kabupaten Kutai Kartanegara, 2014). The peak load was according to PLN around 400 MW in the Kutai Kartanegara region (PT PLN, 2013). Even if the supply is sufficient there are plenty of blackouts due to limited power reserves and an
underdeveloped transmission grid (Kelistrikan Kabupaten Kutai Kartanegara, 2014). Many households are on a waiting list for electricity supply. Electricity consumption for each sector and customer in Kutai Kartanegara is shown in Table2-4.
Table 2-4 Annual electricity usage per sector and customer in Kutai Kartanegara, 2013
Sector Electricity consumption 2013 (MWh) % of electricity consumption Electricity consumption per customer/year (MWh) Household 285,893 64 2 Social-Service 18,488 4 5,85 Business 84,218 19 15,5 Industry 27,565 7 574,3 Public-service 29,529 7 22,17 Total 445,694 100 2,83
(Kelistrikan Kabupaten Kutai Kartanegara, 2014)
According to PLN the electricity demand in Kutai Kartanegara will increase by approximately 9 % annually during the coming years (PT PLN, 2013). This will require large investments in power generation and transmission grid.
22
2.1.4.Stakeholders and laws on the Indonesian electricity market
The following section will briefly present the stakeholders and laws on the Indonesian electricity market.
2.1.4.1. Ministry of Energy and Mineral Resources, MEMR
The MEMR is the policy-making department for electricity. The MEMR is responsible for long term electricity plans as well as laws and regulation related to electricity. It is also responsible for tariff and subsidy policies as well as issuing of business licenses (Norton Rose, 2010).
2.1.4.2. PT Perusahaan Listrik Negara, PLN
PT Perusahaan Listrik Negara, PLN, is the state-owned electric utility company in Indonesia. PLN is responsible for the majority of the power generation in Indonesia, 77 %, and has exclusive rights for distribution, transmission and supply of electricity to the public (PWC, 2013). PLN is supervised by the MEMR, the Ministry of Finance, MoF and the Ministry of State Owned Enterprises.
PLN's income is retrieved from electricity tariffs, regulated by MEMR. Fuel cost stands for around 85 % of PLN's operation expenses and the tariffs are not high enough to cover the cost for electricity generation. Even if the MoF pays subsidy to the PLN it is not sufficient to provide for PLN's
expenditure requirements. Due to increased subsidies from MoF PLN's financial situation has
improved since 2011, but it is still not sufficient to fund the large investment needed. Even so, PLN is the major investor of new electricity generation projects in Indonesia (PWC, 2013).
2.1.4.3. Independent Power Projects, IPP
Independent Power Projects, IPP, are private independent actors on the Indonesian market that can generate electricity and sell it to PLN through Power Purchase Agreements, PPA, licensed by the central government. The price per kWh and duration of the agreement between PLN and IPP should be stated in the PPA. IPP stood for around 19 % of the total generating capacity in Indonesia in 2011 (PWC, 2013).
IPP's were from early 1990's seen as a good investment due to high forecasted returns; this resulted in a high uptake of investors in the early tendering process. However, when the Asian financial crisis struck in 1997, the PLN had problems to carry out the agreed PPA's, resulting in lower returns for the IPP's (DIFFER, 2012).
After the financial crisis few new IPP's were established due to low forecasted returns and high risks for investors. PLN’s monopoly also contributed to the low investing rate. To improve the conditions for IPP's new laws and regulations were stated in 2009 (PWC, 2013).
2.1.4.4. Electricity law 30
The 2009 Electricity Law 30 improves the conditions for IPP's on several points. The three key reforms of Law 30 are the following (Norton Rose, 2010):
PLN will no longer have a monopoly on supply and distribution to end-customers
Private business may provide electricity for public use, but PLN have a "right of first priority"
Greater role for regional governments in future projects in terms of license granting and tariff costs.
23
These reforms are made to increase private participation in electricity generation and increase the regional autonomy. Even if this law ends PLN's monopoly role as electricity supplier, IPP's must sell generated electricity to PLN through negotiated PPA's. The "right of refusal" gives PLN priority to serve areas without an electricity grid. If PLN does not plan to serve an area with electricity IPP's can serve these areas. IPP's are always allowed to sell directly to end-customers if they have an IUPTL license (Electricity supply business permit) and their own transmission grid. This is, however, very rare due to high investment costs (Norton Rose, 2010).
The new rules also allows Public-Private Partnerships, PPP, that in a general sense is a collaboration between local or regional government and private partners to utilize private projects more
efficiently, and to benefit the private and public sector. The law has increased autonomy for regional governments and is believed to increase rural electrification. Local and regional governments need an IUPTL license to be able to sell electricity to end-users (DIFFER, 2012).
Captive electricity generation in the form of Private Power Utilities, PPU, is power plants that generate electricity for their own use, for example industries. To be able to generate and distribute their own electricity they need a license. If possible, PPU's may sell excess electricity to PLN or end-customers if approved by local government. Generation from PPU’s to end-customers is only used in some remote areas where customers not are connected to a PLN grid (PWC, 2013).
In summary there are four ways for an IPP to sell generated electricity (DIFFER, 2012), see Figure2-8:
To PLN through PPAs
To Regional governments through PPA or PPP (Regional government needs IUPTL)
Direct to end-users with an IUPTL license and their own transmission grid
Captive generation through granted Operation License
24
Waste
2.2.
Waste can be seen as unwanted materials, such as scrap material, or any surplus substance and article that are unwanted, because it is worn out, broken, contaminated or otherwise spoiled (CIPS, 2007). Waste mainly comes from three sectors: agriculture, the municipal sector and different industrial facilities (CIPS, 2007).
Industrial waste - The industrial waste is produced from a wide range of industrial activities. Usually the waste is generated from the production of metals, beverage, wood and wood products and paper products. The waste may be liquid, solid or sludge.
Agricultural waste - Agricultural waste is produced in agricultural operations such as harvesting and farming. This waste is mainly organic and is comprised of manure, harvest waste, compost and offal. Plastics and scrap machinery might also be found in the agricultural waste.
Municipal waste - The municipal waste is the waste generated by households and enterprises such as commerce, offices and institutions. This waste is by definition supposed to be
collected by the local municipality. Sometimes there are parts of industrial waste in the municipal waste.
The waste from these three sectors contains the following more detailed waste categories. The fraction of each category varies depending on the local conditions and waste sector (CIPS, 2007).
Hazardous waste - The hazardous waste is waste that can be a potential threat to public health or the environment. A lot of businesses generate small amounts of hazardous waste, such as hospitals, automobile service shops and photo processing centres. The largest hazardous waste generators are heavy industries such as chemical industries, metal industries and oil refineries.
E - Waste - This waste is comprised of a range of electrical and electronic items such as refrigerators, cell phones, televisions and other electronic tools. This waste originates from households, businesses and industries.
Construction and demolition waste - This waste arises from the construction and demolition activities of new and old buildings and infrastructure. This waste category can be made up of numerous different materials including concrete, glass, wood, bricks etc. Many of these materials can be recycled.
Organic waste - Organic or biodegradable waste is waste that can be broken down to its base compounds by micro-organisms. Examples of organic waste are food, fruit, harvest waste, manure and slaughter house waste. This waste usually constitutes a large part of municipal waste and agricultural waste.
25
Mining waste - Mining waste arise from the mining industry, extracting, prospecting and treating storage of minerals. This is by weight the largest category of waste. It is all generated within the industrial sector.
Packaging waste - Any material that has been used to contain, handle, deliver or present goods can be seen as packaging waste. The packaging items are usually made of glass, plastic, aluminium or paper. The packaging waste is usually generated in the industrial or municipal waste sector. Most of this waste can be recycled.
2.2.1.Municipal Solid Waste in the world today
Current global municipal solid waste, MSW, generation is approximately 1.3 billion ton a year and it is estimated to increase to 2.2 billion ton per year by 2025 (Hoornweg & Bhada-Tata, 2012). The MSW generation is influenced by economic development, level of industrialization, public habits and local climate; hence the waste generation vary considerably between countries and regions. Generally high urbanization and high living standards results in greater amount of MSW generation, see Figure 2-9. The vast majority of the total amount of MSW is generated in the cities. The increased
generation depends on urbanization, economic growth and increased world population. Southeast Asia is one of the regions where MSW generation is predicted to increase the most (Hoornweg & Bhada-Tata, 2012).
Figure 2-9 Waste generation by income (Hoornweg & Bhada-Tata, 2012)
The composition varies considerable from region to region; this is influenced by economic
development, climate and culture. Low income regions have the highest fraction of organic waste, around 64 %, compared to high income regions where it is around 27 %. High-income regions have instead larger fractions of paper, metal and glass, which are smaller in low-income regions. The tendency is that when regions develop economically, the organic fraction of the MSW decreases (Hoornweg & Bhada-Tata, 2012).
Waste collection has an important role to play for public and environmental health. Local authorities’ usually have the responsibility for waste collection. The total collection rate varies depending on the economic development and population density. High-income regions and cities have a collection rate of around 98 %, while low-income cities with low population density have collection rates around 40 %. In poor, remote, regions it is not certain that there is any waste collection at all. The separation
6%
29%
19% 46%
Waste generation by income
Lower income Lower middle income Upper middle income High income
26
of waste also varies depending on income. High-income areas have a better separation system, while low income areas rely on waste pickers since a separation system can be too costly (Hoornweg & Bhada-Tata, 2012).
There are no certain data on countries MSW disposal techniques, but according to data from the World Bank, the most common treatment is disposal at controlled landfills, 45 % of the total amount of waste is treated this way.
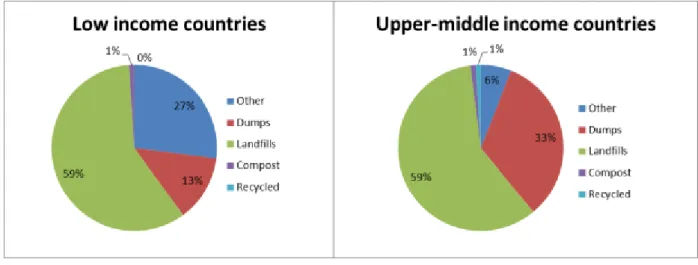
The treatment tends to vary considerably between different regions. In high income regions controlled landfills are most commonly used, 42 % of the cases. However, recycling (22 %) and energy recovery (21 %) are also common. Middle-income regions dump the majority of the waste on controlled landfills (60 %), but dumping on open uncontrolled dumpsites is also common (33 %). In the low-income regions dumping at landfills and open dumping is by far the most common disposal method (Hoornweg & Bhada-Tata, 2012). These regions also have a large share of unknown disposal. This share is according to World Data thrown on illegal dumpsites or burned openly. Figure 2-10 below shows the disposal method in low income countries to the left and upper-middle income countries to the right (Hoornweg & Bhada-Tata, 2012).
Figure 2-10 Disposal methods in low income countries and upper-middle income countries (Hoornweg & Bhada-Tata, 2012)
2.2.2. Environmental impact
Landfills, open burning and dumping are the least preferred treatments of municipal waste. The environmental impacts from these disposal techniques are briefly presented in the following text.
2.2.2.1. Emissions from landfills
Putting the waste on landfills will generate two types of emissions: gas emissions in form of landfill-gas and leachate water. The definition of leachate water is water that has been in contact with the waste. It is produced as a result of infiltrating water from precipitation surplus, penetration of groundwater or streams, surface water that enters the landfill area or water content in the waste that gets compressed. To get an estimation of the amounts of leachate you usually do a water balance over the area according to Equation 2-1 (Naturvårdsverket, 2008).
Equation 2-1
𝐿𝑒𝑎𝑐ℎ𝑎𝑡𝑒 = 𝑝𝑟𝑒𝑐𝑖𝑝𝑖𝑡𝑎𝑡𝑖𝑜𝑛 − 𝑒𝑣𝑎𝑝𝑜𝑟𝑎𝑡𝑖𝑜𝑛 (+𝑝𝑒𝑛𝑒𝑡𝑟𝑎𝑡𝑖𝑛𝑔 𝑔𝑟𝑜𝑢𝑛𝑑𝑤𝑎𝑡𝑒𝑟 + 𝑚𝑜𝑖𝑠𝑡𝑢𝑟𝑒 𝑐𝑜𝑛𝑡𝑒𝑛𝑡 𝑖𝑛 𝑡ℎ𝑒 𝑤𝑎𝑠𝑡𝑒)
27
An easy approximation would be to only look at the precipitation – evaporation, for more exact analysis the groundwater and the moisture content of the waste has to be accounted for (Avfall Sverige, 2012).
Examples of components in the leachate water from landfills are:
Nutrients like nitrogen
Oxygen-consumers (measured by BOD and COD)
Metals like lead, iron, cadmium, copper, chromium, mercury, manganese, nickel and zinc.
Organic environmental poisons like dioxins, bromic nonflamants and pesticides.
Compounds from medication like antibiotics, nonflamants and hormones.
The composition of the leachate depends on the composition of the waste in the landfill. There is a risk that these compounds will have a harmful effect on soil, river streams and groundwater and the contents might be toxic to animals and plants. Some of it might also bio-accumulate and thus result in a large impact even if the concentrations are low (Naturvårdsverket, 2008).
To understand and prevent environmental effects from a specific landfill, it is important to run tests on the leachate water and have a cleaning process before emission. The amount of water leaking is also highly dependent on the preparatory work on the landfill (Avfall Sverige, 2012).
Gas emissions from landfills mainly consist of methane and carbon dioxide, which both are climate-affecting gasses. The composition of landfill gas is usually 40-60 % methane, 30-40 % carbon dioxide and 1-20 % nitrogen, though small fractions of other gasses also occur, see Table2-5. As long as there are water and organic compounds in the landfill it will keep producing gas (Avfall Sverige, 2012).
Table 2-5 Compositions of typical landfill gas
Gas component Value Unit
Methane 30-60 Vol-%
Carbon dioxide 30-40 Vol-%
Nitrogen 1-20 Vol-% Hydrogen 0-2 Vol% Oxygen 0-2 Vol-% Sulphuric hydrogen 10-1000 Ppm Water 5-30 Mg/N m3 Chlorine 250 Mg/N m3 Di-chlorine-methane 400 Mg/N m3 Tetrachloroethylene 233 Mg/N m3 Freon 12 118 Mg/N m3 (Avfall Sverige, 2012)
When the degradable organic compounds, DOC, are decomposed in the landfill they emit landfill gas. If the DOC fraction of the waste composition is known, the amount of emitted methane from a specific landfill can be estimated theoretically using an IPCC implemented model (Pipatti & Svardal, 2006).
28
2.2.2.2. Open burning
Households or villages sometimes burn their waste due to a lack of waste collection or poor information. Open burning is inefficient and the combustion temperature is usually around 250-700 °C. Because of the low temperature combustion will be incomplete and have higher environmental impact than controlled combustion would have (SASK Spills, 2010).
The smoke from open burning may contain aldehydes, acids, dioxins, nitrogen oxides, volatilized heavy metals and sulphur oxides. The ash from combustion can also contain toxics like dioxins, furans and heavy metals. Some of the ash will be carried into the atmosphere as fly ash and can travel thousands of kilometres before it descends and enter ecosystems. The majority of the ash will remain at the combustion site where the toxins contaminate the ground and water streams. The contaminations have severe negative health effects on humans and wildlife such as fishes (Aye & Widaya, 2005).
The environmental effect varies depending on the waste composition. Most toxins are released when plastics, electronic waste and hazardous waste are burned (SASK Spills, 2010).
2.2.2.3. Dumping
Water streams and backyards have historically been used as small scale dump sites due to practical reasons when no waste collection is available. Dumping plastic waste and electronics on the ground and in water streams will cause contamination of the environment (Aye & Widaya, 2005).
The plastic waste on the ground will eventually release environmental toxins which will contaminate the ground or water streams nearby. Usually waste follows the tidal and ends up in water streams. In water streams waste will spread toxins such as heavy metals and stable organic toxins, for example dioxins. These toxins will accumulate in wild life and can be accumulated by humans. Electronic and plastic waste will cause especially negative environmental consequences (Aye & Widaya, 2005).
2.2.3.Laws and regulation for waste management and renewable energy in Indonesia
The Indonesian government has a clear vision about how to reduce emissions of greenhouse gases. Development of technologies that enables opportunities to reduce GHG emissions and increase renewable energy generation is in line with their target. To pursue these targets the government has formed national policies in different sectors over the last decade (Rawlins, Beyer, Lampreia, & Tumiwa, 2014). Figure 2-11 shows some policies that directly influence waste management and WtE technology in Indonesia.
29
2.2.3.1. Municipal solid waste law
Until 2008 local regulations decided how the waste management was carried out since no national directive existed. But in May 2008, the Municipal Solid Waste law was enacted. This law states that the national government has responsibility to create waste strategies at a national level and develop cooperation with the local government. The local governments still have responsibility to form waste strategies at a local level to meet the national strategy as well as control and evaluate their progress (Damanhuri, Handoko, & Padma, 2013).
The MSW law also state that the local governments are obliged to plan for decommissioning of open landfills by 2013. New landfills must be equipped with processing stations that can handle waste sorting and recycling. The final disposal in new landfill sites must avoid methane emissions (Damanhuri, Handoko, & Padma, 2013).
2.2.3.2. National Industry policy and Environmental protection and
management law
The National Industry Policy, NIP and the Environmental protection and management law, EPM were developed in combination to the MSW in 2008-2009 to improve the waste management in the industrial sector (Rawlins, Beyer, Lampreia, & Tumiwa, 2014).
The NIP aims to develop the industrial sector in Indonesia by removing tariff levels on pollution control and waste treatment equipment. The policy also enables soft loans and grants to acquire such equipment (Rawlins, Beyer, Lampreia, & Tumiwa, 2014).
The EPM is a stricter environmental law that regulates the waste management among industries. The law requires high pollutant industries to obtain permits which restrict their solid, liquid and gaseous emissions. If industries do not meet the restrictions, harsh penalties are carried out. These emission restrictions work as a legal hurdle for industries, but it also strengthens the case for modern WtE technology that can reduce industrial emission (Damanhuri, Handoko, & Padma, 2013).
New regulations are prepared by the Ministry of environment that imposes stricter control on handling industrial waste. The new regulation will oblige industries to require documents stating their abilities to treat hazardous waste before they can collect or manage it (Rawlins, Beyer, Lampreia, & Tumiwa, 2014).
2.2.3.3. Import duty and VAT exemption, Income tax reduction for
renewable energy projects
To promote renewable technology such as WtE incineration solutions the Ministry of Finance enacted import duty exemptions on machinery and capital used for renewable technology in 2010. This fiscal policy also reduces the net income tax by 5 % of the investment value over six years, when investing in the renewable sector. Other fiscal incentives for renewable energy technology are: accelerated depreciation which will reduce income tax paid by investors, income tax reduction for foreign investors allowing them to pay only 10 % on dividends, and compensation for losses for foreign investors (Damuri & Atje, 2012).
30
2.2.3.4. National action plan for GHG emission reduction
In 2009, the Indonesian government committed to reduce the nations GHG emissions by 26 %, with national effort, and 41 %, with help from other countries, by 2020 compared to 2009 emission levels. To achieve this goal the National action plan for GHG emission reduction was formed. This plan defines targets for the renewable energy sector as well as for the waste sector to reduce GHG emissions. The targets states that renewables should generate 30.9 % of the nation’s electricity by 2030, and at least rise its capacity by 10 GW to 2025. The waste sector has to reduce its GHG emissions by 78 Mt CO2 to reach the 41 % GHG reduction target (Rawlins, Beyer, Lampreia, & Tumiwa, 2014).
2.2.3.5. Feed-In-Tariff for small and medium scale renewable energy,
including WtE
To be able to meet the renewable energy targets the Ministry of Energy and Mineral Resources, MEMR stated a new regulation in 2012 to support decentralized renewable energy generation. The regulation works as an incentive by increasing the Feed-in-tariffs for renewable electricity. The regulation is only adapted for small and medium renewable energy plants, including WtE technology. The tariff levels vary depending on region, technology and voltage of the connecting grid (Rawlins, Beyer, Lampreia, & Tumiwa, 2014).
31
3.
Waste-to-energy technology
Waste-to-energy, WtE technologies can convert the energy content in different kinds of waste into various form of valuable energy. Power can be generated and distributed through national and local grid systems. Heat or steam can be produced and transported through a district heating system or used in industries and for specific thermodynamic processes. Several kinds of biofuels can be
extracted from organic waste, fuels that after refining can be sold on the market. Other benefits from WtE technologies are the reduction of waste volume, reduction of land used for landfills, and
reduction of the environmental impact landfills have on the environment (World Energy Council, 2013).
Different WtE technologies produce different energy output and the feasibility of the technology depends on the waste composition and the waste flow. Every technology has its advantages and disadvantages. No technology will provide a universal solution that is always best suited for a local area. Each case has to be analysed with regards to the available waste as well as the demanded output and the social impact the technology has on the region (Rawlins, Beyer, Lampreia, & Tumiwa, 2014).
The WtE technologies can be divided into two categories, shown in Figure3-1. These categories are chemical conversion technologies and thermal processing categories.
Figure 3-1 Waste-to-energy technologies (Rawlins, Beyer, Lampreia, & Tumiwa, 2014)
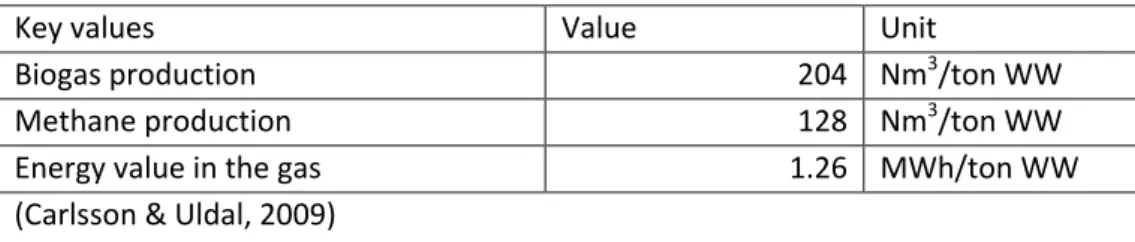
The chemical conversion technologies consist of bio-chemical decomposition of organic waste. This decomposition creates biogas which can be burned for direct heat and power use, or refined to biofuels. The main chemical conversion methods are anaerobic digestion and landfill gas recovery (Rawlins, Beyer, Lampreia, & Tumiwa, 2014).
Thermal processing technologies involve combustion of solid waste to generate energy. The combustion generates heat that can be used directly or converted into electrical energy. The most common technology of this kind is conventional incineration. More advanced technologies such as pyrolysis and gasification can produce a more versatile range of products such as syngas, liquid and solid fuels, heat and electricity. These advanced technologies are in the early stages of commercial development (Rawlins, Beyer, Lampreia, & Tumiwa, 2014).
In the sections below the anaerobic digestion and conventional incineration are explained more in detail since these are the technologies that are going to be investigated and modelled in the Kutai Kartanegara region.
32
Waste incineration
3.1.
Waste incineration is the most established technology for waste-to-energy recovery. According to Coolsweep (2012) around 2,000 conventional incineration plants are in service today, and together they have a capacity to process 100 million tons of waste per year. The energy recovery process in an incineration plant is simple. Through combustion of waste heat is generated, which is used to
produce steam. The steam can, depending on the local demand either be used to generate only electricity or heat. To increase the efficiency both heat and electricity can be generated in a
combined heat and power plant, CHP. Depending on technology the net electrical efficiencies varies from 17 to 30%, while CHP plants have energy efficiencies as high as 80 % (Coolsweep, 2012).
The waste used in incineration is a combination of industrial, agricultural and municipal waste, where especially the organic part in agricultural and municipal waste has a lower calorific value due to its high moisture content (Bisaillon, Sahlin, Johansson, & Jones, 2014). Therefore the mixture of waste can have a range of calorific value from 5 MJ/kg to 15 MJ/kg, while for example coal has a calorific value of around 25 - 30 MJ/kg (Alvarez, 2006).
Figure3-2 shows an overview of an incineration process in a CHP plant. The following sections will go through the main steps of this process in detail.
Figure 3-2 Overview over an incineration plant (Coolsweep, 2012) 3.1.1.Furnaces
There are two main types of furnaces in CHP plants where waste is the fuel. These are the moving grate incinerator and the fluidized bed.
3.1.1.1. Moving grate
The moving grate incinerator technology is the most used WtE technology thanks to its durability and ability to process a variation of waste composition.
A crane feeds waste to the moving grate from a storage bunker, where the waste has been mixed and stored. The grate consists of separate moving parts that slowly move the waste further into the incinerator. During the transportation on the moving grate the waste is evenly distributed and dried
33
before combustion. When the dried waste reaches the incinerator combustion takes place (Coolsweep, 2012).
The combustion process is a chemical reaction between elements in the waste fuel and oxygen from the input air. During combustion flue gas is formed and heat is released. Dross is a residue from the combustion process that consists of non-combustible or unburned parts of the fuel (Alvarez, 2006). Disposal of dross and other residues is explained in Section 3.1.4. A simple figure of the combustion process is shown in Figure 3. Formulas for the chemical reactions are shown in Equation 1 and 3-2 (Alvarez, 3-2006)
Equation 3-1
𝐶 + 𝑂2 = 𝐶𝑂2 + ℎ𝑒𝑎𝑡 Equation 3-2
2𝐻2 + 𝑂2 = 2𝐻2𝑂 + ℎ𝑒𝑎𝑡
To get a full and efficient combustion it is vital to have a high temperature, sufficient access of oxygen and a steady circulationof the waste. It is also important to maintain a constant supply of fuel. If the combustion is incomplete it produces undesirable emissions like carbon monoxide and hydrocarbons, it also lowers the efficiency (Alvarez, 2006).
To get a close to complete combustion, air is supplied through the gate from below. This air supply has the purpose to oxygenate the waste as well as to cool down the grate. Secondary combustion air is also supplied straight to the incinerator through nozzles above the grate. This air is supplied to improve turbulence and give a surplus of oxygen to ensure a full combustion (Alvarez, 2006).
Figure 3-3 Combustion process in a moving grate (Lahl, 2012)
In order to ensure proper breakdown of toxic organic substances the flue gas has to be at least 850°C for at least two seconds (European Commission, 2006). According to Alvarez (2006) this temperature is reached when it is 1,300 °C in the furnace. There are auxiliary burners in the furnace that make sure that the temperature is reached if the calorific value of the waste is not high enough to maintain the desired temperature (Coolsweep, 2012).
The hot flue gas is cooled by the steam boiler, where the heat from the flue gas is exchanged for steam production. After the heat exchange the flue gas is passed to the flue gas cleaning system,
34
before leaving the chimney. The produced ash and slag is transported on the moving grate until it is tipped out to the bottom ash container (Alvarez, 2006).
The capacity of moving grate plants can vary significantly both in terms of waste input and energy output, a typical capacity is around 30-40 ton/hour (Coolsweep, 2012). Moving grate plants have a lower investment cost, but also lower efficiency compared to other incineration technologies. The main advantages with the moving grate are the capacity to handle waste that has not been pre-treated and its ability to accommodate large variations in waste composition and calorific value (Rawlins, Beyer, Lampreia, & Tumiwa, 2014).
3.1.1.2. Fluidized bed
In a fluidized bed the incineration process is done in a bed of sand and waste. The waste is reduced into small particles that are used in the furnace. Combustion air is blowing through the bed from below to transform the bed into a liquid-like state, waste particles are added and mixed with the sand as it is combusted. The temperature in furnaces of this kind is usually around 900 oC. Bubbling fluidized bed and circulating fluidized bed are the two main types used for commercial use (Alvarez, 2006). A circulating fluidized bed boiler is shown in Figure3-4.
For waste streams with a homogeneous calorific value the fluidized bed technology gives a higher efficiency compared to the moving grate technology. On the contrary the fluidized bed technology cannot process waste feedstock with a wide variety of quality or high moisture waste in an efficient manner. It also requires pre-sorting and shredding of the waste feedstock, which tend to increase the operating cost compared to the moving grate technology (Alvarez, 2006).
35
3.1.2.Steam
The main purpose of a CHP is to generate steam that can be converted into electricity and heat through a steam turbine or heat exchanger (Alvarez, 2006). The following sections will briefly explain the steam production process and the steam cycle in a CHP plant.
3.1.2.1. Steam Boiler
The steam is generated in the boiler where feed water is vaporized through heat exchange with the flue gas. The process can be explained through the following steps in
Figure 3-5. (1) Feed water is pumped to an economizer where the water is preheated before the boiler during constant pressure. (2) The heated water is vaporized in the evaporator before the generated steam (3) increases its temperature in a super heater. When the over-heated steam has been used to generate electricity in a steam turbine it can be (4) reheated in an intermediate super-heater. By controlling the super heater and re-heater one can get desired steam properties. (5) The combustion air used in the incineration of waste is also pre-heated in the steam boiler to make the combustion process more effective. All of the energy that is used for vaporization of feed water and heating of combustion air comes from heat energy generated by waste
incineration in the combustion process (Alvarez, 2006).
Figure 3-5 Steam Boiler
3.1.2.2. Steam Cycle
The steam generated in the steam boiler can be used in different ways to generate energy. In a CHP plant the steam is used to produce both electricity and heated water. The hot water could then be used to produce district cooling with absorption cooling technology (Alvarez, 2006).
Rankine Cycle
The Rankine cycle is a thermodynamic cycle describing one of the most common steam cycles. A thermodynamic cycle is when a system goes through a set of steps with heat or work exchange with the environment and then returns to its initial state. The Rankine cycle is used to theoretically determine the efficiency of a turbine system. The Rankine cycle may use different types of working fluids where water is the most common one (Alvarez, 2006).
The single Rankine cycle contains four different steps before returning to the initial state, see Figure 3-6;
1. The cold working fluid in the initial state is pressurized at constant entropy.
2. The liquid is heated at constant pressure in in the boiler by an external heat source. The outcome is saturated dry vapor.
3. The vapor is expanded at constant entropy over a turbine, generating electricity. 4. The steam is being condensed at a constant pressure to a cold liquid, and the cycle is
36
Figure 3-6 TS - Diagram of the rankine cycle (Wikipedia, 2015)
In reality there are no isentropic processes, there are always small losses. In order to make calculations easier, usually isentropic processes are approximated before applying an efficiency factor that describes how close to an isentropic process the real process really is (Alvarez, 2006). Usually there are more than four steps in the cycle. The energy outtake is usually divided into two parts with an overheating process between them and the working fluid could be heated with excess heat before entering the boiler (Alvarez, 2006).
The ideal thermodynamic cycle is called the Carnot cycle and has no losses. It represents the maximum energy that could be extracted from a thermodynamic process. The highest possible theoretical efficiency is called the Carnot efficiency (Alvarez, 2006).
3.1.2.3. Absorption cooling
The absorption cooling process works like any other cooling machine around the principle that cooling is the same as removing heat. The difference is that there is no compressor in an absorption machine. The compressor work is instead being done by input heat and the heat removed in this process is the face change energy for the cooling medium (Alvarez, 2006). The system consists of four steps illustrated Figure 3-7:
37
Figure 3-7 Absorption cooler single stage (Simons boilers, 2015)
1. A generator where the input power in form of heat separates the refrigerant from the desiccation liquid, this is done by boiling the solution.
2. The refrigerant gas is lead to a condenser where it is condensed to liquid form after the separation.
3. The refrigerant is then lead to the evaporator where it is being sprayed onto the chilled water. The pressure in the evaporator is low, close to a vacuum. This is necessary for the phase shift process to take place at a lower temperature. When the refrigerant evaporates it “steals” the heat for the phase change from the water, hence cooling it.
4. The evaporated refrigerant is again condensed into liquid and then the concentrated desiccation fluid is used to absorb the refrigerant. The desiccation fluid is very hydrophilic and this reaction will keep the pressure low in the evaporator.
The desiccation/refrigerant solution is then pumped or led by circulation heating back to the generator. The absorption machine needs a cooling flow in the condenser and the absorber. This is used to condensate the refrigerant and to take away the excess heat from the forming reaction (Alvarez, 2006). The COP or coefficient of performance is between 0.4 and 0.7 for an ammonia / water absorption machine (Alvarez, 2006).
38
3.1.3.Flue gas cleaning
When the flue gas has exchanged the majority of its heat in the steam boiler, it has to be cleaned from pollutants that are produced during combustion. There are two types of pollutants in the flue gas: dust and gaseous emissions. Typical pollutants in dust form are fly ashes and heavy metals, while NOX, SOX and HCl are in gaseous form (European Commission, 2006).
The content of pollutions in the flue gas depends mainly on the waste composition, but also on the quality of the incineration process. To reduce emissions into the environment the flue gas has to be cleaned and treated. There are five main groups of methods that are used for treating the flue gas from pollutions. These are: particle filters, dry treatment and semi-dry treatment, wet treatment and NOX treatment (Alvarez, 2006).
3.1.3.1. Particle filters
To get rid of the dust particles in the flue gas, different kind of particle filters can be used. This method deals only with the particle issue while the gaseous emission problems remain.
Cyclones: In a cyclone the larger particles in the flue gas is whirling in a circular motion and hit the walls of the cyclone due to the centri