DOI: 10.12928/TELKOMNIKA.v14i2A.4379 44
Inversion of Forest Leaf Area Index Based on Lidar
Data
Zuowei Huang1,2, Yu Zou1 1
School of Architecture and urban planning, Hunan University of Technology, Zhuzhou 412008, China
2
School of Geosciences and Information-Physics, Central South University, Changsha 410083, China *Corresponding author, e-mail: [email protected]
Abstract
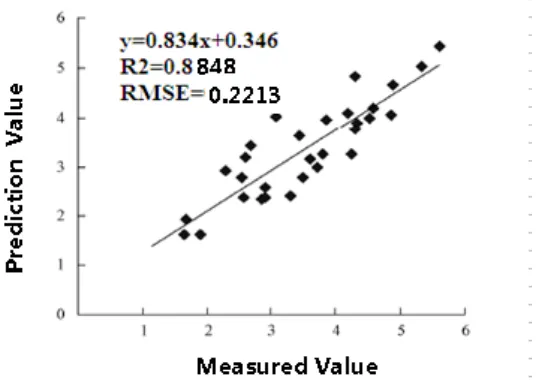
Leaf area index (LAI) is an important parameter of vegetation ecosystems, which can reflect the growth status of vegetation, and its inversion result has important significance on forestry system. The inversion values of forest LAI exists a certain deviation using traditional method. The airborne LiDAR technology adopts a new type of aerial earth observation method and makes it possible to estimate forest structural parameters accurately. In order to improve the estimation precision of leaf area index (LAI) of forest canopies, an analyzing method based on Lidar datawas proposed in this paper. Firstly it conducts data filtering and calibration techniques, then relevant flight experiment and LAI inversion principle are introduced. Finally the inversion model was optimized based on statistic analysis method. LAI map well reflected spatial distribution pattern of LAI in experiment fields. The coefficient of determination (R2) and root mean square error (RMSE) were selected as testing indicators to analyze the inversion results. According to our validation data, the related result showed that the established model was workable, forest LAI estimation are very close to the field-measured, And inversion results with measured LAI has a good consistency, shows high accuracy (R2=0.8848,RMSE=0.2213), which provides a new method to estimate LAI with large regional scale.
Keywords: Leaf area Index, Lidar data, discrete points cloud, laser penetrate index, statistic analysis
Copyright © 2016 Universitas Ahmad Dahlan. All rights reserved.
1. Introduction
Leaf area index (LAI) is defined as the single-side leaf area per unit ground area, which is an important biological parameter reflecting crop growing, providing structured quantitative information for describing the procedure of matter and energy exchange on plant canopy surface, It could represent the capability of vegetation for photosynthesis, respiration and transpiration, and become a primary parameter for characterized leaf density and vegetation structure, and plays a key role in the researches associated with vegetation biophysical activities. So it is a critical parameter in process-based models of vegetation canopy response to global environmental change, Many researchers have conducted studies on LAI trends of different ecosystems and their relationships to climate change at various methods. Although researchers have already worked out some retrieval algorithms of LAI, there is still a long way to go, for instance, retrieval accuracy and adaptability by single remote sensing sensor data. As a hotpot remote sensing technology, remote sensing has been proved great potential on LAI inversion. The traditional methods of forest parameters measurement have some limitations in large scale due to the direct measurement capability with high precision on the forest vertical structure.
combining Lidar data with optical, multi-angular and microwave remote sensing data is an effective inversion way of canopy height and biomass in regional scale [1-4].
2. Study Area and Data 2.1. Study Area
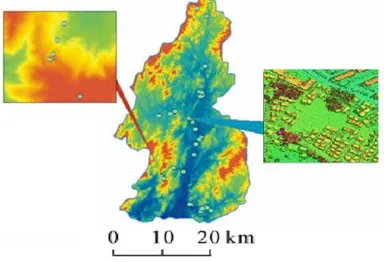
The study area is the Xinling district located near Shaoyang City, Hunan Province, 4.25 km from the city center, belongs to the low mountain hilly terrain, with a typical hilly landscape and a significant temperate continental monsoon climate, having high temperature and concentrated rainfall in summer. The altitude is about 260-550m. The frost-free period reaches 300-330d. The study area is about 5648 Ha, it mainly composed of artificial forest and secondary natural forest. Main vegetation includes red pine, Pinus sylvestris, Camellia oleifera, barley, and yellow pineapple, etc. Figure 1 is the research area and validation sample areas. The spatial distribution of the crown structure has important significance in forestry, it using ground-based light detection points cloud for crowns in the field.
Figure 1. Location of research area and sampling sites
2.2. Data Acquisition
The data was acquired on on May 31, 2013; the laser scanner is ALS70, with laser wavelength of 1064 nm, and laser pulse length of 3.0 ns, and laser beam divergence of 0.3mrad. Point cloud data uses WGS84 coordinate system, and a universal transverse Mercator (UTM) projection. It can record three echo pulses: the first, the last echo pulse echo pulse and single echo pulse. The relative height of flying altitude was 850 m above the ground and the footprint diameter is about 0.28 m. which is small so that the pulse can easily get through some sparse farmland and completely reach the ground.
3. Method
3.1. Data Processing
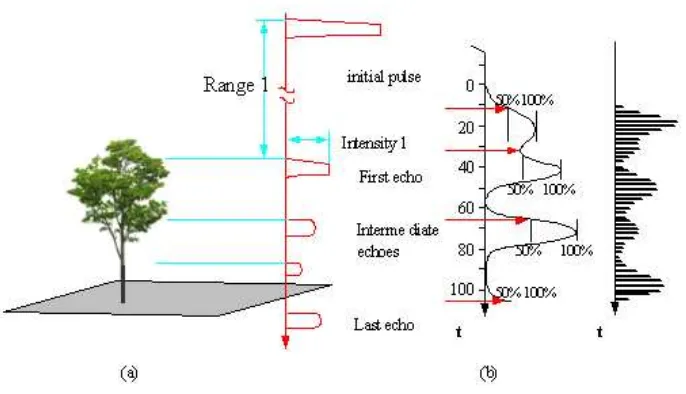
In this paper, both multiple echo and full waveform data are used. The base principle is shown in Figure 2. Figure (a) is multiple echo of point cloud. Figure (b) is full waveform diagram. Figure (c) is digital waveform diagrams. Relative to the discrete point cloud data, the waveform data can store all the echoes returned laser pulses, which play an increasingly important role in the later analysis. The system records three types of echo, firsr echo, last echo and single echo, with point density of 0.98 points per square meter. The full waveform data contains information about the scanning angle, time interval between launch wave and reflection wave. Raw data contains a large number of gross errors or irrelevant information, such as data produced by local terrain mutation, reflected signal resulted from flying birds or other moving objects, or other local empty formed by no echo. In the data pre-processing, the data process software provided by equipment supplier should use artificial interactive editing to ensure the accuracy of terrain model and vegetation model generated later. The GPS carried by aircraft and DGPS on the ground positioned in real time during the flight for unifying. Images are another data source that we can employ. It provides information about objects contours and layout, which will improve the visualization effects.
Figure 2. The schematic diagram of multi-echo and full waveform
principle is that a complex object will be divided into several simple units. The three-dimensional structure of hexahedron is regarded as the basic finite unit.
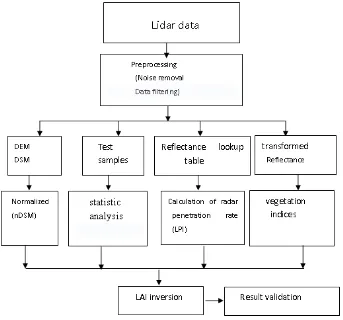
Figure 3. Data processing flow
3.2. Theoretical Principle of LAI
Point cloud intensity is influenced by many factors, such as reflectance of the target, target-sensor distance, scanning zenith angle, and atmospheric condition. This research are completed in the same conditions, and the plane as the level flight, so that the parameters is the same, such as no change, According to Wagner (2006), the received energy can be specified by:
(1)
where Er and Et are the received and transmitted laser energy respectively, R stands for the sensor-target distance, t stands for the laser-beam divergence, Dr stands for the diameter of the receiver aperture, stands for the reflectance of the target surface, k1 and k2 stands for the system and atmospheric transmission factors, respectively, and As the illuminated target area.
In order to evaluate the precision of leaf area index (LAI), reflectance data were collected with ASD at two sampling sites, vegetation indices (NDVI, SAVI, SR) were applied to regress against LAI, canopy reflectance were transformed with wavelet analysis, and extracted wavelet energy coefficient were applied in regression model for LAI estimation. Transforming the point cloud into grid, when there have multiple points, using the max value as the pixel-value. Then getting resolution DSM is 0.8 m. After extracting valid waveforms data, smoothing
2
1 2 4 2
4
t rS t
E D
Er
A k k
filtering was realized by using a gauss filter which width was the same as the laser pulse width. The background noises in the beginning and end of phase were estimated using the histogram method [11-15] and the features parameters (mean value and standard deviations) were also calculated. Then the waveform was fitted effectively by Levenberg Marquardt nonlinear method, and the wave peak position of the ground and forest canopy was determined by gauss wave decomposition.
The vertical structural information obtained by LiDAR data, which helps in removing the interferences of forest gaps and other non-forest pixels as well as in extracting the canopy subsets. In addition, training samples can be easily extracted at a certain tree height of different species in the spectrum space. Therefore, based on the canopy subsets as well as the combined spectral differential and curve matching techniques,an automatic extraction method of training samples is realized. DEM is generated using TIN interpolation method with the ground point data classified. Then, the elevation values of vegetation points are normalized by DEM to remove the terrain elevation, so that the height values of vegetation points are the heights relative to the ground. After gaining the ground points, it uses the GPS software to generate and interpolate the ground points into 1 m resolution DEM [16-20].
Generating the canopy height model (CHM) by DSM minus DEM. For a 5×5 window, if the central pixel is the minimum, let the pixel value equal to the average of the window. Furthermore, according to prior knowledge, if the CHM is less than 2.2 m, the points in the grid are the points. And then, we can get the Lidar points in the forestland. It divided the study area into 4 m×4 m grids, where there may be a number of (n) ground echoes, and the gap fraction (fgap) one grid then can be approximated by:
(2)
Where Ig and Imax represent the intensity, n is the count of points in one grid, Ig and Rg are the gap fraction, the intensity and the sensor-target distance of the j th ground echo, respectively. Through a TIN interpolation, and then an ortho-rectification of data was conducted to eliminate the image deformation caused by the terrain. For the same spatial resolution of 2 m,20 points which were located along the road or flat area, were using the TerraScan to ,
extract the ground points in the corn field [21-22]. According to the longitude and latitude, the intensity and sensor-target distance R of every point can be gained. As usual, the points in the middle of the classification results can be considered as the pure pixels, considering the maximum likelihood classification’s accuracy and features. For the huge number of points, we choose the first one hundred points. The probability of photons directly reaching the ground represents canopy transmittance:
(3)
where λ0 stands for Nilson parameter considering vegetation clumping effect, G is the mean projection of a unit of leaf area into the plane perpendicular to the incident laser direction, µ is the cosine of the zenith angle. Canopy transmittance (T0) equals to the gap fraction as follow:
(4)
Where µ can be calculated by the scanning angle. G can be inferred from the prior knowledge, Accordingly, LAI can be calculated as follow:
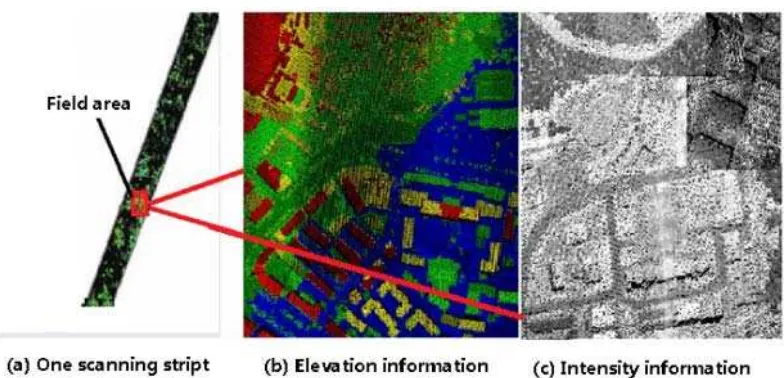
Figure 4. The strip distribution of the flight
Figure 5. The height and intensity information of one plot
4. Result Validiton and Analysis 4.1. Flight Experiment
4.2. Parameter Optimization for Inversion Model
For most of plants, the leaf area increases with the plant height during the vegetation growth. For different species and varieties of crops, the relationships of conversion between crop height, fraction of coverage and LAI was proposed by Zhang (1996). Data classification and extraction of vegetation and ground point are under different scales of a number of ground points and vegetation points. Finally calculate the laser radar penetration index and inversion calculation on LAI. The sampling data, LPI were calculated for each sample under various scales, LPI is laser penetrate index:
0
Where L stand for the leaf area index, I stands for the canopy light intensity, I0 is above the canopy light intensity, k is the extinction light coefficient, depending on the direction of the leaf inclination Angle and the beam of light, light beneath the canopy is available. LPI instead of I/I0, (1 /LPI) containing the intercept of the regression analysis with the measured LAI, inversion model based on the statistic analysis of the feature variables.
The feature variables of LiDAR include: canopy height model (CHM), intensity, the mean height (Hmean), the maximum height (Hmax), the minimum height (H min), the percentile of the canopy height distributions (H25th, H50th, H90th) and LPI. In order to establish the optimal model of LiDAR-LAI prediction, it select a high correlation between LAI and LiDAR parameters, and extract the LiDAR vertical structure parameters of the same location. and the measured LAI values for correlation analysis, if the correlation coefficient absolute value is greater than 0.3, then select it as the input parameters, the Correlation of LiDAR metrics and field measured LAI results are shown in table1.
Table 1. Correlation of LiDAR metrics and field measured LAI
LAI H50th H90th Hmean H max H min fgap LPI intensity
According to the results of correlation analysis in table 1, then select the fgap ,intensity, LPI, H90th as input variables for LiDAR-LAI estimation model. By the prior knowledge, LPI is inversely proportional to LAI, The value is larger, the smaller the leaf area index, according to the penetration index Formula, vegetation canopy echo is large, forest canopy structure is complex, the smaller the LPI. LAI is larger, therefore the LPI is negatively correlated with LAI; the greater the of fgap vegetation, namely Coverage is lower, the smaller LAI; the intensity is larger Area, the larger LAI. The intensity of point cloud was positively related with LAI.
In the study,15 samples was selected randomly from 30 the measured samples, as input data, the remaining 15 samples as validation data, taken the ground data as the dependent variable, the above four LiDAR parameters as variables, multiple regression model is established. Through regression analysis with the above four LiDAR parameters, the inversion model was constructed by the regression model is depicted as:
90th
5.34
4.34
0.05
pap1.78
0.03H
4.3. LAI Inversion Result Analysis
The main software: LiDAR_Pro, TerraScan,matlab2009a, Erdas Imagine9.2, VTK platform, VTK to finish the experiment in VC++ platform and combining the construction of visualization class library. It carries on the regression analysis and the measured LAI, calculate the value of correlation coefficient (R2) and root mean square error (RMSE), High R2 indicates the high correlation between variables and independent variables. RMSE between the true values and predicted values is also an indicator. The value is smaller, the better the effect of predication. This is a test on the effect of regression linear superposition. The study of correlation between forest height, LAI and coverage can provide a theoretical basis and reasonable physical and biological meanings for the space extrapolation of forests canopy height.
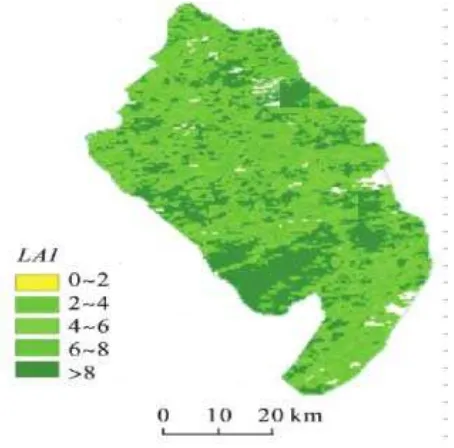
Through the above inversion method, the inversion map of LAI in the study area is shown in Figure 6, it can be seen that the inversion result of forest coverage was consistent with the vegetation distribution in the study area. Comparisons of LAI between those derived from Lidar and field measurements (Table 2), it is showed that the LAI of Lidar and filed data agree well, and only that the 3th plot has a relative large error. The retrieval error of fractional cover will transfer to LAI. Results show that based on airborne and spaceborne LiDAR data LAI inversion accuracy is higher than that of the corresponding optical remote sensing inversion accuracy.
Figure 6. The inversion map of LAI in the study area
Table 2. Comparisons of LAI between those derived from Lidar and field measurements
Plots
Lidar results Field measurements
Absolute error
Relative error/% Average Standard
deviation
Average Standard deviation
1 0.350 0.232 0.045 0.048 0.034 0.459 2 0.330 0.030 0.625 0.000 0.005 0.800 3 0.289 0.138 0.634 0.062 0.045 1.833 4 0.343 0.024 0.458 0.035 0.055 8.265
be better applied to the quantitative inversion of other forest biophysics parameters. LiDAR data offer a new way to accurately estimate forest LAI. Especially, satellite borne LiDAR data open the possibility of global forest LAI estimation with high accuracy.
Figure 7. The relationship of measured value and Predicted value
5. Conclusion and Discussion
LAI is very often a critical parameter in process-based models of vegetation canopy response to global environmental change, for numerous studies of interaction of atmosphere and vegetation, rapid, reliable and objective estimations of LAI are essential. Therefore, this paper was applied to establish a model with simpleness, practicality and high accuracy based on the all structure of the ground component in order to realize the fast, efficient remote sensing estimation of vegetation leaf area index. High-precision the mixed-pixel clumping index is very important for the accuracy improvement of LAI product. Until now, there is no parameter to describe the clumping effect at pixel scale effectively. In mixed pixels, the clumping index is usually estimated with the dominated vegetation type without considering the heterogeneity inside the pixel although sometimes it can be neglected. This method may cause large uncertainty. For the reasons above, it is necessary and urgent to define MPCI and propose the calculation method. The algorithm for MPCI calculation proposed in this paper considers the influence of the mixed-pixel heterogeneity. In the further study, we will validate and compare our MPCI result and generate the product at a large scale. The products can be used for LAI correction and improve the accuracy. LiDAR is one of the most promising technologies in forestry, which shows potential for timely and accurate measurements of forest biophysical properties. Some studies show that the relationships between forest biophysical properties and airborne laser scanner data are different for the different geographical location, species composition, site quality, etc. In the case that remote sensing becoming more popular, the LiDAR technology has increasingly being used in the forestry as a new means of remote sensing. Many researchers have focused on LAI estimation using LiDAR data and explored the method of LAI retrieval based on LiDAR data. In the future, Lidar will have extensive applications for precision agriculture and other agricultural production.
Acknowledgements
References
[1] Walthall CL, Dulaney WP, Anderson M, et al. Alternative approaches for estimating leaf area index (LAI) from remotely sensed satellite and aircraft imagery. Bellingham: SPIE-INT Soc Optical Engineering. 2004: 241-255.
[2] Abdar M, Kalhori SRN, Sutikno T, Subroto IMI, Arji G. Comparing Performance of Data Mining Algorithms in Prediction Heart Diseases. International Journal of Electrical and Computer Engineering (IJECE). 2015; 5(6): 1569-1576.
[3] Wang YJ, Woodcock CE, Buermanna W, et al. Evaluation of the MODIS LAI algorithm at a coniferous forest site in Finland. Remote Sensing of Environment. 2004; 91(1): 114-127.
[4] Dong LX. Estimation of the Forest Canopy Height and Above ground Biomass Based on Multiplicatel Remote Sensing in Three Gorges. Beijing: Institute of Remote Sensing Applications Chinese Academy of Sciences (CAS). 2008; 56–98.
[5] K Firdausy, T Sutikno, E Prasetyo. Image enhancement using contrast stretching on RGB and IHS digital image. TELKOMNIKA (Telecommunication Computing Electronics and Control). 2007; 5 (1): 45-50.
[6] Bao YF, Cao CX, Zhang H, Chen EX, He QS, Huang HB, Li ZY, Li XW and Gong P. Synchronous estimation of DTM and fractional vegetation cover in forested area from airborne LIDAR height and intensity data. Science in China Series E Technological Sciences. 2008; 176-187
[7] Chen Hanyue, Niu Zheng, Huang Wenjiang, et al. Estimation of winter wheat LAI using hotspot-signature vegetation indices. Transactions of the CSAE. 2012; 28(1): 167-172.
[8] Wanger W, Ullrich A, Ducic V, et al. Gaussian decomposition and calibration of a novel small-footprint full-waveform digitising airborne laser scanner. Isprs Journal of Photogrammetry and Remote Sensing. 2006; 60(2): 100-112.
[9] Yang Guijun, Huang Wenjiang, Wang Jihua, et al. Inversion of forest leaf area index calculated from multi-source and multi-angle remote sensing data. Chinese Bulletin of Botany. 2010; 45(5): 566-578. [10] Chen Chong, Zhu Yanjun, Li Xianfeng, et al. The applicability of different methods for retrieving leaf
area index of forests in red soil hilly regions. Acta Agriculturae Universitatis Jiangxiensis. 2011; 33(3): 508-513
[11] Cheng Q, Huang JF, Wang RC, Tang YL. Analyses of the correlation between rice LAI and simulated MODIS vegetation indices, red edge position. Transactions of the Chinese Society of Agricultural Engineering. 2013; 19(5):104-108.
[12] Soni RA. A Study on Android Application Development. Journal of Telematics and Informatics. 2013; 1(2): 89-96.
[13] Clevers JGPW. Application of a weighted infrared-red vegetation index for estimating leaf area index by correcting for soil moisture. Remote Sensing of Environment. 2012; 29(1): 25 -37.
[14] Morsdorf F, Frey O, Meier E, et al. Assessment of the influence of flying altitude and scan angle on biophysical vegetation products derived from airborne laser scanning. International Journal of Remote Sensing. 2008; 29(5): 1387-1406.
[15] Wei R, Shen X, Yang Y. Urban Real-Time Traffic Monitoring Method Based on the Simplified Network Model. International Journal of Multimedia & Ubiquitous Engineering. 2016; 11(3): 199-208.
[16] Zeng QH, Mao JH, Li XH, Liu XF. Plannar filtering algorithm for LIDAR points cloud. Geomatics and Information Science of Wuhan University.2008; 33(1): 25–28.
[17] Zhang Y, Meng QY, Wu JL, Zhao F. Study of environmental vegetation index based on Environment Satellite CCD data and LAI inversion. Spectroscopy and Spectral Analysis. 2011; 31(10): 2789-2793. [18] Zeng QH, Mao JH, Li XH, Liu XF. Plannar-fitting filtering algorithm for LIDAR points cloud. Geomatics
and Information Science of Wuhan University. 2008; 33(1): 25–28.
[19] Colombo R, Bellingeri D, Fasolini D, Marino CM. Retrieval of leaf area index in different vegetation types using high resolution satellite data. Remote Sensing of Environment. 2013; 86(1): 120–131. [20] Li XR, Liu QJ, Cai Z, et al. Specification leaf area and leaf area index of conifer plantations in
Qianyanzhou station of subtropical China. Journal of Plant Ecology. 2007; 31(1): 93-101.