ii
DECLARATION
“I hereby declare that the work in this thesis is my own except for summaries and quotations which have been duly acknowledged.”
SIGNATURE : ……….
AUTHOR : AISYAH BINTI MOHAMAD JUSOH
iii
iv
ACKNOWLEDGEMENT
I would like to express my deepest appreciation to all those who provided me the possibility to complete this thesis. A special gratitude I give to my final year project Supervisor, Engr Muhammad Zulfattah Bin Zakaria, and to my second supervisor Dr. Tee Boon Tuan whose contribution in stimulating suggestions and encouragement, and helped me to coordinate my project especially in writing this thesis.
v
ABSTRACT
vi
ABSTRAK
vii
viii
TABLE OF CONTENT
DECLARATION ... ii
ACKNOWLEDGEMENT ... iv
ABSTRACT ... v
ABSTRAK ... vi
TABLE OF CONTENT ... viii
LIST OF FIGURE ... xi
LIST OF TABLE ... xii
LIST OF APPENDIX ... xiii
CHAPTER 1 ... 1
INTRODUCTION ... 1
1.0 PROJECT BACKGROUND ... 1
1.1 PROBLEM STATEMENT ... 4
1.2 OBJECTIVES ... 5
ix
CHAPTER 2 ... 1
LITERATURE REVIEW ... 1
2.0 INTRODUCTION ... 1
2.1 DUTCH EMISSION INVENTORY ... 2
2.2 U.S EPA ... 3
2.3 ARB’S EMISSION INVENTORY (AIR RESOURCES BOARD) ... 6
2.4 CORINAIR 2013 (CORe INventory AIR emission ... 7
2.4.1 TOP-DOWN APPROACH ... 7
2.4.2 BOTTOM-UP APPROACH ... 8
2.4.3 COMBINED APPROACH ... 8
2.5 SOURCE OF METHOD IN CORINAIR ... 9
2.5.1 CASE SUDY IN CHIANG MAI, THAILAND ... 10
CHAPTER 3 ... 12
METHODOLOGY ... 12
3.0 INTRODUCTION ... 12
3.1 GANTT CHART ... 13
3.2 FLOWCHART ... 13
3.3 DETAILED PROJECT ... 13
3.4 CORINAIR 2013 ... 14
3.5 TIER 2 ... 15
3.6 AREA SOURCE ... 17
3.7 CALCULATION ... 18
3.8 SURVEY ... 19
x
3.10 THE COMPARISAN OF THE METHOD ... 22
CHAPTER 4 ... 23
RESULT AND ANALYSIS ... 23
4.0 INTRODUCTION ... 23
4.1 CALCULATION FOR THE PRODUCTION OF NMVOC AT GARAGES ... 26
4.2 DATA ANALYSIS ... 29
4.3 DISCUSSION ... 30
CHAPTER 5 ... 35
5.0 CONCLUSION ... 35
5.1 RECOMMENDATION ... 36
REFERENCES ... 37
APPENDIX A ... 39
xi
LIST OF FIGURE
Figure 1.1: The region under administrative of MBMB
(http://www.mbmb.gov.my/warga-mbmb) ... 2 Figure 1. 2: The image of the spray painting process of the car at the garage (http://www.pandorapigments.com) ... 4 Figure 1. 3: The air quality index level that used by U.S EPA (Williams & Kilaru, 2014) ... 5
Figure 3. 1: The picture of pigment as the ingredient contained in the paint solvent (in the middle), The example of paint solvent that used for spray painting car ( right), the binder contains in paint (left) (http://www.pandorapigments.com) ... 20 Figure 3. 2: Shown the layout of Mapinfo as the method to plot the region... 21
xii
LIST OF TABLE
Table 3. 1: The type of method used in CORINAIR ... 15 Table 3. 2: Tier 2 emission factors for source category 2.D.3.d Industrial coating application, Car coating ... 16 Table 3. 3: The Comparison Of The Methods Used For Emission Inventory ... 22
xiii
LIST OF APPENDIX
Appendix 1: Gantt chart for PSM 1 ... 40
Appendix 2: Gantt Chart for PSM 2 ... 41
Appendix 3: The flow chart that the task should be managed ... 42
Appendix 4: Categorized for sector 3 in Dutch Emission Inventory Guidelines... 43
Appendix 5: California Greenhouse Gas Emission by Gas (California Environmental Protection Agency, 2014)... 44
Appendix 6: Tier 2 emission factors for source category 2.D.3.d Industrial coating application, Vehicle Refinishing (CORINAIR, 2013) ... 45
Appendix 7: Danny Auto Spray workshop at Bukit Katil ... 46
Appendix 8: shows the filtration system used by spraying and drying booth for car to ensure the pollutants from paints activities is filter before distribute to the fresh air at the outside. ... 46
1
CHAPTER 1
INTRODUCTION
1.0 PROJECT BACKGROUND
Emission inventory can be defined as a database that lists, by source, the amount of air pollutants discharged into the atmosphere of a community during a given time of period. Based on the participant‟s workbook of “Train for Clean Air of Emission Inventory for Smaller cities” emission inventory usually contains two major groups of pollutants. Firstly, greenhouse gases, which consist of carbon monoxide (CO2), methane ( ), Nitric oxide (N2O), fluorinated gaseous compound and etc. Also, the other major pollutant is an air pollutant which involves acidifying pollutants (SO2, NOx, NH3), photochemical smog precursors (NMVOC), particulate precursors, toxic pollutants and carbon monoxide (CO).
2
categories are treated differently in dispersion models. The inventories should also contain geographical information so that emissions can be separated on. This project has only covered for area sources. Area sources can be specified as the stationary sources that are too small or else too numerous to be considered as point sources. The area sources that had been chosen to study the emission inventory for this project is in the History of Melaka Historic City Council (MBMB). MBMB is responsible for over area of 11.47 square miles (303 square kilometers). Figure 1.1 below is the area under administrative of MBMB.
Figure 1.1: The region under administrative of MBMB (http://www.mbmb.gov.my/warga-mbmb)
3
Garages or workshops is define as a workplace that repair all types of automobiles vehicle. There are many types garages today, but the garages that been chosen in this area source case study is the garages that doing coating, painting and spraying or other else known as car repairing and refinishing workshops.
4
Figure 1. 2: The image of the spray painting process of the car at the garage (http://www.pandorapigments.com)
1.1 PROBLEM STATEMENT
5
1.2 OBJECTIVES
1. To determine the total emission of NMVOC contain in paint when doing car repairing or refinishing activities.
2. To analysis the data produced from the site visit.
3. To identify which area has high result of producing NMVOC.
1.3 SCOPE
1
CHAPTER 2
LITERATURE REVIEW
2.0 INTRODUCTION
2
2.1 DUTCH EMISSION INVENTORY
The Dutch Emission Inventory is one of the methods that can be used to measure emission inventory in the Netherlands or else known as Holland. This program was cooperative with other institutes that are responsible towards clean air in the Netherland, which are consist of PBL (Netherlands Environmental Assessment Agency), CBS (Statistics Netherlands), TNO (Netherlands Institute for Applied Scientific Research), Senter Novem, RWS-WD (Water Service, part of the Directorate-General for Public Works and Water Management) and Alterra. (Coenen, 2004)
The purpose of the emission is to create a data set of emission for environment relevant pollutants.. The program always developed due to the estimation of emission for all industrial activities and also included non-industrial sectors such as agriculture, consumers, and waste sector. (Coenen, 2004) The Dutch emission inventory is one of the oldest in Europe and contributed to the development of other inventories European countries. Due to that, the current issues of inventories are difficult to adjust to the new quality of requirement.
3
Based on chapter 5, “Solvent and the Others Product Use (CRF sector 3)” from National Inventory Report 2014 of Greenhouse gas emissions in the Netherlands 1990-2012 on page 97, stated that the element of this case study which is about the paint solvent. Regarding to the sector 3, emissions of greenhouse gases includes indirect emissions of CO2 related to the release of non-methane volatile organic compounds (NMVOC) through the use of solvents and a wide range of other fossil carbon-containing products such as paints, cosmetics and cleaning agents. Furthermore, this sector also includes N2O emissions originating from the use of N2O as anesthesia and as a propelling agent in aerosol cans like cans of cream. But for this program the indirect CO2 emissions from NMVOC are calculated from the average carbon content of the NMVOC in the solvents (Ministry of Health, 2014). But the paint that had been discuss does not related with paint used for car coating at garages. Based on the table in appendix A, it explained about the pollutants that involve sector 3 and also the emission in 2011 until 2012. (Refer in Appendix 4)
2.2 U.S EPA
U.S EPA can be defined as United States Environmental Protection Agency (EPA or sometimes U.S EPA) is an agency of the U.S. federal government which was created for the purpose of protecting human health and the environment by writing and enforcing regulations based on laws passed by Congress.U.S EPA also is one of the programs that used for emission inventory. U.S EPA The U.S. Environmental Protection Agency (EPA) has established a Global Change Research Program (GCRP) in support of the U.S. Global Change Research Program.
4
global climate change on regional air quality, EPA will conduct regional air quality modeling for the year 2050, using the EPA Community Multiscale Air Quality (CMAQ) model, with climate change inputs from regional climate model simulations. (Benjey et al., 2000) Emissions must be projected to the year 2050 in order to capture the direct and indirect effects of changes of biogenic and anthropogenic emissions.(Benjey et al., 2000)
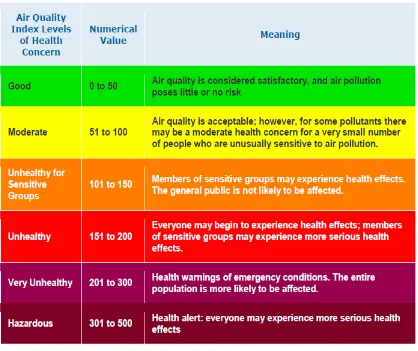
At an early stage of finding, U.S EPA has identified six criteria of pollutants concern which included SO2, PM, ozone (O3), CO, NO2 and lead (Pb). From the criteria, U.S EPA has established primary and secondary for this pollutant. Primary is designed to protect public health and particularly sensitive population, while the secondary is used for public welfare, which includes the environment. (Williams & Kilaru, 2014)
5
Figure 1. 3: The air quality index level that used by U.S EPA (Williams & Kilaru, 2014)
6
2.3 ARB’S EMISSION INVENTORY (AIR RESOURCES BOARD)
ARB‟s emission inventory is a technique that used in California to measure the emission under the California environmental protection agency which valid in California only. ARB's mission is to promote and protect public health, welfare and ecological resources through the effective and efficient reduction of air pollutants, while recognizing and considering the effects on the state's economy The ARB uses the emission inventory to evaluate air quality models and reduce emission in each of 35 local air districts (California‟s Clean Air Agency, 2011).
There are two major types of inventory approaches used to determine the amount of greenhouse gas emissions from a region which are top-down and bottom up approaches. The California greenhouse gas inventory uses both approaches. The top-down approach , while the bottom-up approach uses facility-specific data to estimate emissions from each source. The total amount of emissions from each source are then summed together to generate an inventory for a particular geographic area (California Environmental Protection Agency, 2014).
7
occurring. Due to the importance of the inventory in air quality planning and management in California, the ARB and local air pollution control agencies are working together to further refine estimation methods to improve the inventory (“California‟s Clean Air Agency,” 2011). The example data from California can be seen in appendix A. (Refer appendix 5)
2.4 CORINAIR 2013 (CORE INVENTORY AIR EMISSION
The European Union (EU) emission inventory program (CORINAIR) was set up by the European Council of Ministers in 1985 to assist in the development of consistent, comparable and transparent national inventories for “conventional” air pollutants such as SOx, NOx, and NMVOC. CORINAIR had been developed through generation by generation to update with the latest issues of emission especially from the aspects of pollutants produced. The new development had additional pollutants which include NH3, CO, CO2 and N2O, as well as to separate CH4 from NMVOC. CORINAIR method also had elaborate the source of emission inventory for three types of categorized, include area source, point source, and mobile source. The emission inventory can be measured by three ways; top down approach, bottom up approach and combine.
2.4.1 TOP-DOWN APPROACH