Procedia Engineering 68 ( 2013 ) 365 – 371
1877-7058 © 2013 The Authors. Published by Elsevier Ltd.
Selection and peer-review under responsibility of The Malaysian Tribology Society (MYTRIBOS), Department of Mechanical Engineering, Universiti Malaya, 50603 Kuala Lumpur, Malaysia
doi: 10.1016/j.proeng.2013.12.193
ScienceDirect
The Malaysian International Tribology Conference 2013, MITC2013
Characterization of biochar derived from rubber wood sawdust
through slow pyrolysis on surface porosities and functional groups
A.
Shaaban
a, Sian-Meng Se
a*, Nona Merry M. Mitan
b, M.F. Dimin
aaDepartment of Engineering Materials, Faculty of Manufacturing Engineering, Universiti Teknikal Malaysia Melaka,
Hang Tuah Jaya, 76100 Durian Tunggal, Melaka, Malaysia.
bDepartment of Plant and Maintenance, Faculty of Mechanical Engineering, Universiti Teknikal Malaysia Melaka,
Hang Tuah Jaya, 76100 Durian Tunggal, Melaka, Malaysia.
Abstract
Biochars were prepared by conducting slow pyrolysis of rubber wood sawdust (RWSD) derived from sawn timber. Eventhough researches on preparation of biochar from biomass have been reported by many researchers, limited work has been reported for investigation of biochar RWSD for its surface porosities and functional groups. Surface porosity of biochars provides a suitable dimension for cluster of microorganism to grow and higher porosity for better water holding capacity. Surface functional groups contain oxygen may help to improve the soil fertility by increasing the cation and anion exchange capacities to reduce the nutrient leaching in soil. The pyrolysis process was carried out at temperatures ranging between 300 °C to 700 °C at the heating rate of 5 °C/min for 3 hours with continuous nitrogen purging. The influence of pyrolysis temperatures on the biochars pores were investigated by using X-Ray Diffraction (XRD), Brunauer-Emmett-Teller (BET) surface analysis and Scanning Electron Microscopy (SEM). The surface functional groups were examined by Fourier Transform Infrared (FT-IR). SEM analysis clearly showed the development of well-defined pores distributed on biochars surface. It was found that the maximum BET surface area and total pore volume were 5.493 m2/g and 0.0097 cm3/g respectively for biochar pyrolysis at 700 °C. The FT-IR spectrum analysis showed the functional groups decreased with the increasing of pyrolysis temperature. The results highlighted the effect of pyrolysis temperature on biochar pores accumulative that associated with soil fertility and nutrient retention in soil which could be beneficial to the agricultural industries.
© 2013 The Authors. Published by Elsevier Ltd.
Selection and peer-review under responsibility of The Malaysian Tribology Society (MYTRIBOS), Department of Mechanical Engineering, Universiti Malaya, 50603 Kuala Lumpur, Malaysia.
Keywords: Biochar; slow pyrolysis; BET surface area; surface porosity; surface functional groups
_______________________________________________________________________________________________________
1.Introduction
Agricultural wastes are lignocellulosic materials consisting of cellulose, hemicellulose and lignin. Cellulose is a type of glucose polymer arranged in long chains and well-ordered structure. Hemicellulose, for example polysaccharide is sugar chains with a long branch arrangement. The component of lignin consists of monomers that linked together to form branched long chain molecules. It serves as a binder to glue cellulose fibers together. The composition of hemicellulose and lignin are largely vary from species to species [1]. These waste materials have little or no economic value and often present as a disposal problem. In Malaysia, about 1.2 million tons of agricultural wastes are disposed annually in landfills [2].
© 2013 The Authors. Published by Elsevier Ltd.
Therefore, there is a need to convert these low-cost byproducts into useful and profitable goods. Thus, conversion of waste materials into biochar would add considerable economic value and promote a green environment. It helps to reduce the cost of waste disposal and provides as an alternative to existing commercially available biochar [3].
Biochar is a stable, carbon-rich form of charcoal that can be applied onto the agricultural land as part of agronomic or environmental management. Biochar can be produced through the thermal pyrolysis process of all types of biomass using a pyrolysis reactor with little or absence of oxygen [4]. Pyrolysis process converts any organic matter into a highly stable form of carbon which is perfectly used as a soil additive to improve nutrient retention and carbon storage in soil [5]. The feed stocks and processing conditions be can significantly influence the physical and chemical properties in biochar. Parameters such as heating rate, heating temperature, pressure, pre-treatment, gas flow rate and residence time must be monitored and controlled [6]. It was found that heating temperature is the most important parameter due to the release of volatiles, the formation and volatilization of intermediate melts [7]. This will ensure the resultant product is fit for purpose and deliver the intended effect when added onto agricultural soils. Incorrect production could result in a product that is detrimental to agricultural production and the environment.
Porosity creates during the pyrolysis process is an important physical feature of biochar in soil processes and its behavior. The pores are divided into 3 types according to its internal diameter, namely micropores (< 2nm), mesopores (between 2nm and 50nm) and macropores (>50nm) [8]. The micropores, which have large surface area, are a preferred habitat for microbial communities in utilizing the soil. The macropores present on biochar may provide suitable dimensions for cluster of micro-organisms to grow and reproduce and the micro and meso porosity of biochars may also allow it to retain more moisture in soil and increase the water holding capacity [9]. The presence of functional groups such as phenolic, carboxylic, lactonic, carbonyl and pyrnose on biochar surface poses surface positive charge and surface negative charge responsible for anion exchange capacity (AEC) and cation exchange capacity (CEC) respectively. AEC and CEC help to retain ionic nutrient compounds in soil. The most common ionic compounds are nitrogen compounds such as ammonium (NH4+), nitrite (NO2-) and nitrate (NO3-) [10]. Collectively, these properties allow biochar to: 1. Reduce of eutrophication; 2. Decrease environmental pollution; 3. Maintain soil fertility and; 4. Reduce the need for additional natural and/or chemical fertilizers. RWSD has been chosen for this study due to its availability as one of the main plantation crops in South East Asia. The estimated plantation area of 1.82 million hectares in Malaysia which accounts for 20% of global plantation. Additionally, RWSD is high in carbon content and low ash content [11]. Thus, the objective of this research is to investigate the effect of temperature on the total pore volume, the surface area of pores, and the functional groups of biochars which derives from RWSD.
2.Materials and methods
2.1.Preparation of biochar
The raw material of RWSD was obtained from a sawmill in Malacca. They were sieved in order to remove the big lumps and dried at 105°C for 24 hours and stored in a sealed container in an incubator for the experiment. Prior to the pyrolysis process ultimate characterization was carried out on dried raw RWSD by carbon (C), hydrogen (H) and nitrogen (N) CHN elemental analyzer (Therma Finnigan EA 1112), the sample was prepared by grinding the dried raw RWSD into smaller particle sizes and sieved into 20 μm using a lab scale milling machine. Then, TGA (Mettler Toledo Star SW901) performed to check the thermal stability of raw RWSD under nitrogen atmosphere with gas flow rate at 10 ml/min.
2.2.Characterization of biochar
The produced biochars were examined for XRD by PANalytical X’Pert PRO MPD PW 3040/60 diffractometer using KĮ with a scan speed of 2.5°min-1 to determine the degree of crystallinity of cellulose structures.
Micromeritics ASAP 2010 was used for BET surface area analysis by automated nitrogen multilayer absorption system. SEM (Zeiss Evo 50) was used for surface morphology analysis and the SEM with EDX capability was used to investigate the localized carbon content on the biochars produced. Surface functional groups on biochars surface were determined by FT-IR, where the test specimens were prepared by mixing the biochar with KBr at a fixed ratio for fabrication of a translucent disc. The spectrum for FT-IR was in the range of 400cm-1 to 4000 cm-1 with a resolution factor of 4cm-1.
3.Results and discussion
3.1. CHN elemental analysis
The percentage of the element in the sawdust as displayed in Table 1. CHN analysis is a form of elemental analysis for determination of only carbon, hydrogen and nitrogen presence in a sample. The carbon content of raw RWSD has recorded as 43.27%, which is comparable to those of the literature results [12-13]. High carbon content in raw RWSD results in higher purity of biochars. This relationship is discussed later in the paper in the section entitled SEM and SEM-EDX analysis.
Table 1. Elemental analysis CHN on raw rubber wood sawdust
Element
Ultimate analysis (%)
Current work [12] [13]
Carbon 43.27 43.98 44.03
Hydrogen 6.83 8.04 7.99
Nitrogen 0.39 0.00 0.00
3.2.Thermogravimetric Analysis (TGA)
Generally, the typical chemical composition of rubber wood is 40-44% cellulose, 25-30% hemicellulose and 20-22% lignin [14-15]. Firstly, hemicellulose decomposed at 220 °C, with the decomposition substantially completed at
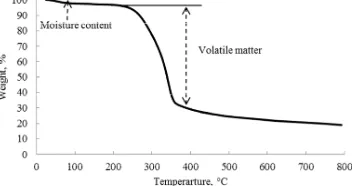
315 °C. The cellulose starts to decompose at above 315°C and by 400°C, all cellulose has converted to non-condensable gas and non-condensable organic vapours. The lignin starts to decompose at 160°C, however, the process is slow and the decomposition continues until temperature 900°C is reached [9]. Fig. 1 shows the TGA curve for RWSD, it indicates the mass started to decrease at 200°C. At this stage, it involved removal of hemicellulose. From 300°C the weight loss is attributed by volatilation of organic substances such as carbon dioxide, methane and methane in the form of gaseous. It was also found that the volatile content was around 70% and the fixed carbon content was estimated 25%.
3.3.X-Ray Diffraction (XRD)
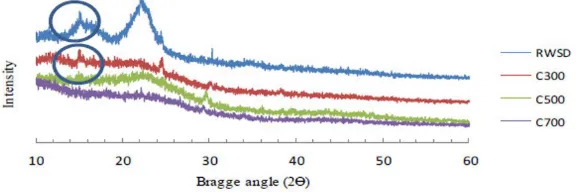
XRD diffractrogram is mean to study crystallinity of the material. Fig. 2 displays the diffractogram for raw RWSD, biochar obtained at 300°C, 500°C and 700°C. Two broad peaks were detected at the 2ࣄ value of around 16°
and 22° for raw RWSD. These might attribute to crystallinity in lattice spacing of cellulose that arranged orderly as
show in Fig. 2. However, hemicellulose and lignin are both amorphous in nature [1]. Similar diffractogram was reported by Wang et al. (2009) [16] for raw pine wood. It was found that biochar obtained at 300°C shows a
narrower peak at 16°. This indicates the presence of cellulose structure. As the temperatures increase to 500°C and
700°C, peaks at stipulated angles disappeared. This can be explained as cellulose started to decompose at 315°C. An increase of pyrolysis temperature also caused the volatilities of cellulose structure. At angle 2ࣄ=22° there is an
obvious and broad peak observed in raw RWSD, however it disappeared when heated at 300°C thus showing
reduction in crystalinity at 22°. Therefore, biochar obtained at 500°C and 700°C are virtually amorphous. As the
pyrolysis temperature increases, the diffractogram displayed a distinctive character of an amorphous material.
Fig. 2. X-ray diffractogram of raw RWSD, C300, C500 and C700
3.4.Surface area analysis BET
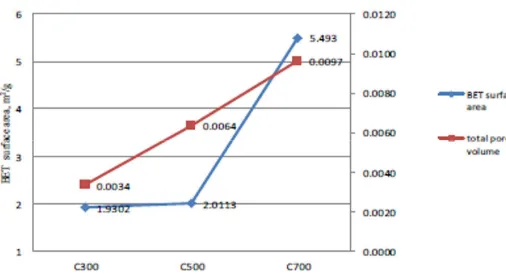
Fig. 3 shows BET surface area and total pore volume for biochar C300, C500 and C700. It was found that the increase of pyrolysis temperature from 300°C to 500°C did not show a significant increase in BET surface area, however when the temperature increase to 700°C the BET surface area rose drastically to 5.493m2/g. This is
probably due to at the lower temperatures the reactants were partially carbonized as shows in Fig. 1, where TGA curve showed the percentage of weight at the 300°C weight of RWSD were in decline trend. Further increased of temperature to 700°C had increased the of the volatilities of organic compounds and create more pores which contribute to larger surface area. The higher surface area is preferable because it helps to improve the soil structure and increase total water retention in soil [6]. Total pores volume increase proportionally with temperature and reported the highest value of 9.655x10⁻³ cm3/g for C700, C700 also showed the existence of micropore volume of 9.5x10⁻⁴ cm3/g. The micropore surface area for C700 was calculated by the difference of the BET surface area and external surface area, the calculated value was recorded as 2.159 m2/g. The presence of Micropore may help to improve the moisture content in soil. Average pore diameter denoted the pores are mostly mesopores and macropores. Mesopores and macropores are useful for liquid-solid adsorption [6].
Table 2. Specific surface area analysis BET and pores for all samples
Sample
BET surface area (m2/g)
External surface area (m2/g)
Ave pore diameter (nm)
Total pore volume x10-3(cm3/g)
Micropore volume x10-4(cm3/g)
C 300 1.930 2.205 6.975 3.366 0.000
C 500 2.011 2.487 12.671 6.371 0.000
Fig. 3. BET surface area and micropore volume for C300, C500 and C700
3.5.Surface morphology SEM and SEM-EDX
Fig. 4(a)-(d) illustrate the SEM micrographs of raw RWSD, C300 and C700. Morphological structures of wood were traced significantly in C300. The surface of RWSD as showed in Fig. 4(a) was smooth without any ridges or pores. Nevertheless, after the pyrolysis process in Fig. (b) and (c) many well-defined pores were created which might be caused by volatilation of organic compounds. Based on the outward appearance, it could be said that the pores are not cross-linked and it was observed that the pore size were relatively smaller with higher pore volume for C 700 compared to lower temperature C 300. This observation was in good agreement with the data reported in Table 2, where the total pore volume for C700 was about 3 times more than C 300.
The present of porosities on biochars are relevant to the movement of roots through the soil and serve as habitats of varieties of microbes in soil [6]. Fig. 5 shows the percentage of localized carbon content for biochar produced at different temperatures. It is worth noting that the carbon content increases proportionally with temperature [11]. This denoted that temperature has increased the carbon density and oxygen has been removed through dehydration and volatilation. In addition, the carbon atoms in biochar produced at higher temperature arranged more orderly causing the density of carbon is higher. This is supported by Novak et al (2009) [17], the arrangement of carbon structures were transformed from aliphatics to aromatic reported by 13C NMR with the increase of pyrolysis temperature.
Fig. 5. Percentage of localized carbon content by SEM-EDX analysis for C300, C500 and C700
3.6.Fourier Transform Infrared Spectroscopy (FT-IR)
FT-IR is informative in the determination of various functional groups on biochar surface produced at different temperatures. Fig. 6 shows the spectra for raw RWSD and biochar obtained at different temperatures. It was found that the spectrum for biochar obtained at 300°C was similar to raw material. At higher temperatures, the spectra became more simplified which might associate with rupture of various functional groups and progressive carbonization [16]. A wide band at 3550-3423cm-1 detected due to hydrogen bonded -OH stretching of phenol [18]; the intensities decreased tremendously at 500°C and disappeared when the temperature rose to 700°C. This signified dehydration of wood structure and cleaved of phenolic groups at temperatures above 500°C [16]. Peak observed in
raw RWSD at 2928cm-1 disappeared at temperatures 300°C and above, showing a methylene group -CH2- in
hemicellulose volatile at lower temperature. Besides, another acid group showed a declining trend is vibration of C=O for lactone, peak at 1735cm-1 on raw RWSD disappears after heating. Vibration in the frequency range of 1100cm-1 to 1500cm-1 reflect peaks for carbonate and carbonate-carboxyl and 1660cm-1 to 1670cm-1 represents the peaks for carboxylic acid, there were narrow peaks detected on raw RWSD and declined with the increase of pyrolysis temperature. Fig. 7(a)-(c) show some examples of acidic groups present on biochar surface. For basic groups such as quinones vibrate at spectrum range of 1550cm-1 to 1680cm-1 there is one narrow peak found in raw RSWD, however two sharp peaks were detected for biochar obtained at 300°C denoted at 1654cm-1 and 1618cm-1 as the temperature increased to 500°C there was one peak detected at 1619cm-1. Collectively, the lactone peak at raw RWSD shifted The basic sites in the form of unsaturated bonds for example carbonyl, quinone and pyranose groups with electron donating properties serve as lewis basic centres that accept protons from aqueous solutions such as H+ in water [18].
4.Conclusion
Several physical and chemical properties of rubber wood sawdust based biochars through slow pyrolysis technique, have been examined. Development of porosity increased the specific surface area of biochars whilst higher temperature provides sufficient activation energies for pore creation and enhanced greater degrees of order in the structure. Therefore, it was found that sample C 700 recorded maximum value of BET specific surface area and total pore volume, 5.493 m2/g and 0.0097 cm3/g respectively. The results demonstrated that heating temperature was significantly influenced the properties of biochars as heating temperature involves the release of volatiles and formation of intermediate melts. The increased of temperature had reduced the acidic functional groups and conversely increased the basic groups of the biochars. It was demonstrated in FT-IR spectra, the reduction of acidic functional groups such as phenol, lactonic and carboxylic acid and existence basic groups like quinone and carbonyl at higher temperature. These functional groups of pore surface negative charge property contributes to better cation exchange capacity that help to retain cation nitrogen nutrient compound in soil such as ammonium NH4+. In addition, increased of basic groups also helped to increase the soil pH, especially in improving pH for sandy soil where the pH is below 5.5 and hence improved soil fertility. In conclusion, biochar is a highly potential substance that can be used in many types of soil to improve crop production.
Acknowledgements
The authors are very thankful to the Faculty of Manufacturing Engineering and Faculty of Mechanical Engineering, Universiti Teknikal Malaysia Melaka (UTeM) for providing the facilities and constant encouragement, also the funding from LRGS under LRGS/2011/FKP/TK02/1 R0000 and MOHE My Brain 15.
References
[1] Conversion of cellulose, hemicellulose and lignin into platform molecules biotechnological approach: Technical Presentation, EuroBioRef Summer School Italy, 18-24 Sept. 2011.
[2] Hameed, B.H., Ahamd, A.L., Latiff, K.N.A., 2007. Adsorption of basic dye (methyl blue) onto activated carbon prepared form rattan sawdust, Dyes and Pigments 75, p. 143.
[3] Tsai, W.T., Lee, M.K., Chang, Y.M., 2007. Fast pyrolysis of rice husk: Product yields and compositions, Bioresource Technology 98 (1), p. 22.
[4] Biochar: implication for agricultural productivity: Technical Report for 2011, Australian Government, 2011.
[5] Krull, E.S., Baldock, J.A., Skjemstad, J.D., Smernik, RJ., 2009. Characteristic of biochar: organo-chemical properties, Biochar for environment science and technology, Earthsan Publication Ltd, UK, p.53.
[6] Downie, A., Crosky, A., Munroe, P., 2009. Physical properties of biochar, Biochar for environment managemen science and technology, Earthscan, London UK, p.13.
[7] Lehmann, J., Jospeh, S., 2009,Biochar for environment management science and technology, Earthscan, London, UK, p.3. [8] Rouquerol, F., Rouquerol, I., Sing, K., 1999. Adsorption by powders and porous solids, Academic Press, London, UK, p.13.
[9] Theis, J.E., Rillig, M.C., 2009. Characteristics of biochar, Biological properties, Biochar for environment management Science and technology, Earthscan, London, UK, p. 85.
[10] Chan, K.Y., Xu, Z., 2009. Biochar nutrient properties and their enhancement,Biochar for environment management Science and technology, Earthscan, London, UK, p68.
[11] Se, S.M., Shaaban, A., Ibrahim, I.M., 2011. “Microwave absorbing material using rubber wood sawdust,” IEEE Symposium on Wireless Telecommunication and Application, p. 127.
[12] Srinisvasakanan, C., Bakar, M.Z.A., 2004. Production of activated carbon from rubber wood sawdust. Biomass and Bioenergy 27, p. 89. [13] Chaisarn, P., Satapanajaru, T., Mahujchariyawong, J., 2008. Adsorption of VOCs by activated charcoal produced from saw dust in
para-rubber wood furniture manufacturing. Thammasat International Journal Science and Technology 13, p. 8.
[14] Boerhendy, H.I., Agustina, D.S., Suryaningtyas, H.. Basic characteristics of rubber wood for some recommended clones in Indonesia, Sembawa Research Centre Indonesia Rubber Research Institute. 2010.
[15] Wood characteristics, maintaining and coating properties of rubber wood plantation in China: Workshop on Research Institute of Wood Industry, Dec. 2008.
[16] Wang, Z., Coa, J., Wang, J., 2009. Pyrolitic characteristics of pine wood in a slowly heating and gas sweeping fixed-bed ractor, Journal of Analytical and Applied Pyrolysis 84 p. 179.
[17] Novak, J.M., Lima, I., Xing, B., Gaskin, J.W., Steiner, C., Das, K.C., Ahmedna, M., Rehrah, D., Watts, D.W., Bussher, W.J. and Schomberg, H. 2009. Characterization of design biochar produced at different temperatures and their effects on loamy sand. Environmental Science, 3: 195-206.