UNIVERSITI TEKNIKAL MALAYSIA MELAKA
REDUCING CYCLE TIME TO IMPROVE PRODUCTIVITY IN
LAY-UP PROCESS AT AEROSPACE COMPANY
This report submitted in accordance with requirement of the Universiti Teknikal Malaysia Melaka (UTeM) for the Bachelor Degree of Manufacturing Engineering
(Manufacturing Management) with Honours
by
NUR’ADINLAH BINTI NORMAN B051110009
920908-14-5042
DECLARATION
I hereby, declared this report entitled “Reducing the Cycle Time to Improve Productivity in the Lay-up Process in Aerospace Industry” is the results of my own
research except as cited in the references
APPROVAL
This report is submitted to the Faculty of Manufacturing Engineering of UTeM as a partial fulfillment of the requirements for the degree of Bachelor of Manufacturing Engineering (Manufacturing Management) with Honours. The member of the supervisory committee is as follow:
i
This research is about the reducing of cycle time to increase the productivity in the lay-up process in the Composite Technology Research Malaysia (CTRM) Sdn Bhd aerospace industry. The selected manufacturing company for this study is a composite fibre for aerospace product industry . This company is one of the composite fibre for aerospace product in Malaysia. Refering to ishikawa, analysis the serious factor for increasing productivity is on cycle time and layout where the process is conducted. Hence the aims of the research is to study the process cycle time based on current standard operating procedure (SOP) of the lay-up process. Through the current cycle time the value added and non-value added activity can be determined and the improvement done by using lean tool and technique in order to reduce the cycle time. Using the Witness simulation software the result show that by utilize the work station from two workstation become three workstation it can increase productivity 25%. The total cycle time also can be improve by 13.4% without any non-value added cost.
ii
Kajian ini adalah mengenai mengurangkan masa kitaran untuk meningkatkan produktiviti syarikat Composite Technology Research Malaysia (CTRM) Sdn Bhd di dalam proses “lay-up” di industri aeroangkasa. Syarikat pembuatan yang dipilih untuk kajian ini adalah serat komposit bagi industri produk aeroangkasa. Syarikat ini merupakan salah satu daripada gentian komposit untuk produk aeroangkasa di Malaysia. Merujuk kepada analisis Ishikawa, faktor yang serius untuk meningkatkan produktiviti adalah pada masa kitaran dan susun atur di mana proses ini dijalankan. Oleh itu, matlamat kajian ini adalah untuk mengkaji masa kitaran proses berdasarkan prosedur semasa standard operasi (SOP) dalam proses “lay-up”. Melalui masa kitaran semasa nilai tambah dan bukan nilai aktiviti tambah boleh ditentukan dan penambahbaikan yang dilakukan dengan menggunakan kaedah pembuatan kejat untuk mengurangkan masa kitaran. Dengan menggunakan perisian simulasi “Witness” menunjukkan keputusan bahawa dengan menggunakan stesen kerja dari dua stesen kerja menjadi tiga stesen kerja ia boleh meningkatkan produktiviti 25%. Disamping itu, jumlah masa kitaran juga boleh dipertambahbaikkan sebanyak 13.4% tanpa apa-apa kos yang tidak bernilai tambah.
iii
Dedicated to my beloved parents, Mr. Norman Bin Musa and Mrs. Rehan
Binti Rahim. Also, to my supervisor and all panels that always gives guide in
completing this final year project. Besides that, my family and friends for all
iv
Praise be to Allah S.W.T for the blessing and grace throughout the completion of this report and Peace upon him Muhammad S.A.W, the messenger of Allah.
I am highly indebted to my great supervisor Dr Seri Rahayu Binti Kamat for his guidance and constant supervision as well as for providing necessary information regarding the study and also for his support in completing the project. My sincere thanks dedicate to FKP Final Year Project Management Team for giving me the meaningful training for report guidance and as well as giving the oppurtinity for me to perform this project.
I would like to express my gratitude to the whole organization Composite Technology Research Malaysia Sdn. Bhd. for their contribution during the project takes place. I wish to convey my thanks to Engineer of SONACA project in CTRM, Miss Nahdatul Izah Binti Md Yassan for his permission and guiding me to run this project in the company.
I would also like to express my gratitude towards my parents and friends for their kind co-operation and encouragement which help me in completion of this project. Thank you very much for the motivation and support that never ends to me.
v
List Abbreviations, Symbols and Nomenclature xii
CHAPTER 1: INTRODUCTION 1
CHAPTER 2: LITERATURE REVIEW 12
2.1 Background of the study 12
2.1.1 Time Study 12
2.1.2 Lean Manufacturing Tools 13
2.1.2.1 5’s 14
2.1.2.2 Single Minute Exchange Die (SMED) 14
2.1.2.3 Kanban 14
2.1.2.4 Bottleneck Analysis 15
2.1.2.5 Poka Yoke 15
2.1.2.6 Root Cause Analysis 15
2.1.2.7 Jidoka 16
2.1.2.8 Andon 16
vi
2.1.3 Simulation 16
2.1.4 Witness Simulation Software 17
2.2 Approach used from previous study on cycle time 18
2.2.1 Value Stream Mapping 18
2.2.2 Material Requirement Planning 19
2.2.3 Single Minute Exchange Die (SMED) 20
2.2.4 Flash Development 21
2.2.5 Simulation Tool 21
CHAPTER 3: METHODOLOGY 23
3.1 Flowchart 23
3.1.1 Relationship between methodology and objectives 25
3.2 Phase 1 26
3.2.1 Identify Problem Statement 26
3.2.2 Determine Objective and Scope 26
3.2.3 Literature Review 27
3.3 Phase 2 27
3.3.1 Analyze Existing Process Cycle Time 27 3.3.2 Evaluate suitable lean tool for current process cycle time 28 3.3.3 Analyze Using Witness Simulation 28 3.3.3.1 Steps in the Simulation Study ` 29 3.3.3.1.1 Problem Fomulation 30
3.3.3.1.2 Setting Objective 30
3.3.3.1.3 Model Conceptualization 30
3.3.3.1.4 Data Collection 31
3.3.3.1.5 Model Translation 31
3.3.3.1.6 Model Verification 31
3.3.3.1.7 Model Validation 32
3.3.3.1.8 Experimental Design 32 3.3.3.1.9 Run & Analysis 32 3.3.3.1.10 Documentation and Reporting 32
3.4 Phase 3 33
3.4.1 Discussion and Conclusion 33
vii
3.5.1 Objective 1 and Objective 2 33
3.5.1.1 Data Collection 34
3.5.1.2 Data Analysis 36
3.5.2 Objective 3 and Objective 4 36
3.5.2.1 Data Collection 36
3.5.2.2 Data Analysis 38
CHAPTER 4: RESULT AND DISCUSSION 39
4.1 Product Family Selection 39
4.1.1 The Product 40
4.1.2 Customer Requirement 40
4.1.3 Production Process for MLGD Product 41
4.1.4 Time Measurement 43
4.1.4.1 Standard Available Time for Lay-up
Process (Bonding Process) 44
4.1.4.2 Takt time for Lay-up Process (Bonding Process) 44
4.2 Analysis on Existing/Actual Layout 45
4.3 Analysis on Actual Process using Time Study 47 4.3.1 Identifying Time Waste in Lay-up Process (Bonding Process) 47 4.3.2 Data Collected During the Bonding Process 47
4.3.2.1 Sub-process 1: Drying 49
4.3.2.2 Sub-process 2: Pre-fitting 50 4.3.2.3 Sub-process 3: Bonding (Cleanroom) 51 4.3.1 Data Analysis for Current Bonding Process 53
4.3.1.1 MLGD Panel for Each Sub-process Involve
During Bonding 53
4.3.1.2 Standard Time Calculation 54 4.3.2 Eliminating Waste of Time by Identify the Non-value
Added Activity 56
4.3.2.1 Results After Eliminate Non-value Added 56
4.3.3 The result of Improvement 59
viii
4.4.3 Data Verification and Validation 68 4.4.3.1 Data Distribution for Each Data Included to Model 69 4.4.3.2 Verification and Validation 81 4.4.4 Summary of Witness Simulation Model 86
CHAPTER 5: CONCLUSION AND SUGGESTION 87
5.1 Conclusion 87
5.2 Suggestion for Future Work 88
REFERENCES 89
APPENDICES 91
ix
1.1 Pareto Analysis 7
1.2 Structured of the Report 10
3.1 Relationship between Methodology and Objective 25
4.2 Total Time Study for Sub-process Involved in Bonding 49 4.3 Total Time Study for Sub-process Involved in Bonding 50 4.4 Total time Study for Sub-process Involved in Bonding 51 4.5 Total Time Study for Sub-process after Improvement 56 4.6 Total Time Study for Sub-process after Improvement 57 4.7 Total Time Study for Sub-process after Improvement 58 4.8 Component of System for MLGD Lay-up Process 63
4.13 Commands Used for Each Components during
Bonding Process in Mould 1 74
4.14 Commands Used for Each Components during
Bonding Process in Mould 4 77
4.15 Average Waiting Time per Order that Simulated
In Computer Model 81
4.16 Results Obtained for Power and Sample size 83
x
1.1 Ishikawa Diagram 4
1.2 Pareto Chart 6
2.1 Example of Lean Tool 13
2.2 Example of Model Created Through
Witness Simulation Software 17
3.1 Methodology Flowchart 24 4.3 Comparison of process Cycle Time in CTRM and
Contract Process Cycle Time of SONACA based on
Historical data. 43
4.4 The View of Lay-up room where the MLGD Product
Produced. 45
4.5 The view of lay-up actual layout for MLGD product 46 4.6 Sub-process of MLGD panel with time studies 53
4.7 Graph of Standard Time 62
4.8 WITNESS simulation model layout 67
4.9 WITNESS simulation model after run 68
4.10 Data distribution for the bonding 69 4.11 Probability data distribution for bonding 70 4.12 Data distribution for the pre-fitting 70 4.13 Probability data distribution for pre-fitting 71
4.14 Data distribution for the drying 71
4.15 Probability data distribution for drying 72
xi
4.16 Results Obtained for Validation by Using
Minitab Software 82
4.17 Data inserted into the power and sample size
For 1-sample T 83
4.18 Validation of Input-output Transformation 84 4.19 Simulation model before improvement 85
xii
Bhd - Berhad
CTRM - Composite Technology Research Malaysia MLGD - Main Landing Gear Door
PSM 1 - Projek Sarjana Muda 1 PSM 2 - Projek Sarjana Muda 2
Sdn - Sendirian
SMED - Single Minute Exchange Die SOP - Standard Operating Procedure SOT - Standard Operating Procedure
1
CHAPTER 1
INTRODUCTION
This chapter describes the basic idea and background of the project. Moreover, it explain the purpose of this report and the limitation need to be considered during the study is conducted. Generally, this chapter consists of five (5) main section which are background, problem statement, objectives and the scope of the project.
1.1 Background of the study
2
developed byFrederick W. Taylor in about 1880 which is the first person use stopwatch to study and measure work content with his purpose to define “a fair day’s work”. Among his study is ‘Taylor Shoveling Experiment’ which he studied between 400 and 600 men that using his own shovel from home to moving material from mountains of coal, coke and iron ore in around two mile-long yards. The results was impressive where it’s managed to reduced time, saving number of workers and budgeting every year.
Lean tools is one of tool that can be used as improvement tool in reducing the cycle time. According to Kilpatrick (2003) the benefit of implementing lean can be broken down into three broad categories that is operational, administrative and strategic improvement. As for this study it’s in operational categories which is the lean tool is applied to reducing the cycle time in order to improve the productivity.
3
1.2 Problem Statement
4
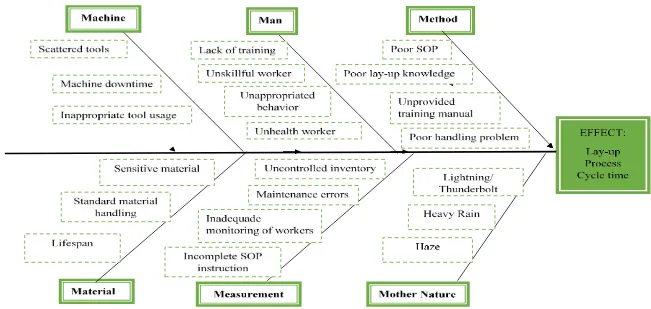
1.2.1 Ishikawa Diagram
Figure 1.1: Ishikawa Diagram
5
By referring to figure 1.1 Ishikawa diagram or cause and effect analysis for this problem statement generated from brainstorming with the manufacturing engineer for this main landing gear door project at the CTRM. Through the Ishikawa diagram the root cause of a problem can be determine and also can uncover the bottleneck in the process. This is identify process to determine why and where the lay-up process not working smoothly. From the Ishikawa diagram all factor that can cause or give effect toward the cycle time is analyzed through discussion and brainstorming with the manufacturing engineer and also the operator involve during the conducted process. First factor that has been discussed is regarding the method involve during the process where under this factor many sub-factor that contribute to the increase of the cycle time such as poor SOP for the process, new worker that has poor lay-up knowledge, un-provided lay-up training manual due to time constraint and also poor handling problem among the workers.
For the man factor the manufacturing engineer stated that the operator in the lay-up process is lack of training and skill due to many new operator start working during their peak time to produce the demand. Besides that, unappropriated behavior such as wasting time during the working hour also cause the cycle time in the process increase including the health of worker that effect their performance during work.
For machine factor, situation such as scattered tool in the working layout also lead to increasing cycle time due to uncomfortableness to do work. Besides that, inappropriate tool usage and machine downtime also need to be considered this is because even lay-up is manual job task but in the process it has drying sub-process where autoclave machine would be used to complete the process.
6
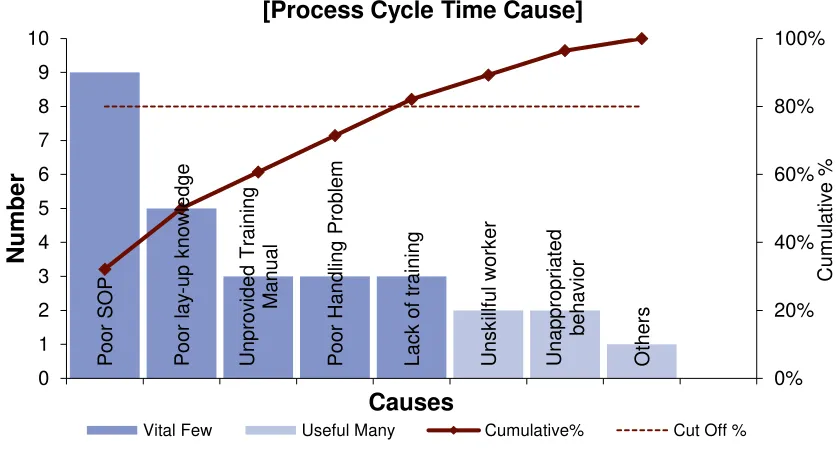
1.2.1 Pareto Diagram
All the causes from Ishikawa has been analyzed through and all opinion regarding the causes that effect on the lay-up process cycle time has been analyzed from 10 people involved in that process that include the operator and engineer. From Figure 1.2 it show the Pareto chart that show the number of person choose the several causes that effect the lay-up process cycle time.
Figure 1.2: Pareto Chart
P
7
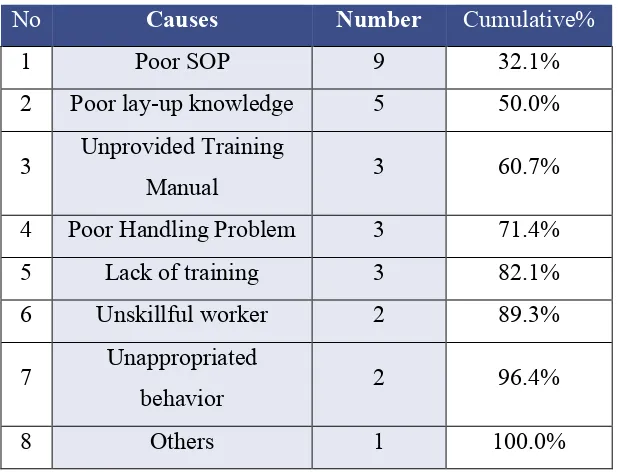
Table 1.1: Pareto Analysis
No Causes Number Cumulative%
1 Poor SOP 9 32.1%
8
1.3 Objective
The objective of this project is significantly help in the making of the report as it can control the performance before any implementation of improvement. Therefore, the specific objective for this project are set to:
i. Identify the current cycle time in the lay-up process for product main landing gear door (MLGD) in CTRM.
ii. Analyze the main effect that cause the bottleneck problem due to increase of cycle time in the lay-up process.
iii. Identify any waste in term of time that cause the long period cycle time in the process.
9
1.4 Scope of Study and Limitation
The scope of this report is explaining the field of the research and project limitations toward the report result and recommendations. Therefore the scope for this project is as below:
i. The scope of this project is to evaluate the current lay-up process cycle time in that company.
ii. Since the time allocated is limited to make this research, the data collection for this research only cover for a latest data but for several month data only.