ANALYSIS, DESIGN AND IMPLEMENTATION
OF AN EMBEDDED REALTIME
SOUND SOURCE LOCALIZATION SYSTEM
BASED ON BEAMFORMING THEORY
Arko Djajadi, Rusman Rusyadi, Tommy Handoko, Maralo Sinaga, Jürgen Grueneberg
Mechatronics Department, Faculty of Engineering, Swiss German University BSD City, Indonesia, Telp. 021-5376221 ext. 760
Email: [email protected], [email protected]
Abstrak
Proyek ini bertujuan untuk menganalisa, mendesain dan mewujudkan sebuah sistem pencari arah sumber suara waktu-nyata yang dipasang di sebuah robot beroda. Sistem yang dibuat memanfaatkan dua buah mikrofon sebagai sensor suara, sistem mikrokontroller Arduino Duemilanove dengan ATMega328p sebagai mikroprosesor, dua buah motor DC magnet permanen sebagai aktuator penggerak robot, satu motor servo sebagai penggerak webcam ke arah sumber suara, serta laptop/PC untuk tampilan dan simulasi. Untuk penentuan arah sumber suara, teori beamforming diterapkan. Sekali arah suara telah dideteksi dan ditentukan, ada 2 pilihan baik untuk menggerakkan robot kearah suara ataupun hanya webcam yang akan berputar ke arah sumber suara seolah terjadi dalam ruang konferensi video. Secara terintegrasi sistem telah diuji dan hasilnya menunjukkan bahwa sistem mampu secara cepat dalam waktu nyata menemukan arah sumber suara yang posisinya acak dalam bidang setengah lingkaran (0-1800) berjari-jari 0.3m hingga 3m, dengan asumsi sistem sebagai titik pusatnya. Karena faktor kecepatan ADC dan procesor yang rendah, hasil resolusi sudut terbaik berkisar 25o.
Kata kunci: beamforming, correlation, embedded system, realtime, sound source
Abstract
This project is intended to analyze, design and implement a realtime sound source localization system by using a mobile robot as the media. The implementated system uses 2 microphones as the sensors, Arduino Duemilanove microcontroller system with ATMega328p as the microprocessor, two permanent magnet DC motors as the actuators for the mobile robot and a servo motor as the actuator to rotate the webcam directing to the location of the sound source, and a laptop/PC as the simulation and display media. In order to achieve the objective of finding the position of a specific sound source, beamforming theory is applied to the system. Once the location of the sound source is detected and determined, the choice is either the mobile robot will adjust its position according to the direction of the sound source or only webcam will rotate in the direction of the incoming sound simulating the use of this system in a video conference. The integrated system has been tested and the results show the system could localize in realtime a sound source placed randomly on a half circle area (0 - 1800) with a radius of 0.3m - 3m, assuming the system is the center point of the circle. Due to low ADC and processor speed, achievable best angular resolution is still limited to 25o.
Keywords: beamforming, correlation, embedded system, realtime, sound source
1. INTRODUCTION
back of the system.
This project is intended to explain the human hearing system in 2 dimension area using a pair of microphones. The applications which are going to be simulated in the project are a video conference system and a steering/navigation system on a mobile robot based on incoming sound direction using a low-cost microcontroller as the brain of the system. The microcontroller is cheap and available in the local market.
The strategy of estimating the direction of the incoming sound is based on the arrival time difference of the sound reaching the 2 microphones. To achieve the objective, cross correlation method [1,2,3] and position estimation technique must be implemented [4,5]. The real time control system is implemented within a readily available microcontroller. Researches in area of the realtime embedded systems are still current and progressing with the aim of creating smarter devices or applications, where social robots are one of the most common testbeds [6,7,8]. This project is geared toward that goal and to provide a working system.
The paper is organized as follows: section II presents the principles of cross correlation and position estimation using beamforming theory, section III presents the short methodology to achieve the main purpose of the thesis project, section IV presents the experimental results of the system, and section V presents the general conclusion of the project.
2. CROSS CORRELATION AND POSITION ESTIMATION
In this section, beamforming theory using cross correlation and position estimation is evaluated.
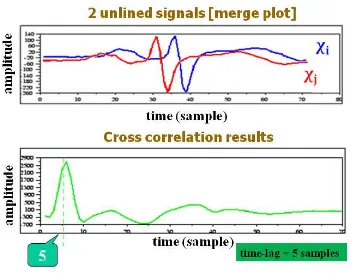
Figure 1. Example of cross correlation
2.1. Cross-correlation
(1)
where xi is the signal received by microphone i and xj is the signal received by microphone j.
is the delay time of the two signals. The point where the peak of the cross correlation results shows the delay time of the two signals, as illustrated below in Figure 1.
There are two methods of correlating signals. The first one is non-circular method (no data wrapping). This method is used if the signals are not continuous or in other words, the sampled signal represents the whole form of the signal. The second one is circular method. It is used if the signals are continuous (for example sinusoid or rectangular wave) or in other words, the sampled signal only represents some parts of the whole form of the signal. It is said to be circular because when the data index is out of range, it is "wrapped" back within range, for example: x(-1) = x(N-1), x(N+5) = x(5).
2.2. Position Estimation
Once the cross correlation is performed to find the delay time of the signals, then it is possible to predict or estimate the direction of the incoming sound based on certain assumptions to simplify modeling [4,5]. They are:
The sound speed in air is c
The sound source is located far from the microphones
There is no echo and bouncing effect
Figure 2. Geometry of position estimation [4].
Referring to the assumptions and Figure 2, the mathematical expression to calculate the incoming angle of the sound can be derived by simple trigonometry computation as follows.
(2)
(3)
So, (4)
Φ is the angle of sound source direction c is the sound speed in the air (measured)
s is the distance between the microphones
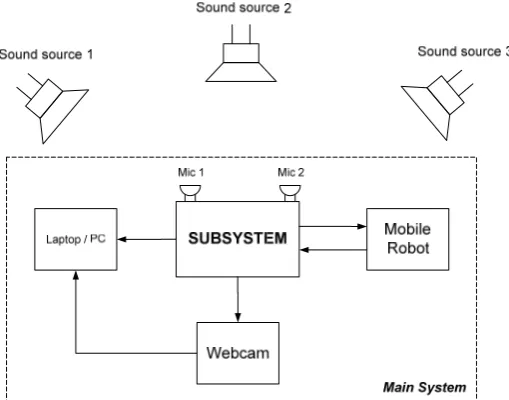
Figure 3 shows what the environment of the system looks like. The sound source could be placed anywhere in front of the system (range of 0o to 180o). The incoming sound signal will be received by microphone 1 and 2, and then it is processed in the system. The system has 3 outputs and they are sent to the laptop or PC, to the webcam’s servo, and to the mobile robot. Either the webcam or the mobile robot will response by moving toward the direction of the incoming sound. The mobile robot’s encoder will give an angular feedback based on the number of pulses to the main system. In addition, the laptop or PC will plot the sound signals received by microphone 1 and 2, the cross correlation result from both signals, and it will also show the picture taken from the webcam.
Figure 3. Global system overview
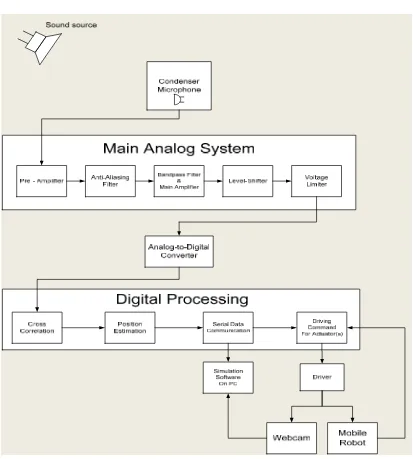
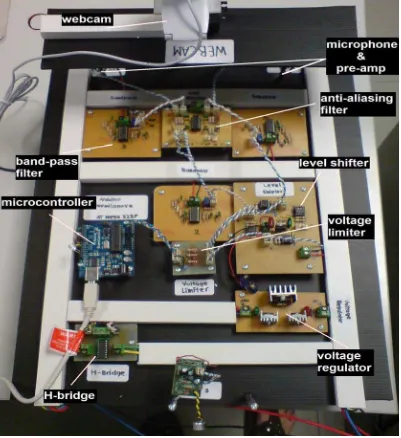
The Figure 4 shows the more detailed block diagram of the system. The sensors used in the system are condenser microphones. They are cheap and available in the local market. In addition, they also have a good sensitivity which makes them suitable for the system. The microphones are connected to their respective pre-amplifier circuit to produce a weak electric signal representing the sound wave.
Still within Figure 4, the next circuit is anti-aliasing filter. The purpose of the filter is to limit the highest frequency components allowed to enter the system. It should employ an anti-aliasing filter to fulfill the Nyquist sampling theorem that the maximum frequency of the signal should be half of the sampling rate of the A/D converter [1,3].
Next stage is band-pass filter and main amplifier. The band-pass filter here is to restrict the bandwidth of the signal from 200 to 3000 Hz. This is the bandwidth of the average human voice. However, in a normal condition, the voice frequency is from 200 to 800 Hz based on experiment using sound spectrum analyser (see Figure 5).
Again referring to Figure 4, the main amplifier circuit is using non-inverting op-amp configuration. Whenever the signal level is too low, the potentiometer could be adjusted to amplify the signal level. The level shifter is used to add a DC component to the signal. The A/D converter can only convert the signal within the range of 0-5 V. Therefore, the AC signal should be added with DC voltage and shifted up to meet the device requirement. Then it will be limited by voltage limiter to avoid the signal exceeding the limit of 0V or 5 V.
Figure 4. Main system block diagram
correlation method within the microcontroller to get the delay time of two signals, PC software is made. The software is developed using C programming language. The main purpose of the software is mainly to plot the data sent by the microcontroller via serial to the PC. The plots show the signals’ forms and the correlation results, as illustrated in Figure 1.
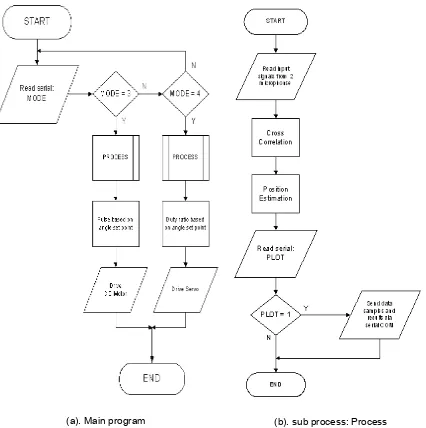
Figure 6 shows the flowchart of the logic program inside the microcontroller. The values of int MODE and int PLOT are obtained from PC software via serial communication. After being processed, the final output will be sent to the actuators. The servo motor will act as the actuator of the video conference system simulation and the DC motors will perform as the actuators of the mobile robot.
(a). Main program (b). sub process: Process Figure 6. The logic flow of the program in microcontroller
4. RESULTS
Figure 7. Experiment Layout
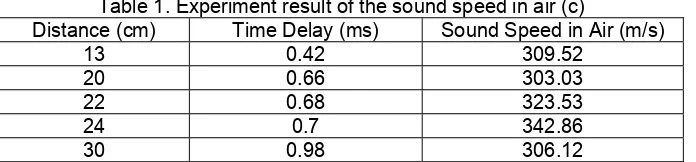
The first assumption of position estimation technique is the sound speed in air. However, the sound speed in air is different from one place to another depending on the air compositions. Therefore, an experiment to measure the actual sound speed in the actual environment should be performed. From Table 1, the average sound speed in air is c=317m/s. This data will be used in the position estimation calculation.
Table 1. Experiment result of the sound speed in air (c)
Distance (cm) Time Delay (ms) Sound Speed in Air (m/s)
13 0.42 309.52 20 0.66 303.03 22 0.68 323.53 24 0.7 342.86 30 0.98 306.12
Next important experiment is to get the calibration value of the system. The calibration of the delay time between the 2 signals should be performed in the digital processing to compensate the multiplexer delay in the A/D converter and the error due to the components’ tolerance used in the system which will lead to the phase shifting of the signal.
The time delay calibration is calculated by finding the difference value between the actual and the theoretical calculation. From experiments at angle 180o position with fixed distance s between two microphones, the actual delay time calculated using cross correlation technique by the system’s program is 16 samples. The multiplexer delay of the internal A/D converter of the ATMega328p according to the datasheet of Arduino Duemilanove is 100 µs per channel. In this system, 2 channels are used. Therefore, the delay time of the samples is 200 µs. With this information, the theoretical value of the delay time of the sound reaching the 2 microphones can be calculated. The calculation is shown as follows:
(5)
By substituting Eq. (5) to Eq. (6) and putting the value of s=20 cm and c=317 m/s, then: n=16.85 samples.
So, by substracting the theoretical and the actual value, it is found that the calibration value is 0.85 samples. In this experiment, all data are in integer values, which mean there is no fractioned number because all values are rounded down. Thus, including the calibration value in the calculation, 92.86% results of the position estimation experiment are successful. The sampling frequency of the A/D converter determines the minimum measurable delay time. The faster the sampling frequency, the more accurate the measured delay time will be. Since the delay time of the 2 signals is used to calculate the angular position of the incoming sound direction, the precision of the determined angle also has a limitation. The system could detect the direction of the incoming sound with precision of 25o from angular range of 0o-180o.
Figure 8. Picture of the system
to show the image from it. Two DC motors are set under the base plate to move the mobile robot. An encoder is employed to give the position feedback of the mobile robot to the system.
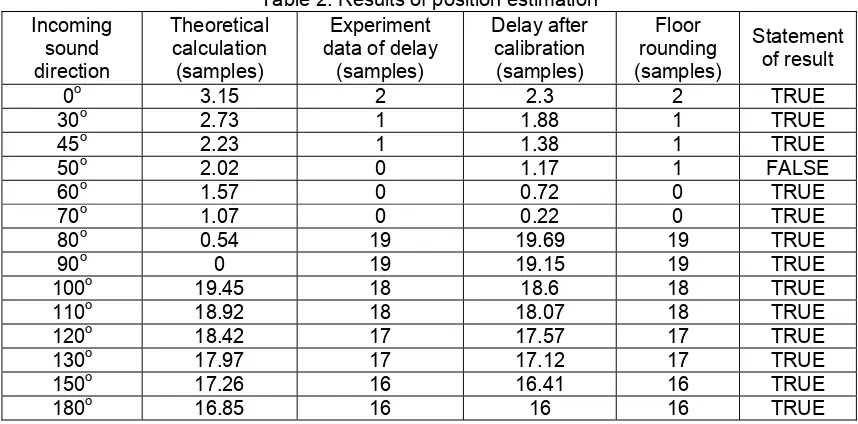
Table 2. Results of position estimation Incoming
Table 2 shows the result of the position estimation experiment. The sound source is placed at several positions regarding to the position of the system and the results are recorded. For example, the sound source is placed at 110o respected to the system (see Figure 7). The theoretical value of the delay time is 18.92 samples. Next, the theoretical value is substracted with the calibration value (0.85 samples) and the result is 18.07 samples. This value is rounded down because this is calculated in an integer variable, and the result is 18 samples. The result of the calculation is the same with the experiment data. Therefore, the statement of the result for this experiment is true.
5. CONCLUSION
By using 2 microphones as the sensors, it has been successfully simulating a system to localize the direction of an incoming sound. The precision of the system is 25o. There is still lack of accuracy of the position estimation result because of the slow sampling frequency of the A/D converter. However, this limitation could be overcome relatively easy by using an A/D converter which has a faster sampling rate in combination with a faster microcontroller with larger onchip RAM. Therefore, the precision of the position estimation will become much better. Also the system still reacts to every sound, even the undesired one (noise). The possible further improvement is to add a voice recognition system. So, the system will be able to react only to a spesific sound only.
REFERENCES
[1]. Ifeachor, E.C. and Jervis, B.W., “Digital Signal Processing”, Prentice Hall, 2002.
[2]. Arko A, Waterfall R. C, Beck M. S, Dyakowski T, Sutcliffe P, Byars M, “Development of Electrical Capacitance Tomography for Solids Mass Flow Measurement and Control of Pneumatic Conveying Systems”, 1st World Congress on Industrial Process Tomography, Buxton, Greater Manchester, April 14-17, 1999.
[3]. Haykin, S. and Veen, B.V., “Signal and Systems 2nd Edition”, John Wiley & Sons, 2003. [4]. Valin, J.M., Michaud, F. and Rouat, J., “Robust Sound Source Localization Using a
Microphone Array on a Mobile Robot”, Université de Sherbrooke 2005
2003.
[6]. S. Briere, D. Letourneau, M. Frechette, J.-M. Valin, F. Michaud, “Embedded and Integration Audition for a Mobile Robot”, Proceedings AAAI Fall Symposium Workshop Aurally Informed Performance: Integrating Machine Listening and Auditory Presentation in Robotic Systems, FS-06-01, 6-10, 2006.
[7]. S. Yamamoto, K. Nakadai, J.-M. Valin, J. Rouat, F. Michaud, K. Komatani, T. Ogata, H. G. Okuno, “Making a robot recognize three simultaneous sentences in real-time”,
Proceedings of IEEE/RSJ International Conference on Intelligent Robots and Systems (IROS), 2005.
[8]. F. Michaud, D. Létourneau, P. Lepage, Y. Morin, F. Gagnon, P. Giguère, É. Beaudry, Y. Brosseau, C. Côté, A. Duquette, F.-F. Laplante, M.-A. Legault, P. Moisan, A. Ponchon, C. Raïevsky, M.-A. Roux, T. Salter, J.-M. Valin, S. Caron, P. Frenette, P. Masson, F. Kabanza, M. Lauria, “Socially interactive robots for real life use”, Proceedings Workshop on Mobile Robot Competition, American Association for Artificial Intelligence Conference (AAAI), 2005.
![Figure 2. Geometry of position estimation [4].](https://thumb-ap.123doks.com/thumbv2/123dok/238643.502511/3.595.184.412.370.517/figure-geometry-position-estimation.webp)