Application of Quality Function Deployment
(QFD) For Quality Improvement of Suwar Suwir
Product
Research · April 2016 DOI: 10.13140/RG.2.1.3824.4240
READS
9
1 author:
Ida Bagus Suryaningrat
Universitas Jember
8 PUBLICATIONS 1 CITATION
SEE PROFILE
Application of Quality Function Deployment (QFD) For
Quality Improvement of
Suwar Suwir
Product
I.B. Suryaningrat
Faculty of Agricultural Technology (FAT), University of Jember (UNEJ) Jln. Kalimantan 37, Jember
Email: [email protected]
Abstract
Suwar suwir is a traditional food, like a sweet candy, made from sugar and fermented cassava. This product is produced by small and medium agroindustries in Jember. Various and low of improvement product are still common problems faced by producers. Evaluation of this product is needed to improve quality of the product. Presently, evaluation of consumer expectation is never conducted to improve product quality and to answer consumer expectation as well. One of the method used to solve that problem is QFD. Sixty respondents were interviewed in this study. Information were collected from many resources such as outlet owners, producers, workers, processing operators and marketing staff. We found that 4 attributes from consumers were taste, color, aroma and texture which were answered by nine technical responses. In term of product performance, based on product comparison analysis, we found that the consumers much more satisfy with suwar suwir produced by Barokah Jaya compare to Primadona and Kartini.Furthermore, the result of QFD analysis showed that suwar suwir from Barokah Jaya could achieve the target compare to the competitors. Based on the results, we concluded that Barokah Jaya could answer consumer’s expectation using its technical responses.
Key words: Quality Function Deployment, Suwar-suwir
1. INTRODUCTION
Cassava is an agricultural commodity with a huge market potential, which could be further processed for various products. One of
the cassava based products is suwar suwir,a
traditional food from Jember, Indonesia. Small and medium industries are utilizing cassava as
a raw material to produce suwar suwir, which businessman to reach consumer’s satisfaction, through assessing, evaluating and predicting their behavior.
One of the methods used for assessing or evaluating consumers need is Quality Function Deployment (QFD). Ariani (1999) explained that QFD is a planning and a product
improvement method used by product
improvement team to define consumers’ need and expectation briefly. Besides, this method could also being used to evaluate product potential and to discover consumer’s needs and
expectations (Miranda and Amin, 2003). Limited information and evaluation about
consumer’s expectation of suwar suwir is a
strong reason why this traditional product fail in the market. This condition needs to be investigated especially with the market testing to reach personal response and consumer
needs. Various brands of suwar suwiralso need
to be evaluated to describe product quality and its preference based on consumers need and expectation.
The objective of this study was to identify consumers’ needs and expectations through defining the product attributes and consumer’s expectations of suwarsuwir. Based on the implementation of QFD, improved strategy would also be appeared to support
quality improvement of suwar suwir.
2. MATERIALS AND METHODS
2.1. Material and tools
Brands of suwar suwir used in this
Kartini. These brands are widely recognized and easily to find in the traditional food market around the district.
2.2. Location
Evaluation was conducted in production
unit of suwar suwirin Barokah Jaya and some
food stores, which provide traditional foods as a souvenir. Analysis of data was conducted in
Agroindustrial System and Management
Laboratory, Faculty of Agricultural
Technology, University of Jember.
2.3. Data Collection
In this study, questionnaire was designed to collect data and information such as Consumer’s need, Importance to Consumers,
Consumer Satisfaction Performance, and
Competitive Satisfaction Performance.
Questionnaire was addressed to production
unit’s employer, owners of food store and loyal consumers. Another questionnaire (technical response) was addressed to the owner of Barokah Jaya, to obtain information such as quantity of sugar, fermented cassava, milk, food preservatives, mixing process, cooking process and packaging process. In term of preference test, questionnaire was addressed to 70 respondents to evaluate their preference of
suwar suwir produced by Barokah Jaya, Primadona, dan Kartini.
2.4. Data Analysis.
2.4.1. Data Analysis of Quality Function Deployment (QFD)
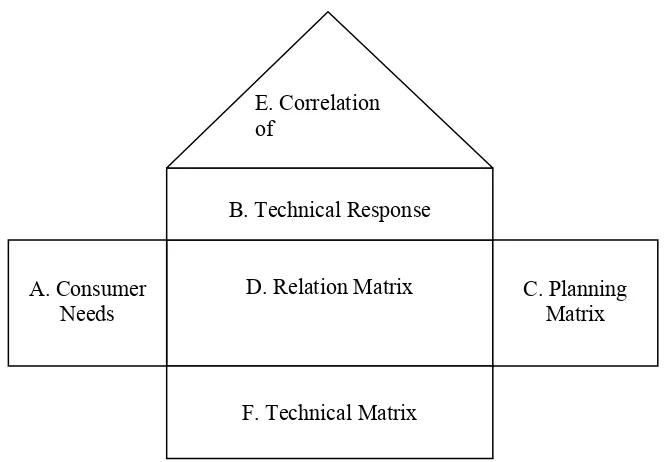
The data were analyzed based on the components in house of quality as a part of QFD method below.
Figure 1. House of Quality
Consumer Need is information from costumers about product attributes related to what they
need from the product. Technical Response is
technical competence of production unit to response consumers’ needs.
Planning Matrixs
a. Importance to Consumers, importance level of product attribute to costumers.
(1) b. Consumers Satisfaction Performance, consumers satisfaction level to product’s attribute.
(2) D. Relation Matrix
A. Consumer Needs
C. Planning Matrix
F. Technical Matrix B. Technical Response
c. Competitive Satisfaction Performance, consumer satisfaction level to competitor’s products.
(3)
d. Goal, the highest score, ratio of consumers
satisfaction performance to competitive satisfaction performance, to explain producer objectives in responding to the consumers needs.
e. Improvement Ratio, the value used in quality improvement of product’s attribute. Day (1993) explained that if the value more than 1, means that the attribute of product require to be improved, because less than goal value.
(4)
f. Sales Point,the most important attribute to the consumers. Improvement of technical response would give contribution to obtain
higher sales point (Cohen, 1995). Sales
point value of 1.5 strongly affect total sales, values of 1.2 give weak effect, while value of 1 would not give any effect to the sales.
g. Raw Weight, the weight value of product’s
attribute. Normalized Raw Weight is the
percentage of Raw Weight value.
Relationship Matrix, a relationship between technical responses with consumers needs. This matrix gives information needed to optimize production process (Tjiptono, 1995).
Technical Correlation Response
Technical Correlation Response is defined as relationship among technical responses. These relationship could be positive, negative and no relationship.
Technical Matrix
Technical matrix (Figure3.3) consist of information as follows:
1. Contribution, explains the strength of technical response of consumer satisfaction.
Contribution describes priority from
producer responses to consumer response.
Normalized contribution shows the percentage of contribution value.
2. Targeting, the purposes would be achieved by the company to provide consumers need using technical response.
In this study, suwar suwirproduced by
three different producers, namely Barokah Jaya, Primadona, and Kartini, were tested using preference test. The sample was put into the plate using 3 different codes and addresses to 70 respondents. The respondents’ preference
is represented based on the score 1 (very like), 2 (like), 3 (moderate), 4 (unlike), and 5 (very unlike). The result of preference test would explain positive characteristic to improve product quality (Mabesa, 1986). The result was presented using bar-chart to show
consumers satisfaction level to suwar suwir
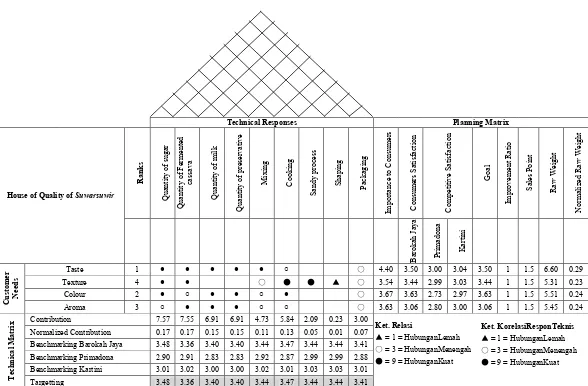
58 3. RESULTS AND DISCUSSION
Technical Responses Planning Matrix
House of Quality of Suwarsuwir
R
ix Contribution 7.57 7.55 6.91 6.91 4.73 5.84 2.09 0.23 3.00
Normalized Contribution 0.17 0.17 0.15 0.15 0.11 0.13 0.05 0.01 0.07
Benchmarking Barokah Jaya 3.48 3.36 3.40 3.40 3.44 3.47 3.44 3.44 3.41
Benchmarking Primadona 2.90 2.91 2.83 2.83 2.92 2.87 2.99 2.99 2.88
Benchmarking Kartini 3.01 3.02 3.00 3.00 3.02 3.01 3.03 3.03 3.01
Targetting 3.48 3.36 3.40 3.40 3.44 3.47 3.44 3.44 3.41
Ket. Relasi
ڸ= 1 = HubunganLemah
ۑ= 3 = HubunganMenengah
ە= 9 = HubunganKuat
Ket. KorelasiResponTeknis
ڸ= 1 = HubunganLemah
ۑ= 3 = HubunganMenengah
ە= 9 = HubunganKuat
Based on the analysis of the questionnaire and some information from respondents, figure 2 shows the house of quality and explains general condition of consumer’s needs and
comparison among the three selected suwar
suwirproducts.
Consumers Needs
a. Consumers needs (expectation)
Figure 2 shows that taste, color, aroma and texture were the attributes (expected by
consumers) of suwar suwirproducts. Based on
the same figure, we learned that taste was the most important attribute to the consumers, followed by color, aroma, and texture. It means that the consumers use taste (first rank) and color (second rank) attributes as priority in
purchasing of suwar suwirproduct.
b. Consumers Satisfaction level
In term of consumer satisfaction level, we found that the performance of suwar-suwir from Barokah Jaya has higher values of consumerss needs than Primadona and Kartini. It means that the consumers have better preference to Barokah Jaya product than two others competitors, Primadona, and Kartini.
Technical Responses to support consumer needs
The result shows that nine technical responses, which affect product performance (attribute) and response consumers needs were quantity of sugar, quantity of tape (fermented cassava), quantity of milk, quantity of preservative, mixing, sandy process, shaping process, and packaging. More attention should be given to these activities (technical responses) because of their direct influence to quality of the product, including product performance as attribute of product. Nasution (2001), product is a part of marketing mix (product, price, placement and promotion) which give direct impact to increase total sales. Figure 2 shows that the taste has a strong relationship with the quantity of sugar, tape, milk, preservative as well as mixing process. Color has strong relationship with the quantity of sugar, milk, and preservative, as well as the cooking process. The aroma has strong relationship with the quantity of tape, milk and preservative. For texture, it has strong relationship with the quantity of milk, and tape, as well as cooking and sandy processes.
Goal
The performance level or target could be achieved by the producers to support
consumer needs (consumers satisfaction).
Figure 2 shows that suwar suwirfrom Barokah
Jaya could reached goal value, which means that the product could achieve consumer expectation compare to the competitors (Primadona and Kartini).
Targeting
Target (targeting) is the objective
would be achieved by the producer to support
consumer expectation using technical
response. Targeting value was based on
benchmarking value from suwar suwirproduct
of Barokah Jaya and two other competitors (Primadona and Kartini). The highest value would be used as a target. Figure 2 shows that suwar-suwir of Barokah Jaya could achieved all of the target value for all technical
responses.Its means that suwar suwir of
Barokah Jaya could support consumers satisfaction through technical response much better compare to the other competitors (Primadona and Kartini).
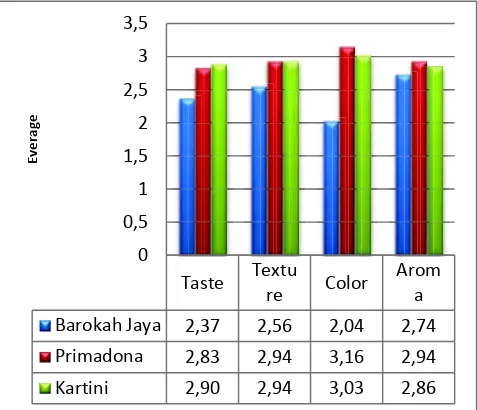
SensoryTest (Preference Method)
Sensory evaluation with preference test was used to evaluate consumer preferences
related with product attributes of suwar suwir
from Barokah Jaya and two other competitors (Primadona dan Kartini). Result of sensory evaluation could be seen in Figure 3.
Figure 3. Bar-chart of Preference Test of
Suwar Suwir
Taste Textu
re Color
Arom a
Barokah Jaya 2,37 2,56 2,04 2,74
Primadona 2,83 2,94 3,16 2,94
Kartini 2,90 2,94 3,03 2,86
In Figure 2 (lower value means higher level of preference), it was shown that in
general, all respondents prefer suwar suwir of
Barokah Jaya to two other competitors (Primadona dan Kartini) for all attributes.
Especially for color (warna) and taste (rasa) of
product, these attributes have similar result to the consumer’s needs as priority or driven
factor of purchasingsuwar suwir.
Proposed Strategy to Improve Quality of Suwarsuwirbased on QFD
Based of QFD analysis, proposed strategy
to improve quality of suwar suwir product are
as follows:
Consumers Satisfaction Level
Generally, consumers satisfaction is
the ratio between product quality to
consumer’s needs or expectation. Even
thoughthe result shows that consumers
satisfaction level of suwar suwirfrom Barokah
Jaya is higher than the two other competitors, the quality improvement should be maintained continuously based on the consumer’s needs. Improvement of product performance is not merely for the studied attributes but also for other attributes in order to answer all of the consumer expectations.
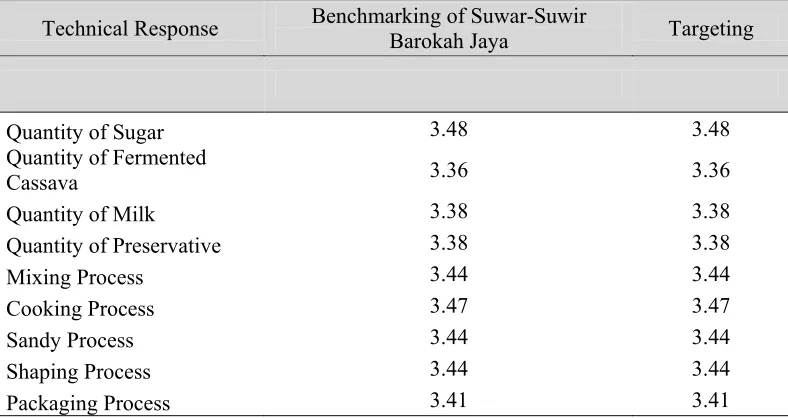
Target Achievement based on application of QFD
Target is an objective that would be achieved by the producers to support their consumer needs through technical response of the highest value of the benchmark. The
technical response, benchmarking and
targeting value of Barokah Jaya, which were analyzed with QFD analysis, could be seen in Table 1.
Table 1. The value of Technical Response, Benchmarking and Targetingof Suwar-Suwir Barokah
Jaya
Technical Response Benchmarking of Suwar-Suwir
Barokah Jaya Targeting
Quantity of Sugar 3.48 3.48
Quantity of Fermented
Cassava 3.36 3.36
Quantity of Milk 3.38 3.38
Quantity of Preservative 3.38 3.38
Mixing Process 3.44 3.44 technical response could achieved targeting
value.It means that suwar suwir produced by
Barokah Jaya could support consumer
expectations. However, the improvement is still required through improvement of technical response in daily activities.
Continuing quality improvement
should be done not only by Barokah Jaya, but
also by other competitors in suwar suwir
industry. Packaging,as one of the technical responses, needs to be improved. Packaging
material with sufficient protection, such as aluminium foil, is strongly recommended to be applied to avoid contamination that affects quality of the product.
Based on sensory evaluation, suwar
suwir produced by Barokah Jaya has a better result than those produced by the two other
competitors. Through better technical
response, Barokah Jaya could support their consumer needs better than the two others. The competitors could use Barokah Jaya as a
reference in production system, product
As the most important buying decision factor, taste needs more attention during production.
Attention for competitors or other suwar-suwir producers
Generally, based on the result,
Primadona and Kartini have lower
benchmarking value than Barokah Jaya. These competitors, therefore, should follow Barokah Jaya to improve their product, especially for taste and color attributes. The competitors should give more attention to the taste-related components such as the composition of sugar, tape, milk, and preservative, as well as the mixing process. Furthermore, attention to color-related components such as composition of sugar, milk, and preservative, as well as the cooking process should be taken also into account.
Moreover, in order to improve the product’s performance and to widen its market, innovation in packaging system should be done.
In addition, hygiene also needs to be improved during its production, not only for its quality but also for its safety.
4. CONCLUSSIONS
a. In term of consumer needs, the analysis result shows that the attribute (expected by
consumers) of suwar suwir products were
taste, texture, color and aroma. The levels of Importance to Consumers, from the most expected attribute of the consumers were taste, color, aroma, and texture.
b. Barokah Jaya as a producer of suwar suwir
has higher value of satisfaction level and
Pendekatan Sisi Kualitatif. Jakarta: Ghalia Indonesia.
Cohen, L. 1995. Quality Function Deployment:
How to Make QFD Work For You. Addison Wesley Publishing Company.
Day, R. G. 1993. Quality Function Deployment
Linking a Company with Its Costumer.Milwuakee Wisconsin USA: ASQC Quality Press.
Mabesa, L. B. 1986. Sensory Evaluation of
Food principle and Methods. Filipina: College of Agricultural UPBL.
Miranda dan Amin, W. T. 2003. Istilah
Penting Manajemen Mutu. Jakarta: Harvindo.
Nasution, M. N. 2001. Manajemen Mutu
terpadu (Total Quality Manajemen). Jakarta: Ghalia Indonesia.
Supranto, J. 2001. Pengukuran Tingkat
Kepuasan Pelanggan Untuk Menaikkan Pangsa Pasar. Jakarta: Rhineka Cipta.
Swasta, B dan Irawan. 1990. Manajemen
Pemasaran Modern. Yogyakarta: Liberty.
Tjiptono, R. 1995. Total Quality Manajemen.