LIQUEFACTION POTENSIAL EVALUATION BASED ON
CRITICAL STATE PARAMETER CONCEPT AND PIEZOCONE
TEST OF SANDY SEDIMENTS PADANG INDONESIA
Anastasia Sri Lestari
*, Metta Devi Hartadi
*,
Anthony Kesumah* *Department of Geotechnical Engineering
University of Chatolic Parahyangan , Jawa Barat, Indonesia
Abstract
-
Liquefaction is a process of change in the condition of a water-saturated sandy soil into a liquid, due to increased pore water pressure (pore water pressure) caused by dynamic loads that are generally associated with earthquake. Research activity is intended to find the relationship between variations in soil density sand with the possibility of liquefaction. The more dense sand soil liquefaction potential, the possibility of getting smaller. This study uses varying density to determine the potential for liquefaction with Triaxial Test and Test Piezocone. This modeling using sand Padang with varying density and the test performed of Triaxial CU to obtain a graph of the effective stress vs void ratio, the graph obtained from a critical state conditions in order to obtain potential areas of liquefaction. And the results of modeling sand soil samples with multiple density test Piezocone then analyzed using the method of Shibata Teparaksa Based with the value of the maximum seismic acceleration at the surface of 0,25g and 7.9 Richter scale earthquake. This method can determine the liquefaction potential or not. Modeling results obtained from the relationship that the sandy soil density is proportional to the value of the tip resistance and security factors.Keywords: Liquefaction, critical state
I. INTRODUCTION
Liquefaction is a process of change in the condition of a water-saturated sandy soil into a liquid, due to increased pore water pressure (pore water pressure) caused by dynamic loads that are generally associated with earthquake
.
Liquefaction events that occur when an earthquake happens under cyclic loading in water-saturated sandy soil is characterized by the presence of ground motion in the horizontal direction, the water seeps out of the ground fractures that cause mass soil change from solid to liquid mass In general, the potential for soil liquefaction occurs in saturated loose sand due to water movement led to an increase in cyclic pore water pressure and a decrease in the effective shear strength of the soil
This condition causes the movement of building foundations and sometimes causes the building collapse.
Based on many of studies have concluded that the potential for soil liquefaction occurs in loose sand or a low sand relative density, average grain size of soil, long time and large cyclic loads .
Liquefaction potential analysis can be performed based on the soil parameters laboratory test or field tests example Cone penetrometer test , N- Standard Penetrometer Test.
Critical state theory is behaviour of saturated soil
in triaxial compression test idealism and the test is
performed on disturbed soil samples. It is said that if the soil and granule materials continuously shaked until it is become liquid, then the soils and granuled materials will be at critical state
II. THE RESEARCH METHOD
II.A. Sampling
Sampling of soil from Padang Samples were taken in an area damaged and tested in the laboratory and modeling
II.b. Index Properties Laboratory Test
Table. 1. Index properties from Laboratory test
Index Properties Sample
Natural water content, wn (%) 10.75
Void ratio , e0 0.63
Soil density, γ (gr/cm3) 1.77
Dry soil density, γd (gr/cm
3
) 1.60
Specific grafity, Gs 2.62
Void ratio minimun, emin 0.60
Dry soil density maksimum, γd maks (gr/cm
3
) 1.61
Void ratio maximum, emax 0.72
Dry soil minimum, γd min (gr/cm3) 1.40 Water content dry soil, ws (%) 1.64
Relative dencity, Dr (%)
Dry soil dencity, γdry (gr/cm3)
20 1.4651
25 1.4750
40 1.5056
Fig 2. Grain Size distribution
Persentase Gravel (%) 0.16 %
Persentase Coarse-Med Sand (%) 53.78 %
Persentase Fine Sand (%) 45.48 %
Persentase Silt - Clay (%) 0.58 %
According Tsuchida (1970), the type of soil liquefaction potential experienced in the range of sand. In these soil samples, soil type is in the range of sand and then this soil liquefaction potential experience
Tokimatsu and Yoshimi (1983) gives the fact that the fine grain content of less or equal to 5% , this soil liquefaction potensial
II.C. Triaxial CU Laboratory Test
Fig3. Triaxial CU Test
Fig 4. Failure condition
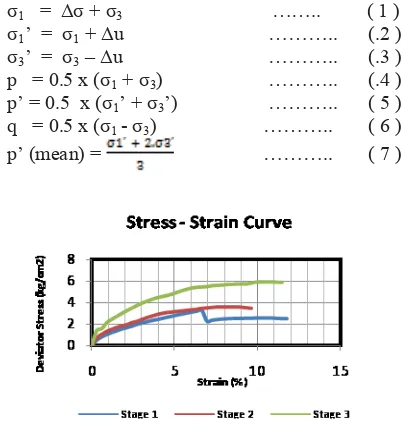
In this study, three types of density selected to be tested, the density of 20%, 25%, and 40%, with a confining pressure for each density of 0.6 kg / cm2 (stage 1), 0.8 kg / cm2 (stage 2), and 1 kg / cm2 (stage 3).
σ1 = Δσ + σ3 …….. ( 1 )
σ1’ = σ1+ Δu ……….. (.2 )
σ3’ = σ3–Δu ……….. (.3 )
p = 0.5 x (σ1+ σ3) ……….. (.4 )
p’ = 0.5 x (σ1’ + σ3’) ……….. ( 5 )
q = 0.5 x (σ1 - σ3) ……….. ( 6 )
p’ (mean) = ……….. ( 7 )
Fig 6.Pore water pressure, density 20 %
Fig 7. Stress-strain sample , density 25 %.
Fig 8. Pore water pressure, density 25 %
Fig.9. Stress-strain sample. Density 40 %
Fig. 10. Pore water pressure,density 40 %
Tabel 2. Hubungan e - p’
Dr ec e0
Tegangan Keliling (kg/cm2)
p' (initial) (KPa)
p' (mean)
(KPa) 20 0.620 0.788 0.6 60.000 194.075 20 0.577 0.788 0.8 80.000 259.735 20 0.583 0.788 1 100.000 296.476 25 0.667 0.776 0.6 60.000 132.331 25 0.652 0.776 0.8 80.000 144.746 25 0.488 0.776 1 100.000 210.805 40 0.428 0.740 0.6 60.000 248.001 40 0.473 0.740 0.8 80.000 201.517 40 0.553 0.740 1 100.000 163.489
Fig.11. Critical state Line ( e- p’)
From this Fig11 obtained line is critical state line. according to Mike Jefferies and Ken Been (2006), liquefaction potential can be seen from the critical state line, where the area above the line is a condition in which the soil (sand) has the potential liquefaction, while the area below the line indicates where the ground state (sand) is not potentially liquefaction.
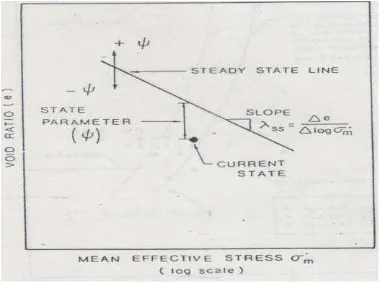
Fig.12. State parameter Definition
State parameter is defined as the difference between initial void ratio with void ratio at steady state condition at the same mean effective stress as dhown Fig 12.
When the state parameter is positive, the soil exhibits contractive behaviour and may susceptible to liquefaction
II.D. FIELD TEST-CPTU
Further development of the tool is the sondir electrically sondir where ground forces due to the penetration resistance can be recorded directly sondir once so penetration is done continuously, not gradually as well as mechanical sondir. In addition, this electric sondir also accompanied by measurement of excess pore water pressure so that is better known as CPTu or Piezocone Penetrometer Test.
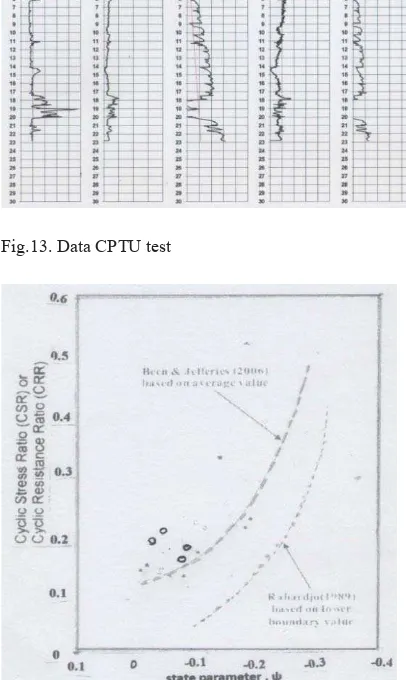
Fig.13. Data CPTU test
Fig14. The relation CRR –ψ Meke Jefferies & Ken Been , (2006) and Rahardjo ( 1989) based on lower boundary value
Fig 14, determined target value of ψ for data on the fiekd based on correlation with Cyclic Resistance Ratio (CRR) by Mike Jefferies & Ken Been and the correlation of ψ and CRR was developed by Rahardjo ( 1989) using low boundary based on case histories data.
Plot from field test ( CPTU) –State parameter ψ And CRR, the condition is liquefaction
Ln ( Qp/k)
Ψ= - = state parameter ( 8 ) m
Qp = Tip resistence normalized by mean stress ( qc - po )/po’ ( 9 )
m = 8.1 -2.3 log λ ( 10 )
k = 8 + {0.55/( λ- 0.01 ) } ( 11)
II.E.MODELING
Fig.15. Modeling from sand on “ drum” with Dr 15, 40 %
With CPTu
Fig.16. Shibata & Terapaksa Method for Liquefaction
d o maks
o
r
g
a
'
1)
-(M
1
.
0
'
0
V
V
Tokimatsu and Yoshimi formula has given an equation about cyclic stress ratio due to the earthquake
Depth qc fs u2 (m) (kg/cm2)(kg/cm2)(kg/cm2) 0.00 -0.0088 0.0000 0.0025 0.01 0.0304 0.0000 0.0041 0.02 0.0304 0.0000 0.0254 0.03 0.1286 0.0000 0.0341 0.04 0.1876 0.0000 0.0215 0.05 0.2268 0.0000 0.0444 0.06 0.1876 0.0000 0.1125 0.07 0.2661 0.0002 0.0389 0.08 0.3447 0.0002 -0.0173 0.09 0.3840 -0.0002 -0.0181 0.10 0.5018 0.0000 -0.0244 0.11 0.6982 0.0009 -0.0244 0.12 0.7179 0.0000 -0.0252 0.13 1.0125 0.0002 -0.0252 0.14 1.2089 0.0007 -0.0276 0.15 1.3267 0.0000 -0.0260 0.16 1.5035 -0.0011 -0.0236 0.17 1.6017 -0.0002 -0.0260 0.18 1.7195 -0.0002 -0.0252 0.19 1.8177 -0.0011 -0.0221 0.20 1.9159 -0.0019 -0.0236 0.21 2.0141 -0.0008 -0.0244 0.22 2.0141 -0.0011 -0.0221 0.23 1.9748 -0.0017 -0.0331 0.24 2.1712 -0.0017 -0.0205 0.25 2.1909 -0.0015 -0.0276 0.26 2.2301 -0.0021 -0.0268 0.27 2.3087 -0.0017 -0.0284 0.28 2.3873 -0.0017 -0.0339 0.29 2.4658 -0.0013 -0.0308 0.30 2.5051 -0.0015 -0.0324 0.31 2.5444 -0.0008 -0.0363 0.32 2.5444 -0.0002 -0.0276 0.33 2.6033 -0.0017 -0.0371 0.34 2.6819 -0.0013 -0.0300 0.35 2.6033 -0.0019 -0.0260 0.36 2.7211 -0.0017 -0.0244 0.37 2.7211 -0.0008 -0.0213 0.38 2.7801 0.0000 -0.0236 0.39 2.8783 0.0000 -0.0181 0.40 2.7997 0.0000 -0.0276 0.41 2.9372 0.0000 -0.0157 0.42 3.0550 0.0000 -0.0189 0.43 3.4478 0.0000 -0.0244 0.44 7.8865 0.0000 -0.0165
0
0 0.0002 0.0004 0.0006 0.0008 0.001 Tahanan Selimut Tekanan Air Pori
vs Kedalaman
kg/cm2 kg/cm2 kg/cm2
m
m m
Fig. 17. CPTu Modeling from dencity 15 %
Depth qc fs u2
(m) (kg/cm2) (kg/cm2) (kg/cm2)
0.00 0.0373 0.0000 0.0015
0.01 0.0177 0.0000 0.0015
0.02 0.0570 0.0000 0.0015
0.03 0.8656 0.0000 0.0094
0.04 1.5727 0.0000 0.0086
0.05 1.7298 0.0000 0.0339
0.06 2.9279 0.0000 0.0236
0.07 3.8117 0.0000 -0.0025
0.08 4.1063 0.0000 -0.0056
0.09 4.5384 0.0000 -0.0056
0.10 5.3829 -0.0009 -0.0080
0.11 6.0310 -0.0014 -0.0072
0.12 6.6791 -0.0003 -0.0056
0.13 6.9934 -0.0007 -0.0033
0.14 7.6611 -0.0005 -0.0072
0.15 8.3878 -0.0005 -0.0056
0.16 9.0163 0.0004 -0.0096
0.17 9.9787 -0.0011 -0.0096
0.18 10.7250 -0.0009 -0.0048
0.19 11.0790 -0.0005 -0.0072
0.20 12.0410 0.0006 -0.0064
0.21 12.5120 -0.0003 -0.0048
0.22 13.2000 -0.0005 -0.0104
0.23 13.6510 -0.0001 -0.0080
0.24 13.7300 -0.0005 -0.0104
0.25 14.0250 0.0002 -0.0088
0.26 14.4570 -0.0007 -0.0072
0.27 14.6330 -0.0003 -0.0056
0.28 14.7320 -0.0005 -0.0080
0.29 15.1440 -0.0009 -0.0088
0.30 15.3800 -0.0016 -0.0080
0.31 15.8510 -0.0003 -0.0080
0.32 15.8710 -0.0003 -0.0104
0.33 16.0870 0.0000 -0.0056
0.34 16.3420 0.0000 -0.0064
0.35 16.6560 0.0000 -0.0088
0.36 16.7550 0.0000 -0.0080
0.37 17.1280 0.0000 -0.0080
0.38 18.3650 0.0000 -0.0072
0.39 19.2100 0.0000 -0.0056
0.00
0 0.0002 0.0004 0.0006 0.0008
Tahanan Selimut
Tekanan Air Pori vs Kedalaman
kg/cm2 kg/cm2 kg/cm2
m
m m
Fig. 18. CPTu Modeling from dencity 40 %
The Modeling Dr 15 % and 40 % from Shibata & Terrapaksa formula the soil was indication that liquefaction potensial condition
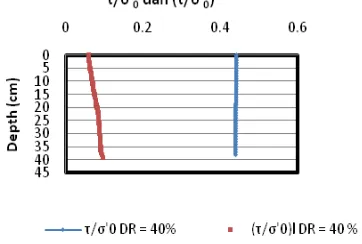
Fig.19. The condition modelling with density 40 %
Based on Fig 19. The sampling modelling susceptible to liquefaction , with Magnitude earthquake = 7.9 Richter
III. CONCLUSIONSUMMARY
x Preliminary liquefaction potensial evaluation based on Grain distribution criteria show that the sampling is susceptible to liquefaction
x From the CU Triaxial test results, obtained the critical state line that produces a line equation
y = -0.00206 x + 0939; with the equation of this line can also be known average effective stress which produces a critical state for a certain void ratio.
x Based on modelling CPTu test with 15% and 40% density the soil is susceptible to liquefaction
x Quality control determined based on CPTu test on field in Padang , the soil 0 – 10 m is susceptible to liquefaction
REFERENCES
[1] Jefferies, Mika dan Ken Been. (2006). Soil Liquefaction,
A Critical State Approach.Taylor and Francis: New York
.
[2] Schofield, Andrew dan Peter Wroth. (1968). Critical
State Soil Mechanic, McGraw-Hill:London
[3] Prakash, Shamser M. (1981). Soil Dynamics, McGraw-Hill: New York.
[4] Kramer, Steven L., (1996). Geotechnical Earthquake
Engineering. Prentice Hall, Englewood Cliffs, New
Jersey.
[5] Rahardjo.P.P.(1993), Evaluation of liquefaction
Potensial , Geotechnical Engineering Centre .
[6] Lunne, T., Robertson, P.K., and Powell, J.J.M. (1997).Cone Penetration Testing in Geotechnical
Practice.1st ed. Blackie Academic and Professional,