HABITAT CHARACTERISTIC OF GREEN TURTLE
(
Chelonia mydas
) NESTING POPULATION AT
PANGUMBAHAN BEACH, SUKABUMI, WEST JAVA
YULIANA FITRI SYAMSUNI
GRADUATE SCHOOL
BOGOR AGRICULTURE UNIVERSITY
BOGOR
ISSUES RELATED WITH THIS THESIS AND THE
SOURCE OF INFORMATION
With this I declare that the thesis of “Habitat Characteristic of Green Turtle (Chelonia mydas) Nesting Population at Pangumbahan Beach, Sukabumi, West Java” is my own work under direction by advisory committee and never been submitted at any other universities. Information sources cited from other authors which is published and unpublished have been mentioned in the texts and listed in references at the end of this thesis.
Bogor, February 2012
Yuliana Fitri Syamsuni
ABSTRAK
YULIANA FITRI SYAMSUNI. KARAKTERISTIK HABITAT POPULASI
BERTELUR PENYU HIJAU (Chelonia mydas) DI PANGUMBAHAN,
SUKABUMI, JAWA BARAT Di bawah bimbingan NEVIATY PUTRI ZAMANI
dan KAREN VON JUTERZENKA.
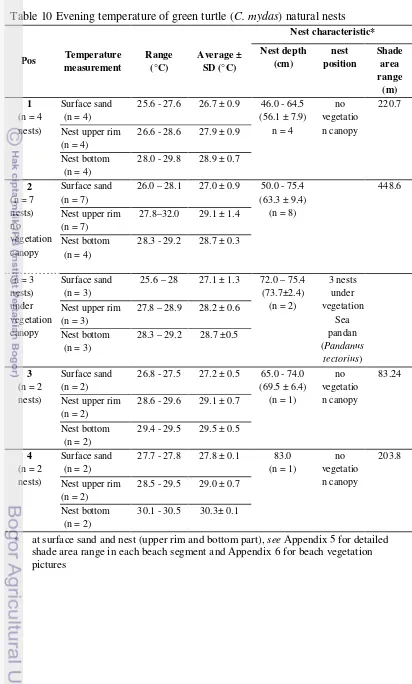
Pantai Pangumbahan merupakan pantai peneluran Penyu Hijau (Chelonia mydas) yang masih bertahan di wilayah Jawa Barat. Strategi konservasi penyu hijau di Pantai Pangumbahan, Sukabumi dilakukan dengan cara pemindahan telur penyu ke penangkaran. Aksesibilitas dan tingkat gangguan di pantai penting bagi individu penyu dalam pemilihan lokasi untuk bertelur. Penyu Hijau banyak ditemukan bertelur di bagian tengah Pantai Pangumbahan, khususnya di Pos 2. Kondisi suhu di sarang alami ternyata berbeda dengan di sarang buatan (penangkaran). Suhu sarang alami berkisar 26.0-29.6 °C dengan rata-rata (28.2±0.8)°C pada bagian atas dan 28.0-29.5 °C dengan rata-rata (28.6±0.8) °C pada bagian dasar, sedangkan suhu sarang buatan berkisar 25.7-28.3°C dengan rata-rata (27.2±0.8)°C pada bagian atas, dan bagian dasar berkisar 28.3-33.2°C dengan rata-rata (29.6±1.5)°C. Karaketristik sarang alami dan buatan tidak sama. Jika dilihat dari tipe substrat dasarnya, Pantai Pangumbahan memiliki aksesibilitas yang mudah bagi penyu untuk naik. Jarak tubir pantai sangat dekat dan langsung berhadapan dengan Samudera Hindia. Suhu permukaan laut berbanding terbalik pada saat jumlah penyu hijau bertelur tinggi dan pada saat rendah. Suhu pada saat jumlah penyu hijau bertelur tinggi lebih dingin dan terdapat gradien suhu di permukaan sedangkan pada saat jumlah penyu bertelur rendah, suhu lebih hangat dan merata.
ABSTRACT
YULIANA FITRI SYAMSUNI. HABITAT CHARACTERISTIC OF GREEN
TURTLE (Chelonia mydas) NESTING POPULATION AT PANGUMBAHAN
BEACH, SUKABUMI, WEST JAVA. Under direction of NEVIATY PUTRI ZAMANI and KAREN VON JUTERZENKA.
Pangumbahan beach is one of green turtle (Chelonia mydas) nesting beach which still exist in West Java. Conservation strategy for green turtle in Pangumbahan beach include relocating eggs into hatchery sites. Accessibility and disturbance level at beach is important for seaturtle to choose preferable nesting sites. Most of Green Turtle in Pangumbahan preferred to nest at the centre part of the beach, especially at Pos 2. Natural nest temperature characteristic was different with the artificial ones (hatchery). Natural nest temperature ranged 26.0-29.6 (28.2±0.8)°C at the upper rim and 28.0-29.5 °C with mean of (28.6±0.8) °C at the bottom, while artificial nests temperature ranged 25.7-28.3°C with mean of (27.2±0.8)°C at the upper rim and 28.3-33.2 °C with mean of (29.6±1.5)°C at the bottom. Characteristic of natural nests and artificial nests were dissimilar. According to the bathymetry, Pangumbahan Beach is quite accessible for seaturtle to land. Pangumbahan beach line is close to reef crest and directly connected with Indian Ocean. Sea surface temperature at high nesting abundance period was contrary to the period of low nesting abundance. The sea surface temperature during the high nesting period was cooler than at the low nesting abundance period. There was temperature gradient signature at high nesting abundance period whereas even temperature distribution occurred during low nesting abundance period.
SUMMARY
YULIANA FITRI SYAMSUNI. Habitat characteristic of green turtle (Chelonia mydas) nesting population at Pangumbahan, Sukabumi, West Java. Under direction of Neviaty Putri Zamani and Karen von Juterzenka.
Seaturtles are endangered species. Five seaturtle species inhabit Indonesian archipelago and the green turtle (Chelonia mydas) is the most commonly found here. One of the major green turtle nesting sites in Java Island is Pangumbahan Beach. Temperature holds an important role for each stage of sea turtle lives, both at neritic and pelagic. Seaturtle is defined as poikilotherm, long migration and natal homing animals. Conservation strategy at Pangumbahan is focusing on protection of green turtle population at only at nesting beach, not yet expanded toward the sea. Information about green turtle existence at sea habitat remains unclear. The strategy includes relocating all eggs from natural beach into hatchery sites where all eggs were treated similarly. Therefore, this study was done in aiming to 1) identify beach topography and substrate type of Pangumbahan Beach, 2) identify characteristic of green turtle natural nest, 3) identify characteristic of green turtle artificial nest, 4) compare the characteristic of green turtle natural nest and artificial nest, and 5) describe habitat type and sea surface temperature regime in Pangumbahan near shore habitat.
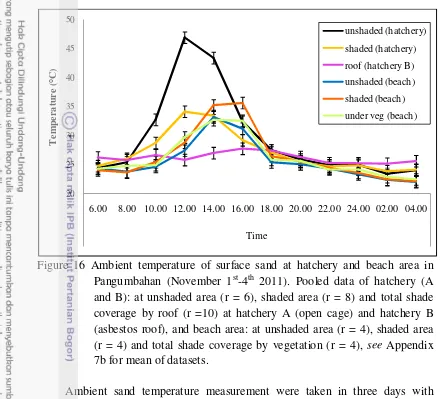
Nest temperature of green turtle natural nest (n=18) and artificial nests (n=18) were measured in the evening. Measurements were taken at surface sand around nest, nest upper rim and nest bottom by using a non contactable infra-red thermometer. Natural nest temperature was measured during oviposition (egg laying). Temperatures of artificial nests were measured before the relocated eggs were reburied. Ambient sand temperature measurement were taken in three days with interval of 2 hours for each measurement to observe the daily fluctuations. Measurement were taken at hatchery open cage (A), hatchery with asbestos roof (B) and beach area. Measurements were taken at the surface and subsurface (± 10 cm). The shading condition was taken into account, categorized by unshaded, shaded and total covered by shade. Unshaded hatchery was represented by hatchery A and total covered by shade was represented by hatchery B.
There is a trend of cooler temperature at more humid sand at natural nests and warmer temperature at drier sand at artificial nests. Humidity is important for hatching. If sand was too dry then the eggs will not be hatched. This is quite an issue in Pangumbahan, thus, Pangumbahan’s wardens gave a lot of effort to maintain the sand humidity at hatchery and beach area. They watered the beach area by seawater and the hatchery by freshwater to maintain humidity. This strategy was done by experience where many green turtles were failed to nest during dry season and there was 0% emerging success of green turtle hatchlings at fibber roofed hatchery last year (Janawi, 2010, personal communication). Hence, it is important to monitor sand humidity and temperature for future strategy.
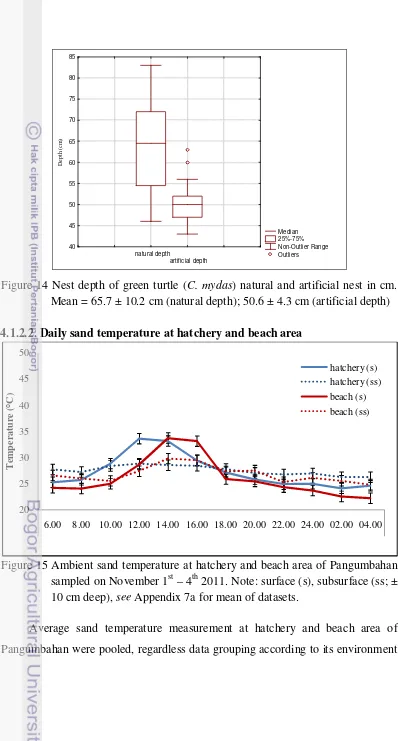
Rainfall was quite high during the measurement. The average temperature of surface sand was not significantly different during the beginning of daylight (of 6.00 am – 8 am) and dusk until dawn (18.00 pm – 04.00 am). Different fluctuation occurred during 10.00 am until 14.00 pm. In general, ambient temperature at hatchery was warmer than at beach area. Ambient temperature at unshaded area in hatchery was the highest and hatchery with total covered by roof (hatchery B) was the lowest. There was a trend of drier sand at warmer temperature at the surface and more humid sand at cooler temperature at subsurface.
The sand was sampled during daylight. Intense rain fall during sampling made the humidity was slightly higher than at prevoius sampling at nest. High humidity at subsurface of hatchery B was due too watering effort by the wardens.
Near shore habitat type around Pangumbahan Beach is presented by sea bottom substrate map produced from Landsat satellite image. The sea bottom substrate was classified into five substrate type utilizing the most commonly used algorithm, Lyzenga equation. The substrate type are live corals, dead corals, seagrasses and or/ seaweeds, seawater and sand substrate.
Pangumbahan coast’s bottom substrate was predominantly dead corals. We may also imply the accessibility for green turtle to migrate toward nesting beach which indirectly leads to nesting beach selection. Large seagrass and/or seaweed meadow extended eastward off Pangumbahan coast. There was an extensive
Sargassum (Divison: Phaeophyta) meadow grew at eastern part of Pangumbahan Beach. It was at the outermost part of Pos 1 extended eastward. Patches of other seaweed genus found here were Amphiroa, Galaxaura, Gracilaria, Gelidium,
Jania (Division: Rhodophyta); Enteromorpha, Ulva, Codium (Division: Chlorophyta). Small patches of seagrass Halodule pinifolia (Division: Cymodoceae). Green turtle (Chelonia mydas) were grazed upon Halodule,
Gelidium, Gracilaria, Amphiroa, Codium and Ulva (Marquez-M, 1990 and Lopez-Mendilaharsu et al., 2006). Cikarang estuary is a steep rocky shore which bottom substrate was dead corals. Extensive seagrass and/or seaweed meadow grow in front of dead corals area. However, there were also many seaweed grow attached to the rock near shore. Seaweed genus found there includes Amphiroa,
(Division: Chlorophyta), Padina (Divison: Phaeophyta). Green turtle (Chelonia mydas) were grazed upon Gracilaria, Amphiroa, and Ulva (Marquez-M, 1990 and Lopez-Mendilaharsu et al., 2006).
Monthly mean sea surface temperature distribution map was produced from AquaModis satellite imagery. The map was visualized by Ocean data view program. In order to understand the response of sea surface temperature condition at high and low abundance of green turtle nesting in Pangumbahan. High abundance of green turtle nesting is represented by data by October 2011 and the low one is represented by April 2011. There were 191 individuals of green turtles nesting in October 2011 and 191 individuals in April 2011(UPTD Konservasi Penyu Pangumbahan, unpbublished data).
There was a highly differing pattern of sea surface temperature between the times of high and low abundance green turtle landing at Pangumbahan Beach. Sea surface temperature at the high nesting abundance period of time (October 2011) was cooler than at low (April 2011). There was also temperature gradient signature at the high nesting abundance period of time (October 2011) while at low nesting abundance temperature was evenly distributed. During the high nesting abundance, temperature around Pangumbahan Beach was more or less even with adjacent near shore habitat. However, all this inferences was mainly based on interpretation and speculation. To confirm these inferences, there should be a further investigation compiling green turtle migration and seawater temperature cues by satellite telemetry.
In conclusion, temperature conditions of natural nests and artificial nests were dissimilar. Based on substrate type information, we may imply that Pangumbahan Beach was selected as nesting beach because of its accessibility from open sea. Extensive foods are available around the shore where the potential foraging habitat is indentified at Cikarang Estuary. It supported with food availability and turtle sightings evident. There was contrasting sea surface temperature pattern between the high and low nesting abundance period occurred. Sea surface temperature at high nesting abundance was cooler than at low nesting abundance period. The sea surface temperature was unevenly distributed at high nesting abundance period but even at low nesting abundance period. During the night of high nesting abundance period, there was low temperature pool around Pangumbahan Beach and along the shore. It may be cue for green turtle to find the nesting beach.
It is worth to investigate the incubation temperature continuously at hatchery and natural nests and compare them. Furthermore, estimate the hatched hatchlings sex ratio within each nest. The output will help to develop and to support seaturtle conservation strategy. Migration study is required to identify foraging area which is also crucial to protect.
© Copyright of IPB, 2012
All rights reserved by the law
It is prohibited to cite part or whole part of the script without listing or mentioning the author. Citing is permitted only for the sake of education, research, manuscript, report,
critics or review writing; and not violating IPB.
HABITAT CHARACTERISTIC OF GREEN TURTLE
(
Chelonia mydas
) NESTING POPULATION AT
PANGUMBAHAN BEACH, SUKABUMI, WEST JAVA
YULIANA FITRI SYAMSUNI
Thesis
as one of condition to acquire Master Science in
Study Program of Marine Science
GRADUATE SCHOOL
BOGOR AGRICULTURE UNIVERSITY
BOGOR
Thesis Title : Habitat Characteristic of Green Turtle (Chelonia mydas) Nesting Population at Pangumbahan Beach, Sukabumi, West Java
Name : Yuliana Fitri Syamsuni
Student Number : C551090171
Approved
Advisory committee
Dr.Ir. Neviaty P. Zamani, M.Sc Dr. Karen von Juterzenka
Ketua Anggota
Known by
Head of Study Program of Marine Science
Dean of Graduate School
Dr.Ir. Neviaty P. Zamani, M.Sc Dr.Ir. Dahrul Syah, M.Sc. Agr
Date of Thesis Defence: January 16th 2012
PREFACE
Author would like to express her most earnest gratitude toward Allah SWT for the blessing to complete this study. Topic of this study, which was undertaken since November 2010, was about seaturtle habitat with the complete title of Habitat Characteristic of Green Turtle (Chelonia mydas) Nesting Population at Pangumbahan Beach, Sukabumi, West Java. Many adjustments have been made in completing this study due to logistical and time limitation. Result of the study has been presented in a seminar at January 5th 2012 and thesis defence at 16th January 2012.
Author would like to convey sincere and special thanks to Dr. Ir. Neviaty P Zamani, M.Sc and Dr. Karen von Juterzenka as supervisors who gave support, encouragement, and constructive critics during preparation until finishing of the study. Gratitude also given to UPTD Konservasi Penyu Pangumbahan Sukabumi, who allow the study to be carried out and special thanksy to Pak Janawi, Pak Arip Kuswandi, Agung Rahman and to all of the wardens (the late Pak Darso, Pak Anang, Pak Baban, Pak Sahuna, Pak Wito, Pak Cecep, Pak Emun and other persons who can not be all mentioned) for providing assistance during field work and data support. Thanks to Olivier Yonathan, Betta Wahyu, Marhadi, Maria Ulfa, Windra, Fitriyah Anggraeni, Nur Endah Fitrianto, Yunita Fatma S, Aldino Rahadiyan Wicaksono, Anugrah Adityayuda, Dr. Totok Hestirianoto and Giannina Hattich for the energy and support during field work, sample analysis or data analysis processes. Thanks to Dr. Michael Schmid for the support and encouragement, by his own way. Thanks to Go Wild Indonesia, especially Nick Andrews for accommodation and transportation support during last batch of field work. Special thanks to parent and all of the family members, who had given so much care and support.
May this work can be used as supporting background information for the concerned parties, especially in the effort on seaturtle conservation and management.
Bogor, February 2012
BIOGRAPHY
Author was born in Jakarta, July 24th 1983, as a second child of four children of Sjaiful Muis (father) and Sumarni (mother). The author completed her study at SD Perwira Bhakti in 1995 (primary school), SMPN 2 Bekasi in 1998 (first secondary school), SMAN 2 Bekasi (high school) in 2001. Then, author was accepted at Department of Marine Science and Technology, Faculty of Fisheries and Marine Science, Bogor Agriculture University in 2001 through national selection (UMPTN) and finished it in 2006. Three years later, author continued her study at the same major in Graduate School of IPB.
After finishing bachelor degree, author worked at PT. WOM Finance as administration officer in 2008. Then, author came back to campus to work as assistant at Marine Science and Technology Training (MST) course in 2008 until now. The program is held by Department of Marine Science and Technology, under cooperation between German Academic Exchange (DAAD) and FPIK-IPB. The time span of the work there is three months. The rest of the time, author work as assistance of a long term guess lecturer, Dr. Karen von Juterzenka, assisting in office and lab work. Between the time, author also assisted at Marine Biology subject for graduate and undergraduate students. Lab assisting was familiar to author as she had been practical assistance, both lab and field work, during her undergraduate years in several subject such as Aquatic Invertebrate, Marine Biology and Marine Tropical Ecology.
Author has a special interest in seaturtle conservation. Several events of seaturtle seminar and workshop had been participated, such as Tri National Workshop on Seaturtle Biology and Management in Sabah, Malaysia (2006), 29th Symposium on Seaturtle Biology and Conservation in Queensland, Australia (2009), and Field Technique on Seaturtle Conservation Workshop in Pangumbahan, Indonesia (2010).
CONTENTS
Page
LIST OF TABLE ... xvii
LIST OF FIGURE ... xviii
LIST OF APPENDIX... xx
1 INTRODUCTION ... 1
1.1 Background ... 1
1.2 Hypothesis ... 2
1.3 Objectives ... 2
2 LITERATURE REVIEW ... 3
2.1 General remarks of seaturtle ... 3
2.2 Biological aspects ... 4
2.2.1 Species identification ... 4
2.2.2 Body size ... 5
2.3 Habitat ... 6
2.3.1 Nesting habitat ... 6
2.3.2 Near shore habitat ... 6
2.4 Feeding habit ... 7
2.5 Temperature role ... 8
3 MATERIALS AND METHOD ... 9
3.1 Study site and time ... 9
3.2 Materials and equipment ... 10
3.3 Data collection ... 10
3.4 Sampling methods ... 11
3.4.1 Seaturtle body measurement ... 11
3.4.2 Habitat characteristic ... 12
3.4.2.1 Nesting habitat ... 12
3.4.2.1.1 Nesting beach profile ... 12
3.4.2.1.2 Beach and hatchery shade are condition ... 12
3.4.2.1.3 Substrate of beach and nests ... 13
3.4.2.1.4 Nest depth ... 15
3.4.2.1.5 Nest humidity ... 15
3.4.2.1.6 Nest temperature ... 15
3.4.2.2 Near shore habitat ... 16
3.4.2.2.1 Sea bottom substrate ... 17
3.4.2.2.2 Sea surface temperature ... 19
3.5 Statistical analysis ... 20
4 RESULT AND DISCUSSION ... 21
4.1 Nesting habitat ... 21
4.1.1 Nesting beach characteristic ... 21
4.1.1.1 Nesting fidelity ... 23
4.1.1.2 Green turtle abundance ... 25
4.1.2 Nest (Natural and artificial) ... 26
4.1.2.1 Evening temperature of natural and artificial nests... 26
4.1.2.2 Daily sand temperature at hatchery and beach area ... 32
4.1.2.3 Green turtle morphometric (adult female and hatchling) ... 36
4.2 Near shore habitat ... 38
4.2.1 Sea bottom substrate ... 39
4.2.2 Sea surface temperature regime ... 41
5 CONCLUSION AND FUTURE WORKS ... 47
5.1 Conclusion ... 47
5.2 Future works ... 48
REFERENCES ... 49
LIST OF TABLE
Page
1 Green turtle diet ... 7
2 List of field materials and equipments ... 10
3 List of data collection ... 10
4 Sand grain size using Wentwoth scale (USDA soil textural classification system) ... 14
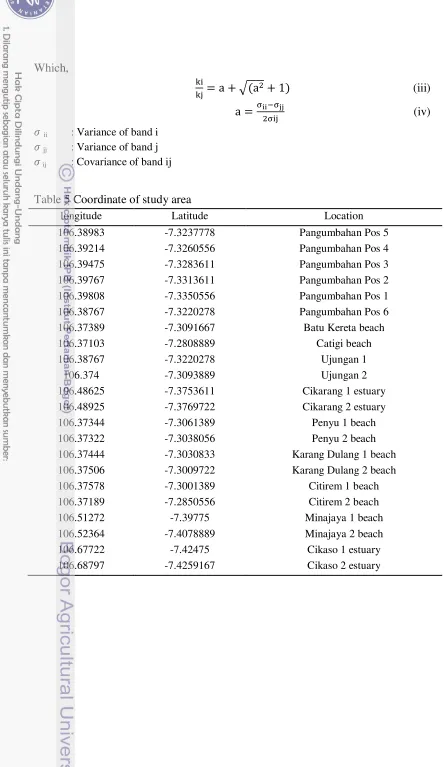
5 Coordinate of study area ... 18
6 Landsat 7 ETM+ band characteristic... 19
7 Landsat 7 ETM+ image data characteristic. ... 19
8 Characteristic of each beach segment in Pangumbahan. ... 22
9 Green turtle abundance at Pangumbahan beach segments... 24
10 Evening temperature of green turtle (C. mydas) natural nests. ... 27
11 Sand characteristic at natural nest, artificial nest and hatchery area . ... 30
12 Sand characteristic at hatchery ... 36
13 Green turtle hatchling straight carapace size and body weight ... 38
LIST OF FIGURES
Page
1 Green turtle (Chelonia mydas) ... 3
2 Green turtle (C. mydas) identification key (PERSGA/GEF, 2004) ... 5
3 Morphometric measurement of seaturtle carapace ... 5
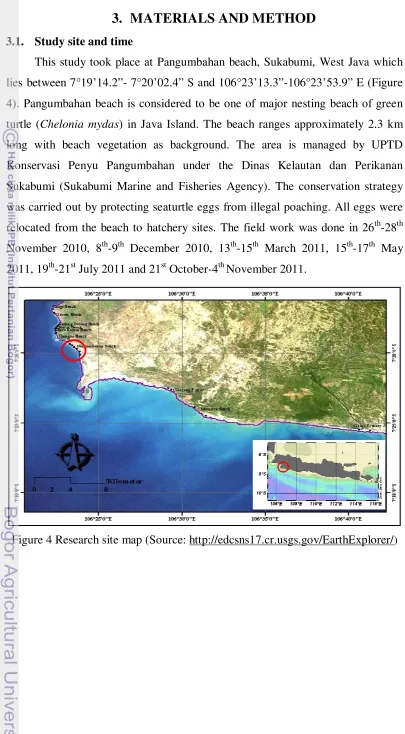
4 Research site map ... 9
5 Line intercept sampling method (van Laar and Akça, 2007) ... 13
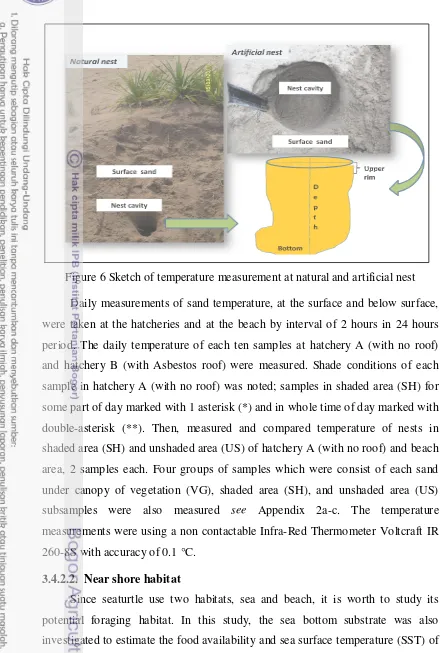
6 Sketch of temperature measurement at natural and artificial nest ... 16
7 Sand grain size compositions at each Pangumbahan beach segment ... 21
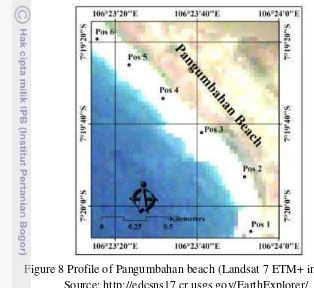
8 Profile of Pangumbahan beach ... 22
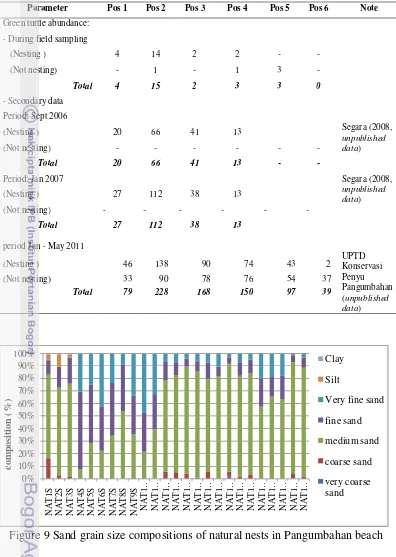
9 Sand grain size compositions of natural nests in Pangumbahan beach ... 24
10 Abundance of green turtle (C. mydas) landing at Pangumbahan beach ... 25
11 Temperature distribution of green turtle (C. mydas) natural nests in Pangumbahan beach segments (Pos 1-Pos 4) ... 28
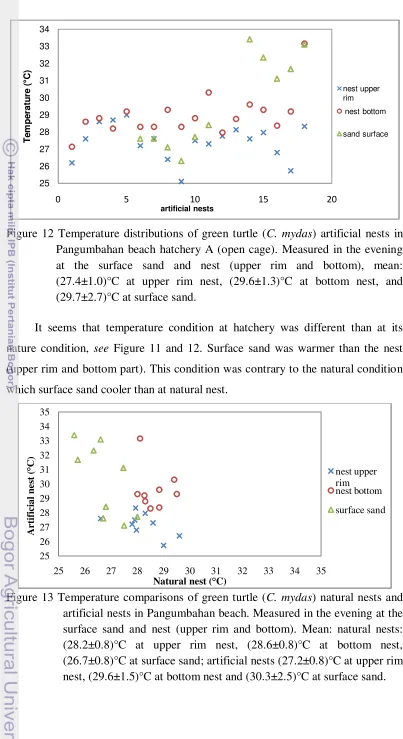
12 Temperature distribution of green turtle (C. mydas) artificial nests in Pangumbahan beach hatchery A (open cage) ... 29
13 Temperature comparisons of green turtle (C. mydas) natural nests and artificial nests in Pangumbahan beach ... 29
14 Nest depth of green turtle (Chelonia mydas) natural and artificial sand in cm ... 32
15 Ambient sand temperature at hatchery and beach area of Pangumbahan sampled on November 1st – 3rd 2011 ... 32
16 Ambient temperature of surface sand at hatchery and beach area in Pangumbahan (November 1st-4th 2011) ... 34
17 Ambient temperature of subsurface sand (± 10 cm depth) at hatchery and beach area in Pangumbahan (November 1st-4th 2011)... 35
18 Female adult green turtle carapace sizes in cm (curved carapace length and width) obtained during field work (primary data) and secondary data (UPTD 2010 and UPTD 2011) ... 37
19 Live and dead specimens of green turtle hatchlings body weight in gram ... 38
20 Sea bottom substrate classification map at Pangumbahan coast and adjacent (Landsat image) ... 40
21 Bathymetry of Pangumbahan waters (Segara, 2007) ... 41
22a Sea surface temperature regime around Pangumbahan beach during high nesting abundance (October 2011 – day) ... 43
22b Sea surface temperature regime around Pangumbahan beach during high nesting abundance (October 2011 – night) ... 44
22c Sea surface temperature regime around Pangumbahan beach during low nesting abundance (April 2011 – day) ... 45
22d Sea surface temperature regime around Pangumbahan beach during high nesting abundance (April 2011 – night) ... 46
LIST OF APPENDIX
Page 1a Equipments and materials used during field work ... 53
1b Equipments and materials used for sand grain size composition analysis at laboratory ... 55 1c Equipments and materials used for sand humidity analysis at laboratory ... 56 2a Daily sand temperature measurement at hatchery A (open cage)... 57 2b Daily sand temperature measurement at hatchery B (Asbestos roof) ... 57
2c Daily sand temperature measurement at beach area ... 58
3 Description of Pangumbahan beach segments ... 59
4a Abundance of green turtle landing at Pangumbahan beach in the period of 2003-2005 and 2008-2011 ... 60
4b Abundance of green turtle landing at Pangumbahan beach during field work ... 61
5 Vegetation species list, type and shade area at Pangumbahan beach ... 62
6 Picture of beach vegetation at Pangumbahan beach ... 64
7a Ambient sand temperature at hatchery and beach area of Pangumbahan sampled on November 1st – 4th 2011 ... 67
7b Ambient temperature of surface and subsurface sand at hatchery and beach area in Pangumbahan (November 1st-4th 2011) categorized by its shading condition ... 68
8a Seaweed and seagrass at Pangumbahan beach ... 69
8b Seaweed at Cikararang estuary ... 71
1.
INTRODUCTION
1.1. Background
Seaturtles are living fossil animals which have existed from Early
Cretaceous period (Hiryama, 1998). There are only seven species remaining,
which are distributed globally and all listed as endangered species. They are
widely distributed world wide, from tropical to subtropical areas. Five seaturtle
species inhabit Indonesian archipelago and the Green turtle (Chelonia mydas) is
the most commonly found here (Dermawan and Adnyana, 2003). One of the
major Green turtle (C. mydas) nesting sites in Java island is Pangumbahan beach
(Nuitja, 1992; Dermawan and Adnyana, 2003; Hutabarat and Mustika, 2003).
However, Limpus (1997) noted that the population has drastically declined over
the last 35 years. These animals are facing a serious threat of extinction.
Temperature holds an important role for each stage of sea turtle lives, both
at neritic and pelagic. Seaturtle is defined as poikilotherm, long migration and
natal homing animals. Seaturtles as poikilotherm animals means that body activity
is dependent upon environment temperature (Rebel, 1947). Temperature plays
important role in regulating incubation period and determining hatchling sex
(Miller, 1997; Broderick et al., 2000). Female is produced at higher temperature
while male is at lower temperature (Limpus, 1985; Marquez-M, 1990 and Miller,
1997). Our knowledge of pelagic habitat temperature of green turtle (C. mydas) is
still limited, no data yet for hatchlings.
Pangumbahan Beach is one of remaining green turtle (Chelonia mydas)
nesting beach in Java Island. It located in Sukabumi, West Java. The area has been
protected and managed by UPTD Konservasi Penyu Pangumbahan in a way to
conserve green turtle population and to raise public awareness with running
edutourism since 2008 (Janawi, 2010, personal communication). It previously
managed by a CV Daya Bhakti company with a concession to harvest the turtle
eggs since 1979 until 2007 (Segara, 2008 and Kuswandi and Janawi, 2010,
personal communication). Currently, its conservation strategy including
relocation of all green turtle eggs from natural nesting sites into hatchery sites. It
of seaturtle eggs were collected relocated directly during night patrol. Impact of
these efforts on nest characteristic was investigated in this study.
They spend almost all their life at sea and only less at beach (Miller, 1997;
Bjorndal, 1999). Feeding and mating areas are located at sea while nesting area is
located at beach. Different species have distinctive preference of habitat. Green
turtle (C. mydas), the species which was studied, feed at seagrass meadows and
preferably nest at large beach. Generally mating happened near coast (Miller,
1997).
Green turtle (C. mydas) play a role in balancing marine ecosystem. They can
regulate production of seagrass (such as Zostera, Cymodocea, Thallasia, and
Halophila) and seaweed (Rebel, 1974) by grazing upon it. Their preferences of
diet, then, can allow other marine benthos such as coral to grow well due to
decreasing pressure of space competition with faster growing species.
1.2. Hypothesis
Hypothesis of this study was :
1. Beach topography and substrate type influence nesting fidelity
2. The conditions of natural nest and artificial nest were different
3. Is habitat type and sea surface temperature regime in Pangumbahan coast
explaining green turtle migration around nesting beach location
1.3. Objectives
The objectives of this research are:
1. To identify beach topography and substrate type of Pangumbahan Beach
2. To identify characteristic of green turtle natural nest
3. To identify characteristic of green turtle artificial nest
4. To compare the characteristic of green turtle natural nest and artificial nest
5. To describe habitat type and sea surface temperature regime in
2.
LITERATURE REVIEW
2.1. General remarks of seaturtle
Overall, there are seven living species of seaturtles distributed worldwide
(Marquez-M, 1990). They are Green turtle (Chelonia mydas), Hawksbill turtle
(Eretmochelys imbricata), Leatherback turtle (Dermochelys coriacea),
Loggerhead turtle (Caretta caretta), Olive ridley (Lepidochelys olivacea), Kemp’s
ridley turtle (Lepidochelys kempii) and Flatback turtle (Natator depressa). The
latter two species are the only species which are not exist in Indonesia (Nuitja,
1992 and Dermawan and Adnyana, 2003). Green turtle (C. mydas) is the most
common species in Indonesia (Dermawan and Adnyana, 2003). Observed species
in this research will be Green turtle (C. mydas) (Figure 1).
Seaturtles are widely spread from tropical to subtropical areas. They have
been known as long migrating animals which are capable of migrating as far as
hundreds kilometer (Bustard, 1972; Rebel, 1974; Marquez-M, 1990). However,
their existence is threatened as the population is declining drastically over the last
decades. The Convention on International Trade in Endangered Species of Flora
and Fauna (CITES) lists all seaturtles on Appendix 1. The World Conservation
Union (IUCN) lists the green, loggerhead, and ridley as ‘Endangered’, the
leatherback, kemp’s ridley and hawksbill are listed as ‘Critically Endangered’ and
the flatback is listed as data deficient, means there is insufficient data for
determining its satus (PERSGA/GEF, 2004).
2.2. Biological aspects 2.2.1. Species identification
Standard species identification key is based on carapace scutes, head scale
and coloration pattern of the body (Figure 2). Green turtle (C. mydas) has five
central scutes, four pairs of lateral scutes, and 12 pairs marginal scutes on its
carapace. The head scales consist of one pair of prefrontal scales. On the upper
side, the general appearance varies from pale to very dark from combination of
yellow, brown and greenish tones. In juvenile, there is a clear narrow and
yellowish margin at the head and upper side flippers scales (Marquez-M, 1990).
Classification of Green turtle (C. mydas) based on Linnaeus (1758):
Kingdom : Animalia
Sub Kingdom : Metazoa
Phylum : Chordata
Sub Phylum : Vertebrata
Super Class : Tetrapoda
Class : Reptilia
Sub Class : Anapsida
Ordo :Testudinata
Sub Ordo : Cryptodira
Family : Cheloniidae
Genus : Chelonia
Species : Chelonia mydas (Linnaeus, 1758)
Figure 2 Green turtle (C. mydas) identification key (PERSGA/GEF, 2004). pf: prefrontal, CS: Central Scutes; LS: Lateral Scutes and MS: Marginal Scutes.
2.2.2. Body size
The size of turtles is principally related to the carapace length, which
considered a reliable measure of overall size (Marquez-M, 1990). There are two
standard methods to measure size such as Straight Carapace Length-Width
(SCLW) and Curve Carapace Length-Width (CCLW) (Marquez-M, 1990;
PERSGA/GEF, 2004) see Figure 3.
Figure 3 Morphometric measurement of seaturtle carapace. Using Straight Carapace Length and Width (above) and Curved Carapace Length and Width (below)
pf
CS LS
LS
MS
pf
Most of body size measurements for adult turtle come from the nesting
females because they are more accessible than males. Marquez-M (1990)
suggested that mean size of nesting female and hatchling shows wide variation
from place to place. A size of 111.6 cm CCL was recorded from the Comoro
Islands and 81.2 cm SCL recorded from Guyana (Marquez-M, 1990). Green turtle
body weight can be range from 89.8 kg to as heavy as 186 kg. Marquez-M (1990)
also noted that green turtle (C. mydas) hatchling’s size ranges from 44 - 59 mm
and body weight ranges from 18.4 to 35 g.
2.3. Habitat
2.3.1. Nesting habitat
There is more understanding about the ecology of nesting habitat because of
its accessibility. But the fact is, seaturtle spend most of their life at sea (Bjorndal,
1999). Nesting habitat takes place at beach. Different species have their own
preferences. Green turtle prefers small cove to large beaches (Pritchard and
Mortimer, 1999) which usually are dominated by Sea Pandanus vegetation
(Nuitja, 1992). In general, nesting habitat of green turtle (C. mydas) is consist of
three different materials, coral sand is predominant, which sometime mix with
roots of beach vegetation and shells fragments (Nuitja and Uchida, 1983). Sand
grain size composition is related to accessibility for seaturtle to dig eggs cavity.
Green turtle (C. mydas) was responsive to medium grained size sand (Nuitja and
Uchida, 1983).
Incubation period of eggs is related to temperature and humidity
(Marquez-M, 1990). Warm weather usually results to short period of incubation while cool
weather will make the incubation period to be longer. In general, green turtle eggs
incubation period extends from 48 to 70 days. Incubation period of green turtle
eggs at Pangumbahan beach extend from 52 to 71 days (Anwari, 1986). The latter
data obtained from eggs which incubated at natural nest (not relocated). Ewert
(1979) suggested that the suitable sand temperature for embryo development
ranged between 25 °C and 32 °C.
2.3.2. Near shore habitat
Sea turtles spend most of their lives at sea (Diez and Ottenwalder, 1999).
mating are located at sea. Different species has its own preference of foraging
habitat (Bustard, 1972; Rebel, 1974; Marquez-M, 1990) while mating ground
usually takes place near shore (Miller, 1997). Foraging habitat of green turtle is in
seagrass beds. However, pelagic habitat for early stage turtles (juvenile) remains
unclear. High priority must be given to the early pelagic stage that occurs in most
sea turtle species. There is still less knowledge about the ecology of seaturtle’s
pelagic habitat, including green turtle.
2.4. Feeding Habit
Green turtle is an herbivorous species, however, in early ages, they are
carnivorous. (Bustard, 1972; Rebel, 1974 and Marquez-M, 1990). Marquez-M
(1990) stated that the juvenile’s diet consist of small molluscs, sea urchins, sea
squirts and crustacean whereas most of the adult’s diet is seagrass leaves. Stomach
content investigation also showed that green turtle feed on seaweed (Rebel, 1974;
Bjorndal, 1980; Marquez-M, 1990 and Lopez-Mendilaharsu et al., 2006). They
feed during daytime at shallow waters. Specific genera of the feeding type are
listed below (Table 1).
Table 1 Green turtle diet
Genera Source
Seagrass: Zostera,Cymodocea,Thalassia and
Halophila
Rebel (1974)
Seagrass: Thalassiatestudinium Bjorndal (1980)
Seagrass: Zostera, Cymodocea, Thalassia,
Syringodium, Diplantera, Halodule,
and Halophila
Seaweed: Gelidium, Gracillaria, Gracilliaropsis, Hypnea, Caulerpa, Vidalia,
Bryothamnion, Cryptonema, Agardiella
Marquez-M (1990)
Marquez-M (1990)
Seaweed: Codium amplivesiculatum, Gracilaria textorii, Ulva lactuca, Chondria nidifica, Gracilaria pacifica, Caulerpa sertularoides, Aspagaropsis taxiformis, Amphiroa sp., Laurencia pacifica
Lopez-Mendilaharsu et al., (2006)
2.5. Temperature role
Sea turtles are poikilotherm organisms, which body activity is dependent
upon environment temperature (Rebel, 1947). Hence, it holds an important role
for each stage of sea turtle lives. They spend almost their life at sea, but the adult
female will come back to their natal beach to lay eggs (Miller, 1997). Incubation
temperature influence eggs incubation period and hatchlings sex determination
(Miller, 1997; Broderick et al., 2000). Although incubation temperature range
may differ by species and region, in general, higher temperature will result in a
shorter eggs incubation period (Marquez M, 1990). Higher temperature will
produce female individual whereas lower temperature will produce male (Limpus,
1985; Miller, 1997). High temperature plays important role in early gonadal
differentiation (Barlian, 1987). Our knowledge of pelagic habitat temperature of
3.
MATERIALS AND METHOD
3.1. Study site and time
This study took place at Pangumbahan beach, Sukabumi, West Java which
lies between 7°19’14.2”- 7°20’02.4” S and 106°23’13.3”-106°23’53.9” E (Figure
4). Pangumbahan beach is considered to be one of major nesting beach of green
turtle (Chelonia mydas) in Java Island. The beach ranges approximately 2.3 km
long with beach vegetation as background. The area is managed by UPTD
Konservasi Penyu Pangumbahan under the Dinas Kelautan dan Perikanan
Sukabumi (Sukabumi Marine and Fisheries Agency). The conservation strategy
was carried out by protecting seaturtle eggs from illegal poaching. All eggs were
relocated from the beach to hatchery sites. The field work was done in 26th-28th
November 2010, 8th-9th December 2010, 13th-15th March 2011, 15th-17th May
[image:31.595.107.512.75.809.2]2011, 19th-21st July 2011 and 21st October-4th November 2011.
3.2. Materials and equipment
Table 2 List of field materials and equipments
Equipment Utility Material Utility
IR-Non contact thermometer
Conventional thermometer
Temperature measurement (Infra red sensor)
Temperature measurement (alcohol)
Ethanol 70%
Preservation for seaweed, seagrass and dead hatchlings
Roll meter Length and distance Inconel tag Flipper tag
Hand held GPS Positioning
Measuring tape (flexible and stiff)
Seaturtle morphometric measurement
Caliper Hatchling body measurement
Digital Scale Hatchling body mass
measurement
Ziplock bag Sand and seaweed
samples storage
Styrofoam box Seaweed and dead hatchlings
samples storage
Shovel Head light
Sand sampler
Nightly measurement
∗ see Appendix 1a
3.3. Data collection
Table 3 List of data collection
Data Note
Primary Data
Nesting beach characteristic:
- Sand grain size composition Field sampling; samples were analyzed at Soil
Laboratoty in Dept. Tanah, Faperta-IPB
- Beach shade area Field measurement
- Beach vegetation Field sampling, samples were identified at LIPI
Botani Nest (natural & artificial) characteristic:
- Nest position relative to beach segments and vegetation
Field observation and measurement
- Nest and sand temperature Field measurement
- Nest depth Field measurement
- Sand grain size composition Field sampling, samples were analyzed at
Environment Laboratory, Dept. BDP, FPIK-IPB
- Nest humidity Field sampling, samples were analyzed at
Marine Biology Laboratory at Dept. ITK, FPIk-IPB
Seaturtle morphometric (adult and hatchling)
Field measurement
Seaturtle track Field measurement
Table 3 (continue)
Secondary Data
Population data UPTD Konservasi Penyu Pangumbahan
Beach profile Yonathan (2010, unpublished data)
Sea bottom substrate http://edcsns17.cr.usgs.gov/EarthExplorer/
Monthly SST (April 2010 & 2011 and Oct 2010 & 2011)
http://www.oceancolor.gsfc.nasa.gov
3.4. Sampling methods
3.4.1. Seaturtle body measurement and tagging
Adult female nesting seaturtle body measurement and flipper tag attachment
were done after the oviposition was done. Morphometric measurements were done
in two ways, Curve Carapace Length and Width (CCLW) and Straight Carapace
Length and Width (SCLW) (Bolten, 1999) see Figure 3. Measurements over the
carapace curve (CCL) in adults are 3 to 4 cm larger than straight carapace length
(SCL) (Marquez-M, 1990). CCLW was measured by using flexible measuring
tape while Straight Carapace Length and Width SCLW was measured by using
stiff measuring tape and stick.
Straight carapace length and width (SCLW) (Bolten, 1999) of 21 nesting
green turtles and curved carapace length and width (CCLW) (Bolten, 1999) of 25
green turtles were measured during the field work. Additional data of curved
carapace length and width (CCLW) and population data of nesting green turtle in
2010 (n = 104) and 2011 (n = 36) were obtained from the UPTD Konservasi
Penyu Pangumbahan. Hatchlings carapace length and width (n = 58) were
measured by using SCLW as suggested by Bolten (1999). Hatchlings body weight
(n = 55) was measured by using digital scale (accuracy ± 0.01 gram).
In addition, we also investigated hatchlings straight carapace length - width
and body weight. Straight carapace size was measured using a caliper with
accuracy of ± 0.1 cm. The main interest for this measurement was to know
whether it was safe to sample hatchlings body fluids for sex determination. Sex of
seaturtle hatchlings can not be defined by looking at external anatomy. There are
several methods to do so, both direct and indirect method. Conventional method
was to look at the gonad by dissecting. Testosterone (reproduction hormone) level
them. Initially, it has to be confirmed that the sampled blood volume did not
exceed 1% of the body weight (Phillippa, 2011, personal communication).
3.4.2. Habitat characteristic 3.4.2.1. Nesting habitat
Main focus of this section was to observe the characteristic of green turtle
(C. mydas) nesting beach of Pangumbahan, Sukabumi and nests (both natural and
artificial) characteristics. Characteristics which were studied in this research were
beach profile, beach and hatcheries shade area, beach and nest sand grain
composition, nest temperature, nest humidity, and nest depth.
3.4.2.1.1. Nesting beach profile
Beach profile information was obtained from a research partner, Yonathan
(2010, unpublished data) who mapped the beach topography by using theodolith.
General information of beach profile such as slope and width also obtained with
direct observation during sampling qualitatively.
3.4.2.1.2. Beach and hatchery shade area condition
There are reports noted that many green turtle nest located under canopy of
beach vegetation, especially Sea pandanus (Nuitja, 1992). The vegetation also
plays role in regulating humidity of the substrate surrounding. Some female turtles
prefer to lay eggs under the canopy of vegetation.
Line intersect sampling method (van Laar and Akça, 2007), see Figure 5,
was carried out to measure the shade area of vegetation and sample domination
type and taxa of outer beach vegetation (Diez and Ottenwalder, 1999). A few
meters extension toward the vegetation aggregation was applied also as we
learned from our preliminary survey that green turtle of Pangumbahan also found
Figure 5 Line intercept sampling method (van Laar and Akça, 2007). Lines stretched along the outer vegetation as long as 50 meters (black stripes) with intervals of 50 meters along the outer vegetation (dash line). Extensions were made a few meters inside the vegetation where the nest frequently found. Note: Hatchery A: open cage hatchery; hatchery B: Asbestos roofed hatchery; UC: under canopy area; NC: No canopy area and HWM: near High Water Mark area
Shade areas of hatcheries were not quantitatively measured in detail like in
nesting beach. It was only qualitative observation. There were four hatcheries
facilities with different canopy. Two hatcheries were not built with roofs which
were patchily shaded by vegetation canopy. The rest were built with roof, one was
built with asbestos roof and the other was with fiber roof. The roof provides shade
evenly at all time of day.
3.4.2.1.3. Substrate of beach and nests
Surface sand was sampled at each beach segment, natural nest and artificial
nest in order to get information for its grain size composition. Sand grain size
composition of Pangumbahan nesting beach was sampled at each beach
segment/Pos. Especially for Pos 2, samples were taken twice, Pos 2 left hand side
of the hatchery (2A) and at right hand side of the hatchery (2B). Sand sample
were taken at under canopy area (UC), without canopy area (NC) and 1 sample at
near high water mark (HWM).
The samples were taken by using a shovel at 0-10 cm sand depth. It was
stored and labeled into separate ziplock bags. First batch of sample analysis were
done in Soil department, Faculty of Agriculture-Bogor Agricultural University.
The rest batch was done in Environment laboratory of Aquaculture Department,
Faculty of Fisheries and Marine Science-Bogor Agricultural University.
Pipette method (Sudjadi et al., 1971) was applied to analyze 7 fractions of
sand grain size composition (Table 4). First step was to dry the sand samples in
oven 50°C for 1 day. After that, took a few portion of the sample and sieved with
5 fraction sieve then removed to glass plate and weighed each sorted fraction of
the sand. The finest sorted sand (< 0.1 mm) moved to a beaker glass and added by
25 ml H2O2 10% then kept in room temperature for 1 night. The next day, the
samples were added by 25 ml H2O2 30% and heated for some minute until the
bubbles were reduced then cooled it down. Prepared and weighed porcelain plates.
Sieved the samples by using 0.05 mm filter sheet and filtered by water. The sorted
sand removed to a porcelain plate and dried in 190 °C oven to get the very find
sand. Silt and clay was contained in filtered solution. The filtered solution was
removed into measuring glass, add water up until 400 ml. Shook the measuring
glass by turned it upside down for 10 times and waited for 20 seconds then
removed 20 ml with pipette into porcelain plate, dried it in 190 °C oven to get the
silt. Rested the solution for 3.5 hours to be removed as much as 20 ml and dried as
well to get clay content. The dried porcelain plates were weighed on Ohauss
analytical digital scale with accuracy of 0.00001 gram. Equipments and materials
were presented in Appendix 1b.
Table 4 Sand grain size using Wentwoth scale (USDA soil textural classification system)
Fraction Diameter limits (mm) Name of soil separate
I 2.00 - 1.00 Very coarse sand
II 1.00 - 0.50 Coarse sand
III 0.50 - 0.25 Medium sand
IV 0.25 - 0.10 Fine sand
V 0.10 - 0.05 Very fine sand
VI 0.05 - 0.002 Silt
VII Less than 0.002 Clay
(Source: http://soils.usda.gov/technical /handbook/contents/part618.html)
3.4.2.1.4. Nest depth
Natural and artificial nests depth was measured by using stiff measuring tape. This
measurement was taken to compare the natural nest depth which was made by the
female turtle in nature and artificial depth made by hatchery’s warden (human).
Natural nests depth was measured during eggs collection by the warden. It was
after few eggs laid and before the adult female turtle buried the eggs cavity. The
artificial nests depth was measured before the eggs put into the artificial nest
(artificial eggs cavity).
3.4.2.1.5. Nest humidity
Nest humidity was measured by using gravimetry method. Principle of this
method was to measure the water content in sediment. The sand nests (natural and
artificial nests) were sampled and weighed. This initial weight was considered as
wet weight. Then the samples were dried in 100 °C and weighed until the weight was stable. This weight was considered as dry weight. Humidity was obtained by subtracting wet weight to dry weight and multiplying with 100% as formula (i) below, see also Appendix 1c for equipment and materials used.
% 100% (i)
3.4.2.1.6. Nest temperature
Temperature of both natural and artificial nests were measured at the upper
rim and bottom as well as the surface sand surround, illustrated in Figure 6.
Temperature measurements of natural nests were taken oviposition (egg laying).
All eggs were relocated to hatchery area. Temperature of the artificial nests were
measured before the eggs reburied into it. Some temperature measurements of
artificial nests were not taken from the previously measured natural nests.
Figure 6 Sketch of temperature measurement at natural and artificial nest
Daily measurements of sand temperature, at the surface and below surface,
were taken at the hatcheries and at the beach by interval of 2 hours in 24 hours
period. The daily temperature of each ten samples at hatchery A (with no roof)
and hatchery B (with Asbestos roof) were measured. Shade conditions of each
sample in hatchery A (with no roof) was noted; samples in shaded area (SH) for
some part of day marked with 1 asterisk (*) and in whole time of day marked with
double-asterisk (**). Then, measured and compared temperature of nests in
shaded area (SH) and unshaded area (US) of hatchery A (with no roof) and beach
area, 2 samples each. Four groups of samples which were consist of each sand
under canopy of vegetation (VG), shaded area (SH), and unshaded area (US)
subsamples were also measured see Appendix 2a-c. The temperature
measurements were using a non contactable Infra-Red Thermometer Voltcraft IR
260-8S with accuracy of 0.1 °C.
3.4.2.2. Near shore habitat
Since seaturtle use two habitats, sea and beach, it is worth to study its
potential foraging habitat. In this study, the sea bottom substrate was also
investigated to estimate the food availability and sea surface temperature (SST) of
bottom classification map by using Landsat 7 ETM+ satellite image. The sea
surface temperature (SST) was visualized by using ODV (Ocean Data View).
3.4.2.2.1. Sea bottom substrate
First step in creating sea bottom classification map was to download
Landsat satellite image. Landsat 7 ETM+ was downloaded from
http://edcsns17.cr.usgs.gov/EarthExplorer/. August 28th 2011 acquisitioned
Landsat 7 ETM+ image data (extension of *ers.) and Lyzenga equation (see ii)
were used for image digital data processing. Then, filled the empty data in some
image with August 27th 1999 data acquisitioned. Afterward, ER Mapper 6.4
software was used to overlay each band.
The overlaid image was cropped based on study area range (see Table 5).
There are some corrections which should be applied in general mapping creation,
i.e geometric and radiometric correction. Geometric correction was not applied in
this particular map because the downloaded image has already been corrected.
Radiometric correction was applied by using histogram adjustment technique.
This correction was done in order to reduce noises due to atmospheric influence.
Band composite was applied for classification process by RGB 421
combination. This RGB combination was used to recognize living coral area
which would be represented in cyan color. Then, training area of sea bottom
substrate was created and classified with supervised Maximum Likelihood
Standard Classification (MLSC). The supervised result was overlaid with land
which has been composited with RGB 321. Last step was to create bottom
substrate classification map by using ArcGIS 9.3 software to visualize the sea
bottom substrate. Band characteristic is presented in Table 6.
Lyzenga equation (1981), in Arief et al. (2010):
ln ln ! (ii)
Y : depth invariant index ln bi : normalized image in band i ln bj : normalized image in band j ki/kj : ratio of attenuation coefficient
Which,
"#
"$ a & ' a(& 1 (iii) a )**+),,
()#$ (iv) -ii : Variance of band i
- jj : Variance of band j
[image:40.595.51.497.40.807.2]- ij : Covariance of band ij
Table 5 Coordinate of study area
longitude Latitude Location
106.38983 -7.3237778 Pangumbahan Pos 5
106.39214 -7.3260556 Pangumbahan Pos 4
106.39475 -7.3283611 Pangumbahan Pos 3
106.39767 -7.3313611 Pangumbahan Pos 2
106.39808 -7.3350556 Pangumbahan Pos 1
106.38767 -7.3220278 Pangumbahan Pos 6
106.37389 -7.3091667 Batu Kereta beach
106.37103 -7.2808889 Catigi beach
106.38767 -7.3220278 Ujungan 1
106.374 -7.3093889 Ujungan 2
106.48625 -7.3753611 Cikarang 1 estuary
106.48925 -7.3769722 Cikarang 2 estuary
106.37344 -7.3061389 Penyu 1 beach
106.37322 -7.3038056 Penyu 2 beach
106.37444 -7.3030833 Karang Dulang 1 beach
106.37506 -7.3009722 Karang Dulang 2 beach
106.37578 -7.3001389 Citirem 1 beach
106.37189 -7.2850556 Citirem 2 beach
106.51272 -7.39775 Minajaya 1 beach
106.52364 -7.4078889 Minajaya 2 beach
106.67722 -7.42475 Cikaso 1 estuary
106.68797 -7.4259167 Cikaso 2 estuary
Table 6 Landsat 7 ETM+ band characteristic.
Band Number Spectral Range (microns) Ground Resolution (m)
1 0.45 to 0.515 30
2 0.525 to 0.605 30
3 0.63 to 0.690 30
4 0.75 to 0.90 30
5 1.55 to 1.75 30
6 10.40 to 12.5 60
7 2.09 to 2.35 30
Pan (8) 0.52 to 0.90 15
Source: http://geo.arc.nasa.gov/sge/landsat/l7.html
Table 7 Landsat 7 ETM+ image data characteristic
Swath width: 185 kilometers
Repeat coverage interval: 16 days (233 orbits)
Altitude: 705 kilometers
Quantization: Best 8 of 9 bits
On-board data storage: ~375 Gb (solid state)
Inclination: Sun-synchronous, 98.2 degrees
Equatorial crossing: Descending node; 10:00am +/- 15
min.
Launch vehicle: Delta II
Launch date: April 1999
Source: http://geo.arc.nasa.gov/sge/landsat/l7.html
3.4.2.2.2. Sea surface temperature
Distribution of monthly day and night sea surface temperature (SST) in
2010–2011 at Pangumbahan beach and adjacent coasts were obtained from Aqua
Modis satellite images level-3 with 4x4 km resolution. These image data were
available in National Aeronautic Space Agency (NASA) website
(http://www.oceancolor.gsfc.nasa.gov). The raw image data then cropped and
extracted into *.ascii data format with Seadas 5.2.0. program. The *.ascii data
were copied into Microsoft Excel 2007 spreadsheets to be furthermore to be saved
into *.txt data format and visualized them in Ocean Data View (ODV) 4 program.
Population and nest temperature data were compiled and processed in Microsoft
Excel 2007 and Statistica 6.0 program. Statistical significance tests were done by
using XLstat program.
3.5. Statistical Analysis
Population and nest temperature data were compiled and processed in
Microsoft Excel 2007 and Statistica 6.0 program. Statistical tests were done using
XLStat program. Normality test were done in four method i.e. Shapiro-Wilk,
Jarque-Bera, Anderson-Darling and Lilliefors tests at the significance level of α =
0.05 for natural and artificial nests temperature. Two-tailed tests were used to
compare natural and artificial nests temperature datasets at the significance level
of α = 0.05 and α = 0.01. Two tailed tests were conducted to define the means
4.
RESULT AND DISCUSSION
4.1. Nesting habitat4.1.1. Nesting beach characteristic
Pangumbahan beach is considered to be a high energy beach which directly
connected to Indian Ocean. The beach ranged about 2.3 km length and divided
into six beach segments, Pos1 – 6 (see Figure 5 & 8). Each beach edge (Pos 1 and
6) were bordered by small estuary which discharging freshwater into the sea at
wet season and is dry at dry season. The beach was not completely secured from
the local activities. There was open access into Pos 1, 5 and 6. Sea pandan
(Pandanus tectorius) was predominant beach vegetation and creeper plant such as
Cyperus pedunculatus and Ipomoea pescapre patched in some part of the beach.
Beach width and slope varied within the whole area. Beach sand is dominated by
medium and very fine sand (Figure 7).
Figure 7 Sand grain size compositions at each Pangumbahan beach segment. Sampled at near high water mark (HWM), no vegetation canopy (NC) and under vegetation canopy (UC).
Yonathan (2010, unpublished data) pointed that the 300 m area at Pos 1 and
some part of Pos 2 had width range of 40 – 60 m and slope of 2.8 – 6.5° in west
monsoon. The rest of beach profile information was mainly visual observation. In
general, beach width in Pangumbahan was narrow at the edge and sligthly wider
at the center of the beach. Pos 2 and Pos 3 were the widest part (Figure 8). Less
steep beach slope was at Pos 1 and 2 whereas the steepest was at Pos 6. Creeper
0% 10% 20% 30% 40% 50% 60% 70% 80% 90% 100% c o m p o si ti o n (% ) Clay Silt
Very fine sand
fine sand
medium sand
coarse sand
plants were absent at Pos 1 and 2, small patches at Pos 3 and 4 and large extension
at Pos 5 and Pos 6, see Appendix 3 for detail descriptions. Sea bottom substrate
around Pos 1 beach line was different with other beach segments. There were
extensions of rocky substrate in front of this area which may reduce the
[image:44.595.95.409.198.486.2]accessibility. Detail characteristic of each beach segment listed in Table 8 below.
Figure 8 Profile of Pangumbahan beach (Landsat 7 ETM+ imagery). Source: http://edcsns17.cr.usgs.gov/EarthExplorer/
Table 8 Characteristic of each beach segment in Pangumbahan
Parameter Pos 1 Pos 2 Pos 3 Pos 4 Pos 5 Pos 6
Dominant sand grain size :
UC medium
sand very fine sand, fine sand very fine sand, fine sand very fine sand, fine sand very fine sand, medium sand very fine sand, fine sand
NC medium
sand medium sand medium sand very fine sand medium sand medium sand Vegetation: Most common species Pandanus tectorius Pandanus tectorius, Calophyllum inophyllum Pandanus tectorius Pandanus tectorius Pandanus tectorius Pandanus tectorius Shade area (m)
220.72 448.62 150.5 141.95 127.69 374.77
∗UC: Under vegetation canopy, NC: No vegetation canopy
[image:44.595.84.481.523.744.2]4.1.1.1. Nesting fidelity
Abundance of green turtle landing at each beach segment was not evenly
distributed. Pos 2 was the most abundance while Pos 6 was the least (Table 9).
There were 15 out of 27 adult female green turtles observed landed at Pos 2, 14 of
them successfully laid eggs. Pos 2 was the widest among others and less steep
while Pos 6 was narrow and had steepest slope. The sand substrate at both beach
segments was dominated by very fine sand and fine sand grain. However, it was
found that the green turtle sand nest at Pos 2 was dominated by medium sand
grain size (n = 13) see Figure 9. Nuitja and Uchida (1983) concluded that green
turtle prefer to nest at beach with medium sized grains of sand. The most common
species of beach vegetation at all beach segments, including Pos 2 and Pos 6, was
similar, i.e. Sea Pandan Pandanus tectorius. Nuitja (1992) reported that green
turtle in Pangumbahan prefered to nest under P. tectorius. Difference between Pos
2 and Pos 6 was the extension of creeper plant Cyperus pedunculatus at Pos 6.
The creeper plants might hamper green turtle in digging body pit and nest cavity.
In other words, Pos 2 was freer from burdens. The burdens also came from
external factors such as local activity and light disturbance at exposed beach part
(Pos 1, 5 and 6). Poaching was susceptible at this particular beach segment, with
the most common case was occurred at Pos 5 and 6 (outermost part of
conservation area).
Table 9 Green turtle abundance at Pangumbahan beach segments
Parameter Pos 1 Pos 2 Pos 3 Pos 4 Pos 5 Pos 6 Note
Green turtle abundance:
- During field sampling
(Nesting ) 4 14 2 2 - -
(Not nesting) - 1 - 1 3 -
Total 4 15 2 3 3 0
- Secondary data
Period: Sept 2006
Segara (2008,
unpublished data)
(Nesting ) 20 66 41 13
(Not nesting) - - - -
Total 20 66 41 13 - -
Period: Jan 2007 Segara (2008,
unpublished data)
(Nesting ) 27 112 38 13
(Not nesting) - - - -
Total 27 112 38 13
period Jan - May 2011
UPTD Konservasi Penyu Pangumbahan (unpublished data)
(Nesting ) 46 138 90 74 43 2
(Not nesting) 33 90 78 76 54 37
Total 79 228 168 150 97 39
[image:46.595.87.483.99.656.2]
Figure 9 Sand grain size compositions of natural nests in Pangumbahan beach
4.1.1.2. Green turtle abundance
Female green turtles (C. mydas) visit Pangumbahan beach, Sukabumi
almost through the year. The peak nesting season in the period of 2003-2005 and
2008-2011 was usually in October, with a variation occurred in 2009 and 2011
0% 10% 20% 30% 40% 50% 60% 70% 80% 90% 100% N A T 1S N A T 2S N A T 3S N A T 4S N A T 5S N A T 6S N A T 7S N A T 8S N A T 9S N A T 1 … N A T 1 … N A T 1 … N A T 1 … N A T 1 … N A T 1 … N A T 1 … N A T 1 … N A T 1 … N A T 1 … N A T 1 … N A T 1 … N A T 1 … N A T 1 … N A T 1 … N A T 1 … c o m p o si ti o n (% ) Clay Silt
Very fine sand
where the peak nesting season occurred, respectively, in February and November
(Salamsyah, 2007, unpublished report and UPTD Konservasi Penyu
Pangumbahan, unpublished data) see Figure 10 and Appendix 4a. The datasets
came from two different sources where datasets of January 2003 until December
2005 came from CV. Daya Bhakti which cited from Salamsyah (2007, unpublish
report) and datasets of August 2008 until July 2011 came from UPTD Konservasi
Penyu Pangumbahan. There was a conflicting reason in producing a reliable data
recording for CV Daya Bhakti as it had obligation to save 20% of turtle eggs they
harvested and reported to the local government (Natih, 2012, personal
communication). Since they were running a business on seaturtle eggs harvest,
they might not report the real amount of data to increase their profit. So, it is
reasonable for us to doubt the reliability of the data recorded by this company. If
we compare both datasets (2003 - 2005 and 2008 - 2011) see Figure 10, the low
abundant of green turtle (C. mydas) nesting abundance at the period of 2003-2005
might not be the real situation. The abundance might be higher than what it was
reported.
Figure 10 Abundance of green turtle (C. mydas) landing at Pangumbahan beach A gap of two year period of green turtle abundance was due to lack of data
source. It does not mean that there were no turtle visits within the period of year.
Low numbers of green turtle (C. mydas) recorded at period of 2003, 2004, 2005
and 2010. Very high abundace of green turtle (C. mydas) recorded in 2008.
Record data of landing green turtle (C. mydas) abundance in period of 2003-2005,
2008-2011 and during field work was presented respectively in Appendix 4a and
4b.
4.1.2. Nest (Natural and artificial)
4.1.2.1. Evening temperature of natural and artificial nests
Sand temperature is influenced by other factors such as air temperature,
vegetation roots, humidity, sand grain size composition and position relative to
shade. Air temperature is directly influencing temperature of surface sand until
few centimeters. Vegetation root system keeps the sand humidity within.
Humidity is lowering the temperature. The area under the shade is protected from
sunlight so the temperature is cooler than the ones without shade. Sand grain
provides porosity which in turn influenced the sand humidity. On the other hand,
temperature can also influence sand humidity. Temperature varied depended on
depth.
Nest temperature of green turtle (C. mydas) natural nest and artificial nests
were measured in the evening. Natural nest temperature was measured during
oviposition (egg laying). All eggs from natural nests were relocated into artificial
nests (prepared holes) in the hatchery. Temperatures of artificial nests were
measured before the relocated eggs were buried. Nests (egg cavity) were
measured at the upper rim and bottom part by using a non contactable infra-red
thermometer. Surface sand around the nests were also measured.
There were 21 green turtle (C. mydas) natur