IPONMLKJIHGFEDCBAI . I"~
~& jft.g~7 j ( . * ' 1 ! fWVUTSRQPONMLKJIHGFEDCBA
~& jft.g~7 j ( . * ~
!f
zyxwvutsrqponmlkjihgfedcbaZYXWVUTSRQPONMLKJIHGFEDCBA:11:, ~
7j(.
j-
i!i,P o J i & ~ . g ~ 7 j ( . * ' 1 ! ftf ~
7j(.
j-
i!i,P o Ji & ~ . g ~ 7 j ( . * ' 1 ! f
m ~
7j(.
j-
iJ i-P o J~ 5~
§
*-7j(.Jlt1B-~ Ftl~ ~
tf *.:L*1.,4l{
F ,,'Jltf;J- ~ Ftl~ ~
*~
.:L~,4l{
F,,'Jlt1B-~ Ftl~ ~
EDCBAP A W E E S 2 0 1 1 I n t e r n a t i o n a l C o n f e r e n c e
£ fbfJF-1:ft.(organizer)
[@ ~
7j(.
re
-&.7j(.J.l
li/f!
i"
(International Society of Paddy and Water Environment Engineering -PAWEES)
;f±
III* A ~ ~ 1.1f-.:L~
*
i"
(Taiwan Agricultural Engineers Society)
[@:J L ~ ~ * - ! I F .1 A h
J.tli:,~
,~ft.:L~*~
(Department of Bioenvironmental
Engineering, National Taiwan University, Taiwan)
tIh
fbf
&.
1t
WJ
1 f - 1 : f t .(eo-organizer
and sponsor)
-ft
~i
JIltt.
1f-~ ~ -tr
rr
jlj:JIltt.
1f-~ ~ -tr
7j(.
'±'1*;f~P o JM!Il* At.
#-
.:L*1.ZJf
~ tf .\.;
{:;
~ti ~~
:11:.
"$" ~t.
re
7j(.:f~-t-1.
re
7j(.:f~1t
Jfn1;---t-M!Il*
A~1t~£~t-§
5i.:L*1.,jJ{
F ,,' ~Ftl~ ~
~ 5~
i!t-
~.:L *1.,ll{
M
Jlt f;J-~ Ftl~ ~
li
~.:L~,fJ{
F ,,'Jlt f;J-~ Ftl~ ~
.re*~i".+~a£.*.~~i"
MIIl*A~OO.re*ZJf~*A£~~
M!Il*Atf£t.1f-#ft~~~~£.~
I,_ , ••zyxwvutsrqponmlkjihgfedcbaZYXWVUTSRQPONMLKJIHGFEDCBA
Table of contents
Opening Remarks
Dr. Fi-John Chang i
Councilof Agriculture, Executive Yuan, Taiwan, RO C iii
Director-G eneral W ei-Fuu Yang vi
Dr. Tai-Cheol Kim viii
O r. Yohei Sato x
Dr. Sun-Joo Kim xii
Session I: Keynote Speech
A Decision Support System for Sustainable Water
1
Sustainable Paddy Production and Water Management in the Context of
21s, Century Climate Change
20Challenges in remediation of agricultural soil contaminated by radioactive substances
22ImproveSoil Moisture Estimation in Arid/Semi-arid
Region using In-Situ and us g Stu a d Remote Sensing
Information
32
Session 11- General session
Geographyof Damage: Tsunami Inundation Area of the Great East Japan Earthquake
.47
On-farmIrrigation Development
and Management in Lower Myanmar for Sustainable Rice Production
..48
Effectsof suspended solids and water temperature on phosphorus in the drainage canal in a paddy-field
district
49
Applicability study of watershed model for Korea TMDL
50
ClimateChange Impact on Irrigation System and Farmers' response (The Plychomphol
Irrigation Project,
PhitsanulokProvince, Thailand: case study)
51
Thedecision making of fallow strategies for irrigation water management in northern Taiwan
52
Session
IHGFEDCBAI I I -Paddy Environmental
Sustainability
and Irrigation
Techniques
EvaluationIrrigation Water Requirements
and Crop Yields with Different Irrigation Schedules for Paddy
Fieldsin ChiaNan Irrigated Area, Taiwan
53
Adaptingthe Water Management Practice to the Double Exposure: The System of Rice Intensification in
Taiwan
54
Feasibility of SRI Application for Reduction of Irrigation and NPS Pollution in Korea 56
Evapotranspiration
over W~t· ~nd Dry System of Rice Intensification
(SRI) Paddy Field Environment:
Srlation
Using Surface Energy Balance Model
58
Jstimation
of Water Balance Variables in the SRI Paddy Field by Considering Soil Moisture
59
EDCBAS e s s i o n I V - S u s t a i n a b l e W a t e r M a n a g e m e n t
Types of Damage to Drainage Facilities of Paddy Irrigation Schemes along Sendai Bay in Miyagi Prefecture
by the Tsunami Caused by the East Japan Earthquake
60
The Geographical Characteristics
of Heavy-metal
Contamination
on Paddy-fields
in Taiwan
61
Application of watershed scale model using NPS monitoring data
62
Application of a Distributed Kinematic Wave Storm Runoff Model (KIMSTORM)
for Flood Simulation
Considering Dam Release in the South Han River Basin of Korea
6]
Applying Genetic Algorithm to optimizing Artificial Neural Networks for estimating arsenic pollution in
groundwater systems
6
Estimating of the spatial rainfall data using inverse distance weighing (IDW) in the Middle Taiwan
6~
e s s i o n V - I m p a c t s o f C l i m a t e C h a n g e a n d N a t u r a l H a z a r d s o n P a d d y a n d W a t e r
E n v i r o n m e n t
Factor Analysis of Urban Non-point Source Pollutant Discharge by Landuse
hgfedcbaZYXWVUTSRQPONMLKJIHGFEDCBA 6fUncertainty of paddy irrigation requirement estimated from climate projections in the Geurnho river basin,
outh Korea
6'
Simulation of greenhouse gas emissions from a Korean rice paddy field by flooding water depth using the
Dl~DC model
6(Impact assessment method of climate change on agricultural water use by using a distributed water
circulation model
6(The importance of infrastructure
development
in farmland from the viewpoint of a crop science
student-through my volunteer experience on Tohoku earthquake disaster
7
Modeling the rice-climate
indices in Taiwan
7
The Impact of Climate Change on Paddy Field Irrigation in Southern Taiwan
7
S e s s i o n
VI---
R i v e r E n v i r o n m e n t a l D e s i g n a n d R e s t o r a t i o nPopulation Model of Rana japonica Crossing Agricultural
Concrete Canals: Evaluating Population
Conservation by Improving the Migration Routes of Frogs
7
l
Fish migration from paddy fields to canals during mid-summer
drainage
7
Extension of Space-Time Conservation Method to Analysis of One-Dimensional
Unsteady Flow in
Comparative DNA and morphological
analyses with respect to the distribution ranges of an introduced and .,.
native Rhynchocypris species in the Tama River Basin, Japan
76
Nonpoint source pollution control programs for reservoir water quality improvement in Korea
77
hgfedcbaZYXWVUTSRQPONMLKJIHGFEDCBAAn
Investigation of the Effectiveness of Ecological Construction and Fish Assemblages in Southern Branch
ofChia-Nan Irrigation Channel
78
Study on Agricultural Benefits by Increasing Capacity of Water Ponds-A Case Study at Taoyuan Paddy
Fields
79
EDCBAP o s t e r S e s s i o n
Estimating Effective rainfall trends for Irrigation using dynamic factor analysis
80
Modeling Irrigation Return Flow for the Return Flow Reuse System in Paddy Fields
81
Assessment of Cooling Effect Range of Paddy Fields by LANDSA T Thermal Imagery
82
The Impact Assessment of Climate Change on Ecological Base Flow in Da-an River
83
Assessing the Accuracy of Flow Management using Propeller-type
Flowmeter, Acoustic Doppler Profile
(ADP) and Radar Surface Velocimeter in Rivers
84
Geography of Damage: Tsunami Inundation Area ofthe Great East Japan Earthquake
85
Population Model of Rana japonica Crossing Agricultural Concrete Canals: Evaluating Population
Conservation by Improving the Migration Routes of Frogs
86
Comparative DNA and morphological
analyses with respect to the distribution ranges of an introduced and
,native Rhynchocypris species in the Tama River Basin, Japan
87
Long-term C02, CH4 and N20 flux measurement in rice paddy fields with relaxed eddy accumulation method
in Japan and Thailand
88
The yield and growth of paddy rice plants as functions of soil dryness during growing stages
89
Decomposition characteristics of organic nitrogen in digested slurry from methane fermentation after
application to paddy soil
90
Evaluation of soil temperature rise effect and soil moisture environment during a period of solar heat
disinfection in greenhouse
91
Agricultural Land Use and Prospect in Brantas River Basin in Indonesia
92
DSS for Agricultural Drought Management Using Risk Assessment
94
Study on the necessity of management for agricultural nonpoint source pollution in Korea
95
Estimation of croJ2water requirement for paddy rice with climate change in Korea
96
Surface Temperature and Energy Balance of Paddy Field during Wet and Dry Period in Tropical Watershed
Soil
97
Tillage and crop residue effects on carbon sequestration and crop yields in the lowland environment of
Evaluation Irrigation Water Requirements
and Crop Yields with Different Irrigation
Schedules 'tor-Paddy
Fields in ChiaNan Irrigated Area, Taiwan
100
Adapting the Water Management Practice to the Double Exposure: The System of Rice Intensification in
Taiwan
101
EDCBAS u b m i t t e d A b s t r a c t s
Mode1ing of Nitrate leaching from a potato field using Hydrus-2D
103
Investigation of Water Level to Maintain Advantage of Isoetes taiwanensis in Menghuan-Pond
Wetland at
Yangmingshan National Park
104
Nitrogen and phosphorus losses from paddy field under water-saving irrigation in Taihu Lake Region of
China
10)
Wind-Induced Flow in a Closed Water Body with Floating Culture System
lOC
Using Tracer to Evaluated Efficiency of Domestic Water Purification in Oyster Shell Contacted Beds
10'
Study on Development
of Farmlands outside region of irrigation association in Taiwan
101
Physicochemical
and biological properties of constructed small- scale ponds for ecological improvement in
P AEDCBAW E E S 2 0 1 1 I n t e r n a t i o n a l C o n f e r e n c ezyxwvutsrqponmlkjihgfedcbaZYXWVUTSRQPONMLKJIHGFEDCBA Capacity Building for Participatory Irrigation and Environmental Management
27 October 2011, National Taiwan UniversityIHGFEDCBA
2 0 1 1 0 5 4
E s tim a tio n o f W a te r B a la n c e V a ria b le s in th e S R I P a d d y F ie ld b y C o n S id e rin g
S o il M o is tu re
Chusnul Arif,2, Budi I Setiawarr', Masaru Mizoguchi', Ryoichi Doi1PONMLKJIHGFEDCBA
1D e p a r t m e n tWVUTSRQPONMLKJIHGFEDCBAo f G l o b a l A g r i c u l t u r a l S c i e n c e , t h e U n i v e r s i t y o f T o k y o , J a p a n
Phone: (+81)-3-5841-1606
Email: [email protected]
2D e p a r t m e n t o f C i v i l a n d E n v i r o n m e n t a l E n g i n e e r i n g , B o g o r A g r i c u l t u r a l U n i v e r s i t y ( I P B ) , B o g o r , I n d o n e s i a
Phone: (62)-251-8627225
A b s tra c t
Water Balance analysis in the System of Rice Intensification (SRI) paddy field is essential to evaluate water
management regarding its water productivity and water use efficiency. In the observed field, however, particular
water balance variables are not easily measured since the methods are often costly, complicated and time
consuming. The current study proposed the novel method to estimate non-measurable water balance variables by
considering monitored soil moisture in the field by using Excel solver estimation. The field experiment was
conducted by adopting SRI rice cultivation in the SRI experimental field in Nagrak Organics SRI Center,
Sukabumi, West Java, Indonesia during the first rice season 2010/2011 (October 2010 to Februari 2011, wet
season). Results of the developed model showed satisfactory result between observed and estimated soil moisture
with the values ofR2 higher than 0.70 in the all growth stages. Accordingly, each estimated water balance
variable has reasonable trend and value. We found that total inflows through precipitation and irrigation water
were 1331.8 and 107 mm, respectively. Meanwhile, the water has leaved the field through crop
evapotranspiration, runoff and percolation with their total values were 296.5, 1010.7 and 116 mm, respectively.
Minimum irrigation water was needed to meet plant water requirement since no standing water and high
precipitation occurred in the current wet season. Also, the total crop evapotranspiration and percolation were low
according to the FAO values as the results oflow reference evapotranspiration and reduction of hydrostatic
pressure, respectively. On the other hand, high runoff was estimated because almost precipitation was drained
directly and only retained the water in the field to meet crop evapotranspiration.
K e y w o r d s : s y s t e m o f r i c e i n t e n s i f i c a t i o n ( S R I ) , w a t e r m a n a g e m e n t , w a t e r b a l a n c e , s o i l
PA WEES 2011 International
Conference
Capacity Building for Participatory Irrigation and Environmental Management 27 October 2011, National Taiwan UniversityIHGFEDCBA
In tro d u c ti
n
Recently, the System of Rice Intensification (SRI) is well-known as a set crop management
practices for raising the productivity of irrigated rice by changing the management of plants,
soil, water and nutrients. Although some critics were dismissed to the SRI (Sinc\air and
Cassman 2004; Sheehy et al. 2004; Dobermann 2004), however, its benefits have been
validated in 42 countries of Asia, Africa and Latin America (Uphoffet al. 2011).
In the SRI paddy field, water is irrigated according to intermittent irrigation with an alternate
wetting and drying irrigation system instead of continuous flooding for conventional rice
cultivation. By this method, SRI can save up to 28% of water in Japan (Chapagain and Yamaji
2010),40% in Eastern Indonesia (Sato et al. 2011) and 38.5% in Iraq (Hameed et al. 2011),
and can increase water use efficiency by up to 43.9% in China (Lin et al. 2011). Here, the
field is kept saturated and then letting the field dry for particular period. Accordingly, water
balance analysis is usually performed to evaluate water productivity and water use efficiency
in field scale.
However, particular water balance variables such as crop evapotranspiration and percolation
are not easily measured in the field. The typical field measurement methods are often costly,
complicated and time consuming especially for equipment preparation. Crop
evapotranspiration, the main route of water loss from both plant and soil surfaces, is
commonly measured empirically by using a lysimeter (Vu et al. 2005; Tyagi et al. 2000;
Mohan and Arumugam 1994). Meanwhile, percolation, as downward movement of excess
water through the soil, is measured by using range infiltrometer and Iysimeter technique and
then calculated based on Darcy's law (Janssen et al. 2010).
Soil moisture represents water availability in the field and it commonly affect pattern of water
balance variables such as evapotranspiration, percolation and runoff inhgfedcbaZYXWVUTSRQPONMLKJIHGFEDCBApaddy field (Kim et al.
2009; Reshmidevi et al. 2008; Li and Cui 1996). In addition, it is easier measured than those
variables based on the dielectric constant of the soil by well-developed sensor. Accordingly,
real time soil moisture monitoring has been developed for monitoring SRI paddy field in
Japan with intermittent irrigation (Manzano et al. 2011). Therefore, the method to estimate
non-measurable water balance variables based on the monitored soil moisture is vital for
water productivity and water use efficiency evaluation without complicated water balance
P A W E E S 2 0 1 1 I n t e r n a t i o n a l C o n f e r e n c ezyxwvutsrqponmlkjihgfedcbaZYXWVUTSRQPONMLKJIHGFEDCBA Capacity Building for Participatory Irrigation and Environmental Management
27 October 2011, National Taiwan University
The present stud proposes novel method to estimate non-measurable water balance variables
in SRI paddy field by considering the monitored soil moisture on daily basis. Then, the model
is validated by comparing observed and estimated soil moisture during planting period.IHGFEDCBA
M e th o d s
F ie ld E x p e rim e n t
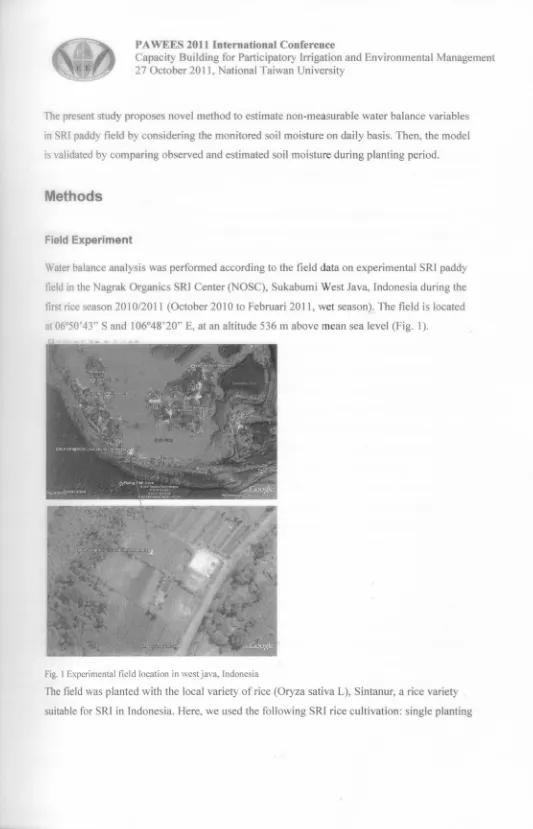
Water balance analysis was performed according to the field data on experimental SRI paddy
field in the Nagrak Organics SRI Center (NOSC), Sukabumi West Java, Indonesia during the
first rice seasonPONMLKJIHGFEDCBA2 0 1 0 / 2 0 1 1 (October 2010 to Februari 2011, wet season). The field is located at 06°50' 43" Sand 106°48'20" E, at an altitude 536 m above mean sea level (Fig. 1).
Fig. 1 Experimental field location in west java, Indonesia
The field was planted with the local variety of rice (Oryza sativa L), Sintanur, a rice variety
[image:9.571.15.548.11.840.2]P A W E E S 2 0 1 1 I n t e r n a t i o n a l C o n f e r e n c ezyxwvutsrqponmlkjihgfedcbaZYXWVUTSRQPONMLKJIHGFEDCBA Capacity Building for Participatory Irrigation and Environmental Management
27 October 2011, National Taiwan University
of young seedlings (5 days after sowing) spaced at 30 cmhgfedcbaZYXWVUTSRQPONMLKJIHGFEDCBAx 30 cm, using an organic fertilizer
at I kg/m2 on the land preparation and no chemical fertilizer. Moreover, weeding process was
conducted regularly every 10 days, starting from 10 day after transplanting (DA T) to 40 days
after together with supplying local indigenous microorganism (IMO) to enhance biological
activity in the soils.
The field was kept continuous saturated and no standing water was applied during planting
period as recommendation from local SRI center. Continuous soil saturation is recommended
as the less water consumptive irrigation regime and its application is feasible only when the
irrigation water supply is reliable (Janssen et al. 2010). Accordingly, irrigation threshold was
performed to maintain water level at -5 cm to 0 cm soil depth.IHGFEDCBA
F ie ld M e a s u re m e n ts
The field was monitored by the new developed information system, Field Network System
(http://info.ga.a.u-tokyo.ac.jp/fns/Main Page), which is comprise of meteorological and soil
sensors. The meteorological data including precipitation were recorded by using Davis
Vantage Pro2 Weather Station every 30 minutes. Daily average values of air temperature,
wind speed and relative humidity as well as total solar radiation were used to calculate
reference evapotranspiration (ETo) based on the FAO Penman-Mointeith (AlIen et al. 1998).
In the soil layer, soil moisture sensor (5TE: soil moisture, temperature, electrical
conductivity), developed by Decagon Devices, Inc., USA, was installed at the 10-cm depths
from the top of soil to measure soil parameters every 30 minutes. All of data were sent daily
to the web server on the particular time, thus we called this information system as a quasi real
time monitoring system.
M o d e lin g A p p ro a c h
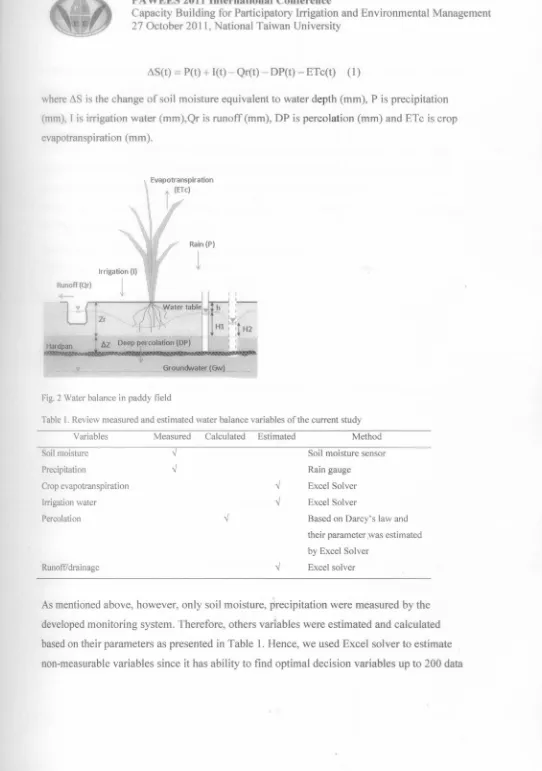
Water balance analysis was performed according to the schema in Fig. 2. The inflow to the
field consists of precipitation and irrigation water, while water leave the field through crop
evapotranspiration, runoff and percolation. Here, we define runoff as lateral water movement
either artificially through drainage process or naturally when water depth exceeds the height
ofthe drainage outlet and as seepage through bunds in paddy field. Accordingly, water
P A W E E S 2 0 1 1 I n t e r n a t i o n a l C o n f e r e n c ezyxwvutsrqponmlkjihgfedcbaZYXWVUTSRQPONMLKJIHGFEDCBA Capacity Building for Participatory Irrigation and Environmental Management
27 October 2011, National Taiwan University
t;S(t)
=
P(t)hgfedcbaZYXWVUTSRQPONMLKJIHGFEDCBA+I(t) - Qr(t) - DP(t) - ETc(t) (1)where t;S is the change of soil moisture equivalent to water depth (mm), P is precipitation
(mm), I is irrigation water (mm),Qr is runoff (mm), DP is percolation (mm) and ETc is crop
evapotranspiration (mm). Evapotranspiration
t
(Elc) Rain(P)1
Irrigation (I)Runoff (Q r)
~WVUTSRQPONMLKJIHGFEDCBA
t u . Deep percolation (DP)
I
1'_-I , I , ''I'' Hl ~!H2l _ _
,
,
Hardpan [image:11.571.20.562.56.827.2]G roundwater (G w)
Fig. 2 Water balance in paddy field
Table 1. Review measured and estimated water balance variables of the current study
Variables Measured Calculated Estimated Method
Soil moisture Precipitation
Crop evapotranspiration Irrigation water Percolation
Soil moisture sensor
Runoff! drainage
Rain gauge Excel Solver Excel Solver
Based on Darcy's law and
their parameter was estimated
by Excel Solver Excel solver
As mentioned above, however, only soil moisture, precipitation were measured by the
developed monitoring system. Therefore, others variables were estimated and calculated
based on their parameters as presented in Table 1. Hence, we used Excel solver to estimate
P A W E E S 2 0 1 1 I n t e r n a t i o n a l C o n f e r e n c ezyxwvutsrqponmlkjihgfedcbaZYXWVUTSRQPONMLKJIHGFEDCBA
Capacity Building for Participatory Irrigation and Environmental Management
27 October 2011, National Taiwan University
within one process by minimizing or maximizing objective function. The guidelines for using
Excel Solver could be referred to Morrison (2005).PONMLKJIHGFEDCBA
E x c e l s o l v e r e s t i m a t i o n
Excel solver was performed to estimate non-measurable variables according to Eq. 1. Since
the number of decision variables was limited, the estimation process was carried out four
times according to each growth stage i.e. initial (I), crop development (11),
mid-season/reproductive (Ill) and late season stage (IV) (Vu et at. 2005; Tyagi et at. 2000; Alien et
[image:12.566.16.532.38.820.2]at. 1998; Mohan and Arumugam 1994).
Table 2. Minimum and maximum crop coefficient in each growth stage
Growth stage Total day Crop coefficient
Minimum Maximum
Initial 27 0.80 1.05
Crop development 45 0.90 1.20
Mid-season 24 LlO 1.40
Late season 20 0.90 1.20
The decision variables consist ofETc, I, Qr and H2 by minimizing the following equation
objective function:hgfedcbaZYXWVUTSRQPONMLKJIHGFEDCBA
n
Error
=
~]So (t) - Srn(t)1 (2)1=1
subject to the constraints:
ETcrnin ~ ETc(t) ~ ETcrnax (3)
H2(t) ~ Hl(t); Qr(t) ~ 0; let) ~ 0 (4)
where So(t) is observed soil moisture equivalent to water depth (mm), Sm(t) is estimated soil
moisture equivalent to water depth (mm), t is time (day, starting from 1 to 116 DAT), n is
total days (n= 116), ETcmin is minimum crop evapotranspiration, ETcmax is maximum crop
evapotranspiration, HI and H2 are water table at different point as parameters to determine
deep percolation (mm). ETcmin and ETcmax were given by multiplying ETo to minimum and
P AWEES 2011 International
Conference
Capacity Building for Participatory Irrigation and Environmental Management 27 October 2011, National Taiwan University
the FAO recommendation value (AlIen et al. 1998) and by considering current rice cultivation
and soil moisture at the field as well particularly in the initial and crop development stages.PONMLKJIHGFEDCBA
I n it ia l C o n d it io n s
The initial condition for each decision variable should be determined properly to gain reliable
estimated variables. Hence, we consider the actual field situation for each decision variable as
explained below:
I.
Crop evapotranspiration (ET c)Initial condition was given according to actual crop evapotranspiration under water stress
condition (AlIen et al. 1998) and can be calculated using following relationship.
ETc(t)
=
Ks(t)xKc(t)xETo(t) (5)where Kc is a crop coefficient that varies with the crop growth stage, Ks is water stress
coefficient as the effect of soil moisture in the root zone and calculated using the relationship
between actual and saturated water content (Kim et al. 2009; Li and Cui 1996):
Ks=1 ifSa(t)
=
Ss (6)KshgfedcbaZYXWVUTSRQPONMLKJIHGFEDCBA=
InCI
+1 0 0 ( S a ( t ) / S s ) In101if11SS ~ Sa(t) < Ss (7)
K
(
sa(t) - 11SS)
s
=s exp
11SS
if Sa(t) < 11SS (8)
where Sa and Ss are the actual and saturated water contentWVUTSRQPONMLKJIHGFEDCBA( m3/ m \ respectively and 11and e are empirical coefficient for rice set equal to 0.80 and 0.95, respectively (Li and Cui 1996).
2. Percolation (DP)
Percolation (DP) was calculated according to Darcy's law for vertical flow (Jury and Horton
2004). According to Fig. 2, DP was calculated based on two different water tables by
following equation:
DP(t)
=
Ks Hl(t) - H2(t) (9)PA WEES 2011 International Conference
Capacity Building for Participatory Irrigation and Environmental Management 27 October 2011, National Taiwan University
where Ks is saturated hydraulic conductivity (mm/day) with a constant value,!1Z is
secondary soil layer (mm), HI is water table according to effective depth (mm) and H2 is
lower water table at different points in the field (mm) which was estimated by Excel solver.
Percolation loss is primary function of soil texture, and its rate is relatively low for clay soil
range to 1-5 mm/d (Guerra et al. 1998) as the current location. Thus, percolation was given at
the rate of 1 mm/d on determined H2 as initial condition.
3. Runoff (Qr)
In paddy field, runoff is primary function of precipitation which has positive correlation
(Chen et al. 2003). Accordingly, as initial condition, runoff was occurred when precipitation
occurred and its value was given by the following formula:
Qr(t)
=
hgfedcbaZYXWVUTSRQPONMLKJIHGFEDCBA0 ifP(t) < ETomax (10)Qr(t)=pet) - ETom ax ifP(t)
2:
ETomax (11)where ETomax is maximum reference evapotranspiration (mm).
4. Irrigation water (I)
Irrigation water was given when the precipitation doesn't meet to the plant water requirement
through crop evapotranspiration, and also no runoff on the current day. Accordingly, initial
condition was given as the following formula:
I(t)=0 ifQr(t) > 0 (12)
I(t)=ETcini (t) - pet) ifQr(t)
=
0 (13)where ETcini is initial crop evapotranspiration (mm).PONMLKJIHGFEDCBA
M o d e l V a lid a t io n
The model was validated by the indicator of the coefficient of determination (R2) to compare
between observed and estimated soil moisture. The value ofR2 ranged from 0.0 to 1.0 with
P A W E E S 2 0 1 1 I n t e r n a t i o n a l C o n f e r e n c ezyxwvutsrqponmlkjihgfedcbaZYXWVUTSRQPONMLKJIHGFEDCBA
Capacity Building for Participatory Irrigation and Environmental Management
27 October 2011, National Taiwan UniversityIHGFEDCBA
R e s u lts a n d D is c u s s io n s
E v a lu a tio n o f th e m o d e l fe a s ib ility
The model feasibility was evaluated by comparing observed and estimated soil moisture
during planting period. Estimated soil moisture was resulted based on estimated
non-measurable water balance variables (Table 1). Estimated soil moisture showed good
agreement with observed data pointed by high
R2
at the values of 0.71, 0.78, 0.77 and 0.83 forinitial, crop development, mid-season and late season stages, respectively (Table 3).
R2
valuegreater than 0.6 is acceptable or satisfactory for model prediction (Kim et al. 2009).
Therefore, the current method was feasible to estimate non-measurable water balance
variables.
Table 3. Model validation for estimated soil moisture in the experimental field
Growthstage Total number estimated data R2
Initial 108 (each variables was 27 data) 0.71
Crop development 180 (each variables was 45 data) 0.78
Mid-season 96 (each variables was 24 data) 0.77
Late season 80 (each variables was 20 data) 0.83
The highest
R2
was achieved when total estimated data were lowest number on the lateseason. However, when the total number estimated data more than 100, higher estimated data
has higher
R2
value, andWVUTSRQPONMLKJIHGFEDCBAv i c e v e r s a . Accordingly, the number estimated data were notcorresponding to
R2
value, despite higher number data need more time for the estimationprocess. The major factor to gain high
R2
with reliable estimated data is the initial conditions.This should consider the actual field condition such as weather, soil texture and crop as
considering in this study.
E s tim a tio n o f w a te r b a la n c e v a ria b le s
Excel solver has estimated non-measurable water balance variables properly with reliable
values and trend during planting period as shown in Fig. 3. Estimated soil moisture trend deal
with those observed data in the entire planting period. However, over and underestimation
PA WEES 2011 International Conference
Capacity Building for Participatory Irrigation and Environmental Management
27 October 2011, National Taiwan University
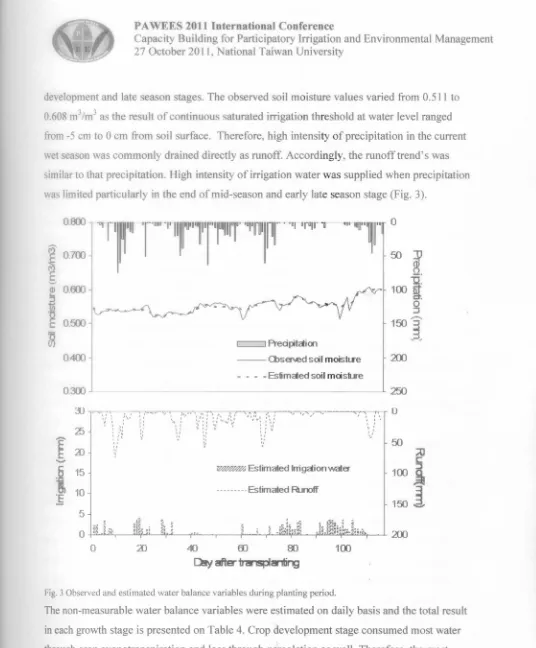
development and late season stages. The observed soil moisture values varied fromPONMLKJIHGFEDCBA0 . 5 1 1 to
0.608WVUTSRQPONMLKJIHGFEDCBAm3/ m3 as the result of continuous saturated irrigation threshold at water level ranged
from -5 cm to 0 cm from soil surface. Therefore, high intensity of precipitation in the current
wet season was commonly drained directly as runoff. Accordingly, the runoff trend's was
similar to that precipitation. High intensity of irrigation water was supplied when precipitation
was limited particularly in the end of mid-season and early late season stage (Fig. 3).
0.500
250
c::::::::J
hgfedcbaZYXWVUTSRQPONMLKJIHGFEDCBAPred pitai 0110.400
0.300
:D
25
I
X l-.6
15"&
10 ~-- Cl>ser.ed soil rnoisure 20J
- - - - Estim aed soil m oisture
w . < W . < W ~Estim ated Irrigaion water
20J ... -EstsnatedRJnoff
5
Fig. 3 Observed and estimated water balance variables during planting period.
The non-measurable water balance variables were estimated on daily basis and the total result
in each growth stage is presented on Table 4. Crop development stage consumed most water
through crop evapotranspiration and loss through percolation as well. Therefore, the most
water inflow was should supplied through precipitation and irrigation water. The highest
[image:16.571.18.554.30.678.2]PA WEES 2011 International
Conference
Capacity Building for Participatory Irrigation and Environmental Management
27 October 2011, National Taiwan University
stage since SRI rice cultivation used younger seedling, therefore plant has more opportunity to
remain its growth potential for roots and shoots development (Uphoff et al. 2011).
Table 4. Total water balance variables in each growth stage
Growth stage Water balance variables Percentage
Inflow (mm) Outflow (mm) error (%)
P ETc Qr DP
Initial 374.2 26.4 68.3 311.8 27.1
Crop development 670.6 19.0 114.7 516.5 45.1
Mid-season 106.6 38.9 65.3 59.9 23.9
Late season 180.4 23.4 48.2 122.5 19.9
Total 1331.8 107.7 296.5 1010.7 116.0
Total inflow-outflow 1439.5 1423.1 1.14%
The total inflows through precipitation and irrigation water were 1331.8 and 107 mm,
respectively. Meanwhile, the water has leaved the field through crop evapotranspiration,
runoff and percolation with their total values were 296.5, 1010.7 and 116 mm, respectively.
There was a low difference between total inflow and outflow at the value of 16.4 mm or
1.14% as the total percentage error estimation. This error was low and can be tolerated, thus
each water balance variable was reliable and can be accepted.
Minimum total water irrigation was supplied to the field since high precipitation during
planting period and no standing water needed in the SRI water management. In addition, total
water consumption through crop evapotranspiration was very low according to the FAO value
(Doorenbos and Kassam 1979), because the effect of low total reference crop
evapotranspiration. We have calculated that total reference evapotranspiration value of279
mm based on weather data. Therefore, total evaporated water through soil evaporation and
crop transpiration was low in the wet season. Moreover, total percolation was low according
to the FAO noted (FAO 2004) due to the soil texture and application of continuous saturated
soil irrigation which can reduce water loss through that percolation by the reduction of
hydrostatic pressure (Van der Hoek et al. 2001; Bouman and Tuong 2001).IHGFEDCBA
C o n c lu s io n s
The novel and simple method was applied to estimate non-measurable water balance variables
P AEDCBAW E E S 2 0 1 1 I n t e r n a t i o n a l C o n f e r e n c ezyxwvutsrqponmlkjihgfedcbaZYXWVUTSRQPONMLKJIHGFEDCBA
Capacity Building for Participatory Irrigation and Environmental Management 27 October 2011, National Taiwan University
estim ted those ariables by using Excel solver estimation. Results of the developed model
showed satisfactory result between observed and estimated soil moisture with the values ofR2
higher than 0.70 in the all growth stages. Accordingly, each estimated water balance variable
has reasonable trend and value. We found that minimum irrigation water was needed to meet
plant water requirement since no standing water and high precipitation occurred in the wet
season. Also, the total crop evapotranspiration and percolation were low according to the FAO
values as the results of low reference evapotranspiration and reduction of hydrostatic pressure,
respectively.
This method can provide a valuable approach for evaluating the water productivity and water
use efficiency not only for SRI rice cultivation but also others rice cultivation system with less
effort and lower cost without complicated water balance variables measurements. However,
those field measurements are still needed to the future research to make the method more
acceptable and satisfactory.IHGFEDCBA
A c k n o w le d g m e n t
This research was supported by a grant of International Research Collaboration and Scientific Publication from
Directorate Higher Education, Ministry of National Education, Republic Indonesia in the year of201O/2012.
R e fe re n c e s
Alien RG, Pareira LS, Raes D, Smith M (1998) Crop Evapotranspiration Guidelines for computing crop water
requirements. FAO - Food and Agriculture Organization of the United Nations, Rome
Bouman BAM, Tuong TP (2001) Field water management to save water and increase its productivity in irrigated
lowland rice. Agr Water Manage 49 (1):11-30. doi:1O.1016/S0378-3774(00)00128-1
ChapagainT, Yamaji E (2010) The effects of irrigation method, age of seedling and spacing on crop
performance, productivity and water-wise rice production in Japan. Paddy Water Environ 8 (1):81-90.
doi: 10.1007/s 10333-009-0187-5
ChenRS, Pi LC, Huang YH (2003) Analysis of rainfall-runoff relation in paddy fields by diffusive tank model.
Hydrol Process 17 (13):2541-2553. doi:1O.1002lhyp.1266
DobermannA (2004) A critical assessment of the system of rice intensification (SRI). Agr Syst 79 (3):261-281.
doi: 10.10 16/S0308-521 x(03)00087-8
DoorenbosJ, Kassam AH (1979) Yield response to water. FAO Irrigation and Drainage Paper 33. FAO, Rome
FAO(2004) Rice Fact Sheet - Rice and Water. FAO. http://v.'Ww.fao.org/rice2004/enlf-sheetlfactsheetl.pdf.
P AEDCBAW E E S 2 0 1 1 I n t e r n a t i o n a l C o n f e r e n c ezyxwvutsrqponmlkjihgfedcbaZYXWVUTSRQPONMLKJIHGFEDCBA
Capacity Building for Participatory Irrigation and Environmental Management
27 October 2011, National Taiwan University
GuerraLC, Bhuiyan SI, Tuong TP, Barker R (1998) Production more rice with less water from irrigated systems.
SWIM Paper 5. International Water Management Institute, Colombo, Srilanka
Hameed KA, Mosa AKJ, Jaber FA (2011) Irrigation water reduction using System of Rice Intensification
compared with conventional cultivation methods in Iraq. Paddy Water Environ 9 (1):121-127.
doi: 10.1007I s lWVUTSRQPONMLKJIHGFEDCBA0333-0 10-0243-1
Janssen M, Lennartz B, Wohling T (2010) Percolation losses in paddy fields with a dynamic soil structure:
model development and applications. Hydrol Process 24 (7):813-824. doi: 1O.1002lhyp.7525
Jury W, Horton R (2004) Soil Physic. 6th edn. John Wiley & Sons, Inc., New Jersey
Kim HK, Jang Tl, Im SJ, W PS (2009) Estimation of irrigation return flow from paddy fields considering the soil
moisture. Agr Water Manage 96:875-882. doi: 10.10PONMLKJIHGFEDCBA1 6 / j . a g w a t . 2 0 0 8 . I 1.009
Li YH, Cui YL (1996) Real-time forecasting of irrigation water requirements of paddy fields. Agr Water Manage
31 (3):185-193
Lin XQ, Zhu OF, Lin XJ (2011) Effects of water management and organic fertilization with SRI crop practices
on hybrid rice performance and rhizosphere dynamics. Paddy Water Environ 9 (1):33-39.
doi:10.1007I sI0333-0 10-0238-y
Manzano VJP, Mizoguchi M, Mitsuishi S, Ito T (2011) IT field monitoring in a Japanese system of rice
intensification (J-SRI). Paddy Water Environ 9 (2):249-255. doi:10.10 0 7 / s 1 0 3 3 3 - 0 1 0 - 0 2 2 6 - 2
Mohan S, Arumugam N (1994) Irrigation crop coefficient for lowland rice. Irrigation and Drainage Systems
8:159-176. doi: I0 . 1 0 0 7 / B F 0 0 8 8 1 0 1 6
Morrison FA (2005) Using the Solver add-in in Microsoft Excel®. Michigan Technological University Web.
http://www.chem.mtu.edu/-fmorriso/cm4650/Using Solver in Excel.doc.
ReshmideviTV, Jana R, Eldho TI (2008) Geospatial estimation of soil moisture in rain-fed paddy fields using
SCS-CN-based model. Agr Water Manage 95 (4):447-457. d o i : 1 O . 1 0 1 6 / j . a g w a t . 2 0 0 7 . 1 1 . 0 0 2
Sato S, Yamaji E, Kuroda T (2011) Strategies and engineering adaptions to disseminate SRI methods in
large-scale irrigation systems in Eastern Indonesia. Paddy Water Environ 9 (1):79-88. doi: 10.1007I sI 0333-0
10-0242-2
SheehyJE, Peng S, Dobermann A, Mitchell PL, Ferrer A, Yang JC, Zou VB, Zhong XH, Huang JL (2004)
Fantastic yields in the system of rice intensification: fact or fallacy? Field Crop Res 88 (1):1-8.
doi:l 0.10 1 6 / j . f c r . 2 0 0 3 . 1 2 . 0 0 6
Sinc1airTR, Cassman KG (2004) Agronomic UFOs. Field Crop Res 88 (1):9-10. d o i : 1 0 . 1 0 1 6 / j . f c r . 2 0 0 4 . 0 1 . 0 0 1
TyagiNK, Sharma OK, Luthra SK (2000) Determination of evapotranspiration and crop coefficients of rice and
sunflower with Iysimeter. Agr Water Manage 45 (1):41-54. d o i : 1 0 . 1 0 1 6 / S 0 3 7 8 - 3 7 7 4 ( 9 9 ) 0 0 0 7 1 - 2
UphoffN, Kassam A, Harwood R (2011) SRI as a methodology for raising crop and water productivity:
productive adaptations in rice agronomy and irrigation water management. Paddy Water Environ 9:3-11.
doi:10.1007I s10333-0 I 0-0224-4
Vander Hoek W, Sakthivadivel R, Renshaw M, Silver JB, Birley MH, Konradsen F (2001) Alternate wet/dry
irrigation in rice cultivation: a pratical way to save water and control malaria and Japanese encephalitis?
P A W E E S 2 0 1 1 I n t e r n a t i o n a l C o n f e r e n c ezyxwvutsrqponmlkjihgfedcbaZYXWVUTSRQPONMLKJIHGFEDCBA
Capacity Building for Participatory Irrigation and Environmental Management
27 October 2011, National Taiwan University
Vu SH, Watanabe H, Takagi K (2005) Application of FAO-56 for evaluating evapotranspiration in simulation of
pollutant runoff from paddy rice field in Japan. Agr Water Manage 76 (3):195-210.