Polymeric Insulation surface condition Analysis
Using Linear Time Frequency Distributions
N.Norddin, A. R. Abdullah, N. Q. Zainal Abidin, A. Aman and A.N. Ramani
Faculty of Electrical Engineering,Universiti Teknikal Malaysia Melaka (UTeM)
Abstract- Polymeric insulator exposed to pollution leads to tracking and erosion affects their performance. There are no specific method to determine their service life. Most studies shows surface condition and their pollution severity of an insulator can be monitor by using leakage current frequency components. This paper presents linear time frequency distributions (TFDs) for leakage current of polymeric insulation for high voltage applications. Tracking and erosion test (Inclined Plane Test (IPT)) complying with BS EN60587-2007 is conducted on polymeric insulation to collect different leakage current patterns. Fast Fourier transforms (FFT) unable to provide temporal information and has limitation to analyze non stationary signal. To overcome this, time frequency distributions (TFDs) shown in time frequency representation (TFR) with temporal and spectral is used. The verification using both methods on several disturbances with known parameters have been made and mean absolute percentage error (MAPE) used to identify the accuracy of both methods. The parameters measured are root mean square (RMS), total harmonic distortion (THD), total non harmonic distortion (TnHD) and total waveform distortion (TWD) used to determine the best method to analyze leakage current. The comparison shows that s-transform provide better time and frequency resolution than spectrogram.
I. INTRODUCTION
Polymeric insulation has been widely accepted all over the world. They have greater properties than ceramic insulator in term of weight, hidrophobicity and dielectric strength. However, the life performance of polymeric insulator still unknown due to insufficient physical resistance and chemical degradation on its surface [1]. Different methods and analytical techniques were used to analyze the aging effect on polymeric insulating materials. Surface condition of polymeric insulation material and their pollution severity can be determined by frequency component of leakage current. LC measurement is the most efficient technique because it can be monitored the performance of insulation either online or offline. Time frequency distribution (TFD) used as a method for varieties of applications such as power quality because it is appropriate for examining non stationary signals as can be seen in [2-5].
Most previous works use fast Fourier transform (FFT) to analyze the leakage current signal. However, it does not provide temporal information and is not appropriate for non stationary signal. Real signal hold not only fundamental frequency, 50 Hz but also contains harmonics and inter-harmonic components [6]. The analysis using time frequency
distribution (TFD) such as spectrogram and s-transform can be used to identify the harmonic and inter-harmonic components. As stated in [7, 8], the weakness of spectrogram is it has fixed resolution so it does not track the signal dynamics properly. The pattern of the leakage current has been stated in [9-11]. The extracted information from both methods which is root mean square (RMS), total harmonic distortion (THD), total non harmonic distortion (TnHD) and total waveform distortion (TWD) need to be considered when analyzing the signal because the content of total frequency could have strong influence into signal and can be use to determine the severity of the surface condition.
Incline Plane Test (IPT) that complying with BS EN 60578-2007 was conducted on Polypropylene polymeric composite to simulate a set of different LC patterns from capacitive, resistive or hydrophilic state and local arcing event. This research focused on time-frequency analysis techniques to analyze leakage current patterns. Spectrogram and s-transform are proposed and signal parameters are extracted based on their time-frequency characteristics. The performance of both algorithms are analyzed and compared to perform leakage current classification.
II. EXPERIMENTAL WORK
Fig. 1. Inclined plane test (IPT)
III. TIME-FREQUENCY ANALYSIS TECHNIQUES
In this section, there are two types of linear time frequency analysis techniques are presented. They are spectrogram and s-transform.
A. Spectrogram
Spectrogram is one of the time-frequency representations (TFR) that represents a three-dimensional of the signal energy with respect to time and frequency. Spectrogram is the squared magnitude of the STFT. This technique roughly reflects how frequency content changes over time. Smaller window size used produces better time resolution but it also reduces frequency resolution. This is cause by window effect.
2 observation window. In this study, Hanning window is selected because of its lower peak side lope [10] which is narrow effect on other frequencies around fundamental value (50 Hz in this study) and other frequency components.
B. S-transform
S-transform proposed by Stockwell [12] which time frequency spectral localization method that combine element of Wavelet transform and short time Fourier transform (STFT). S-transform employs a moving and scalable localizing Gaussian window and the equation of Gaussian window shown in (3). It combines a frequency dependent resolution with simultaneous localizing the real and imaginary spectra. The basis functions for the s-transform are Gaussian modulated cosinusoids whose width varies inversely with the frequency.
S-transform, introduced by Stockwell et al. (1996) is defined by the general equation (2):
2 2
g(t) the scalable Gaussian window and is a parameter which control the position of the Gaussian window on the x-axis. When the window is wider in time domain, s-transform provides better frequency resolution for lower frequency. While the window in narrower, it provide better time resolution for higher frequency.
IV. SIGNAL PARAMETERS
Parameters of the signal are estimated from the time frequency distribution to recognize the signal information in time.
A. Instantaneous RMS Current
The instantaneous RMS current is
max
B. Instantaneous RMS Fundamental Current (I1rms)
Instantaneous RMS fundamental current I1rms(t) is defined as the RMS current at power system frequency [13] and can be calculated as:
Where f1 is the fundamental frequency that corresponds to the power system frequency andΔf is the bandwidth which is set to 50Hz.
C. Total Harmonic Distortion (THD)
THD is the relative signal energy present at non-fundamental frequencies and written as:
D. Total nonHarmonic Distortion (TnHD)
Nonharmonics are not multiple integer signal components frequency of the power system frequency. Therefore, TnHD is referred as distinguishing between nonharmonic and noise, and is calculated as:
2 2
, 0 1
( ) ( )
( )
( )
H
RMS h h RMS
TnHD
RMS
I t I t
I t
I t
= −
=
∑
(8)
Where Im,RMS(t) is instantaneous RMS nonharmonic current and M is the highest measured nonharmonic component.
E. Total Waveform Distortion (TWD)
TWD consists of harmonic distortion and nonharmonic distortion. It can define as:
2 2
( ) ( ) ( )
TWD THD TnHD
I t = I t +I t
(9)
V. RESULTS
Results were analyzed using computer generated waveform using MATLAB obtained from both time-frequency distributions to determine their accuracy. Then, leakage current pattern are analyzed using spectrogram and s-transform.
A. TFDs Performance analysis
Fig. 2a shows the simulated signal consist of fundamental frequency 50Hz and 20th harmonic that is 1000Hz then the harmonic happen for 0.2s that is for 10 cycles. Fig. 2b irms in pu for spectrogram and Fig. 2c irms pu for s-transform. It clearly shows that the resolution of s-transform is higher than spectrogram based on the magnitudes of Irms.
ACKNOWLEDGMENT
REFERENCES
Fig. 2. IRMS value of spectrogram and s-transform
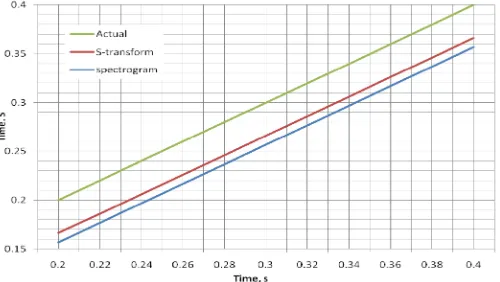
Fig. 2a shows the signal with 1000Hz and the duration measurements, Td have been varies in 0.2s until 0.4s to observe the accuracy of the time for both methods. The results
show in Fig. 3 point out s-transform values closer to actual time than spectrogram. This indicates that s-transform is more accurate.
Fig. 3. Duration measurements for different Td
Fig. 4a shows signal that contain harmonic and non-harmonic in time domain. The signal hold fundamental, harmonic 50 Hz, 350 Hz and 455 Hz which have different amplitudes that is 1A, 0.5A and 0.3A significantly. Fig. 4b shows the signal in spectrogram meanwhile Fig. 4c shows the s-transform for the signal.
Fig. 4. Spectrogram and s-transform for a signal with different frequencies
From Fig. 4 the information extracted that is THD and TnHD from both methods shown in Fig. 5a and Fig. 5b.
Fig. 5b. THD, TnHD and TWD from s-transform
Optimal technique can been determine by comparing the accuracy of both methods. In order to attain accuracy of the simulation result, mean absolute percentage error (MAPE) was used as index. Smaller value of MAPE indicates more accurate results. It have been tested in [14]. The equation for mean absolute percentage error (MAPE) is shown below. Where At is actual value, Ft is measured value and n is number of data.
1 100% n
t t
t t
A F
MAPE
n − A
−
=
∑
(10)
The MAPE value for Fig. 3 was calculated. The spectrogram MAPE result is 1.5095% and s-transform is 1.1811%. The MAPE results prove that s-transform gives the smaller value than spectrogram.
B. Leakage current analysis
The leakage current signals consist of several patterns that are capacitive, resistive, symmetrical discharge and unsymmetrical discharge. Fig. 6, 7, 8, 9 shows the parameter estimation obtains from spectrogram and s-transform for each leakage current patterns.
The amplitudes of IRMS have been normalized by dividing by the RMS value of the normal signal (resistive signal) over the window being analyzed. This is because at resistive signal only fundamental frequency, 50Hz exist. This information can be used to identify the surface condition of insulator.
In capacitive state, the IRMS value for spectrogram is higher than s-transform shown in Fig. 6b. Then, the other parameters only have slightly difference for each other. The capacitive state happen from 0 to 0.5kV.
Fig. 6. (a) Capacitive signal (b) Irms in pu (c) THD (d) TnHD (e) TWD
Fig. 7. (a) Resistive signal (b) Irms in pu (c) THD (d) TnHD (e) TWD
In symmetrical discharge state, there are only small differences for all the parameter. The symmetrical discharge pattern happens from 2.5kV to 3kV.
Fig. 8. (a) Symmetrical signal (b) Irms in pu (c) THD (d) TnHD (e) TWD
In unsymmetrical discharge state, there are significant differences at THD, TnHD and TWD values. The values for IRMS only have small differences from each others. The unsymmetrical discharges happen from 3kV until 3.5kV.
Fig. 9. (a) Unsymmetrical signal (b) Irms in pu (c) THD (d) TnHD (e) TWD
VI. CONCLUSION
ACKNOWLEDGMENT
The authors gratefully acknowledge the Faculty of Electrical Engineering, Universiti Teknikal Malaysia Melaka for giving the support in this study.
REFERENCES
[1] J. Mackevich and M. Shah, "Polymer outdoor insulating materials Part I: Comparison of porcelain and polymer electrical insulation," IEEE Electrical Insulation Magazine, vol. 13, pp. 5-12, 1997.
[2] P. K. Dash, B. K. Panigrahi, and G. Panda, "Power quality analysis using S-transform," Power Delivery, IEEE Transactions on, vol. 18, pp. 406-411, 2003.
[3] I. W. C. Lee and P. K. Dash, "S-transform-based intelligent system for classification of power quality disturbance signals," Industrial Electronics, IEEE Transactions on, vol. 50, pp. 800-805, 2003. [4] Z. Fengzhan and Y. Rengang, "Power-Quality Disturbance Recognition
Using S-Transform," Power Delivery, IEEE Transactions on, vol. 22, pp. 944-950, 2007.
[5] Z. Leonowicz, T. Lobos, and K. Wozniak, "Analysis of non-stationary electric signals using the S-transform," COMPEL: The International Journal for Computation and Mathematics in Electrical and Electronic Engineering, vol. Vol. 28, pp. pp.204 - 210, 2009.
[6] M. H. J. Bollen and I. Y.-H. Gu, in Signal Processing of Power Quality Disturbances, ed: John Wiley & Sons, Inc., 2005.
[7] E. Al-Ammar and G. G. Karady, "Transfer function analysis using STFT for improvement of the fault detection sensitivity in transformer impulse test," in Power Engineering Society General Meeting, 2005. IEEE, 2005, pp. 1855-1862 Vol. 2.
[8] S. Zhang, L. Ruirui, Q. Wang, J. T. Heptol, and G. Yang, "The research of power quality analysis based on improved S-Transform," in Electronic Measurement & Instruments, 2009. ICEMI '09. 9th International Conference on, 2009, pp. 2-477-2-481.
[9] M. A. R. M. Fernando and S. M. Gubanski, "Leakage current patterns on contaminated polymeric surfaces," IEEE Transactions on Dielectrics and Electrical Insulation, vol. 6, pp. 688-694, 1999.
[10] H. I. S. Jayasundara, W. P. S. Sudarshani, and M. A. R. M. Fernando, "Leakage Current Patterns on High Voltage Insulators: Analysis on Frequency and Time-frequency Domains," in Industrial and Information Systems, 2008. ICIIS 2008. IEEE Region 10 and the Third international Conference on, 2008, pp. 1-6.
[11] N. Q. Z. Abidin, A. R. Abdullah, N. Norddin, A. Aman, and K. A. Ibrahim, "Leakage current analysis on polymeric surface condition using time-frequency distribution," in Power Engineering and Optimization Conference (PEOCO), 2012 IEEE International, 2012, pp. 171-175. [12] R. G. Stockwell, L. Mansinha, and R. P. Lowe, "Localization of the
complex spectrum: the S transform," Signal Processing, IEEE Transactions on, vol. 44, pp. 998-1001, 1996.
[13] A. Kusko and M. T. Thompson, Power Quality in Electrical Systems: McGraw Hill, 2007.