A mean-variance approach to
fisheries management
Marius Radulescu, Constanta Zoie Radulescu, Magdalena Turek Rahoveanu
Abstract—A traditional approach for the fish management is the single-species approach. In the last decades a new approach has gained increased recognition. This is the ecosystem-based approach. An approach to fish management that is compatible with the ecosystem-based approach is the portfolio theory. In the present paper we present several mean-variance portfolio selection models for fish management. One of the models is the minimum risk model. For this model we determine the range of variation for the parameter
W (that represents a lower limit for the expected return) and for the budget of the harvesting plan. A numerical example for a fish farm of semi-intensive type, located in a village from the Danube Delta, Romania is discussed. An efficient frontier of the minimum risk problem is computed and displayed.
Keywords: fisheries management, portfolio theory, mean-variance model, multi-objective programming problem.
I. 0INTRODUCTION
traditional approach for the fish management is the single-species approach. Since the 1990s, fisheries managers have been advised to broaden their scope of awareness beyond single-species considerations owing to: - general poor performance of single-species fishery
management worldwide.
- heightened awareness of interactions among fisheries and ecosystems.
- better understanding of the functional value of ecosystems to humans.
- recognition of the wide range of societal objectives associated with fishery resources and ecosystems.
As a result, fisheries management has been shifting toward an ecosystem-based fisheries management, also called an ecosystem approach to fisheries (EAF). EAF strives to balance diverse societal objectives by taking into account the knowledge and uncertainties of biotic, abiotic, and human components of ecosystems and their interactions and applying
an integrated approach to fisheries within ecologically meaningful boundaries.
Manuscript received 15 july 2010. This work was supported by the National Center for Program Management under PN II Proiect 1622 (2008 - 2011), Contract: 52123/2008, Management Information System for farms fisheries in the South East Region with implications on the market.
M. Radulescu is with the Institute of Mathematical Statistics and Applied Mathematics, Bucharest,ROMANIA(e-mail:[email protected]).
C. Z. Radulescu is with the National Institute for R&D in Informatics, Bucharest, ROMANIA (e-mail: radulescu@ ici.ro).
M. Turek Rahoveanu, is with the Research Institute for Agricultural Economics and Rural Development, Bucharest, ROMANIA (e-mail: [email protected]).
The ecosystem approach to fishery management is a significant step towards sustainable use of the environment. An approach to fish management that is compatible with the ecosystem-based approach is the portfolio theory.
A portfolio framework systematically combines fish stocks that are joined by ecology (e.g., predation, competition) and unspecialized fishing technologies (e.g., mixed-species trawls) into a portfolio which balances expected aggregate returns against the risks associated with stock-attribute and other uncertainties. To be productive, however, this framework must be combined with property rights institutions that clearly state management objectives, create long-run time-horizons among harvesters, internalize spillovers caused by ecological and technological jointness, and reduce uncertainty through research and adaptive management. Although the cost of reducing scientific uncertainty about ecological interactions may limit the portfolio approach to intensive management of relatively few species, its scope can be broadened to integrate tradeoffs among more types of marine resources, such as nature preserves and oil and gas deposits.
In the present paper we present several mean-variance portfolio selection models for fish management: one multi-objective model with two multi-objective functions and three single objective models (a minimum risk model, a maximum expected return model and an optimal tradeoff model). The minimum risk model is similar to that presented in [1] with the exception of an additional constraint connected to the budget for fish harvesting. Also in our model we determine the range of variation for the parameter W and for the budget of the harvesting plan. A numerical example for a fish farm of semi-intensive type, located in Jurilovca village, Tulcea county, Romania is discussed. An efficient frontier of the minimum risk problem is computed and displayed.
II. 1MATHEMATICAL MODELS APPLIED IN FISHERIES MANAGEMENT
Fisheries management is one of the fields where mathematical models of operations research were first used and also where they have been most widely applied. The number of mathematical models in this domain has rapidly grown in the last decades, due to the impressive development of personal computers and commercial software programs.
Mathematical programming, differential equations, optimal control, decision theory, neural networks, probability theory,
A
Proceedings of the International Conference on Applied Computer Science
statistics represent a modest enumeration of disciplines that contribute to the improvement of fisheries management.
Applications of mathematical models in the fisheries management include analysis of optimal management decisions with regard to target stock levels over time, optimal employment of fishing effort and capital, and cost minimizing rules for monitoring and surveying stocks, or for enforcing fishing regulations.
The great majority of the problems connected to fisheries management have a multi-criteria character.
Well-defined objectives are obviously a prerequisite for sensible management of fisheries. Many objectives for fisheries have been suggested (see e.g. [2], and references therein). Among the most frequently mentioned objectives are: (i) maximum employment, (ii) maintaining regional habitation, (iii) maximum sustainable yield (MSY), (iv) conservation of fish stocks and the environment, (v) generation of exports and foreign exchange (vi) economic efficiency, i.e. maximum economic rents and (vii) social equity. Clearly, not all of these objectives are independent.
Multi-objective decision analysis (MDA) is a useful assessment method when fishery managers need a systematic investigation of the tradeoffs involved in the selection of alternative policy options. An important class of techniques within MDA is vector optimization, consisting of mathematical programming models with vector valued objective functions. From the management perspective, vector optimization models are particularly suited for situations when the decision rule requires each objective to be kept as high (or low) as possible. Solving vector optimization problems usually entails finding a set of Pareto-optimal solutions. These solutions are relevant to the decision-making process if decision-makers have monotonic preferences. In [3] a vector optimization model of the Eastern Pacific yellowfin tuna fishery is used to generate Pareto-optimal solutions and to evaluate the tradeoffs (shadow prices) involved in the selection of alternative policy options.
Three conflicting biological objectives are considered: (a) minimizing dolphin incidental mortality, (b) minimizing by-catch of all non-dolphin species and (c) maximizing total yellowfin tuna catch. Results are presented and discussed by means of non-linear tradeoff curves.
The traditional method to deal with a multi-objective optimization problem is to define one or several single objective optimization problems starting from the initial problem and to solve them. The fisheries management implies choice. For instance the basic choices are (i) which management system to adopt and (ii) what management measures to select. Logic dictates that it is either possible to make a choice or it is not. In the latter case, management will not be possible so there is no reason to waste valuable resources on research. The first case, where choice is possible, is more interesting.
In [4] the sustainable management of natural resources, and in particular of fisheries is studied. In their research the authors must take into account several conflicting objectives. This is the case in the French Guiana shrimp fishery for which profitability objectives imply a reduction in the fishing activity. On the one hand, this fishery has negative
externalities on marine biodiversity due to discards. On the other hand, this fishery has positive externalities on the economy of the local community and interestingly enough on a protected seabird species in the area (the Frigatebird that feeds on discards). In their paper the authors have several sustainability objectives: an economic objective in terms of the profitability of the fishing activity, and a conservation objective in terms of the Frigatebird population. For that purpose, they have developed a dynamic model of that bioeconomic system and study the trade-offs between the two conflicting objectives. Their study provides a means for the quantification of the economic and ecological objectives that ensure a viable management solution. In the same time their study leads to the development of new tools for the arbitration of conflicting sustainability objectives. In particular, such tools could be used as a quantitative basis for cost–benefit analysis taking into account environmental externalities.
In [5] the potential of choice modeling for evaluating the importance of potentially conflicting fisheries management objectives is examined. The fisheries of the English Channel are used as an example. Results from a survey of the key stakeholders in these fisheries are presented, showing that regional employment and sustainable yields are of key concern. Overall, the importance between objectives can be measured appropriately and the methodology can offer useful information to the management process.
In [6] is proposed a model that considers a long-term planning horizon and specifically allows an optimal total allowable catch quota to be obtained for the first planning period. A formulation and algorithmic resolution of a two-stage stochastic nonlinear programming model with recourse is presented. This model takes into account biomass dynamics, the conditions guaranteeing sustainable species management and uncertain parameters such as growth rate and species carrying capacity. These parameters are explicitly incorporated via a discrete random variable (scenarios). The proposed model is solved by Lagrangian decomposition using the algebraic modeling software AMPL, in combination with the solver MINOS to solve the nonlinear models resulting from the scenario decomposition.
In [7] is presented a modeling framework for assessing the implication of long term fisheries policy decisions. It illustrates an approach to model building that begins with establishment of a matrix reflecting the basic features of the fisheries sector and then proceeds to incorporate these features into an integer programming model. The model estimates the real cost of alternative policies and takes into account the various biological and economic constraints to production. The model has provided a valuable tool for the assessment of different policy options for Kuwait's fisheries sector. The options involved establish the most appropriate way to maximize fresh-fish self-sufficiency.
for underutilized capacity; the relevance of maxi-min objectives; and the computational implications of multispecies models.
In [9] are presented applications of neural networks in fisheries management. Some of these applications are connected to forecasting in fisheries that covers the distribution of eggs, recruitment, fish growth/age, biomass and fish catch. Other major areas are identification, abundance and food products, environmental factors and collapse of fishery industry. The data structures are given in tensorial notation.
In [10] the goal programming was used to optimize the achievement of Sri Lanka's fisheries development targets for the planning period 1988–1991.
In [11] were used mathematical programming methods in conjunction with multilevel planning concepts, to estimate the value of foreign access to U.S. fisheries.
An important mathematical instrument which was successfully applied to modeling the problems from fisheries management is portfolio theory. The above mentioned theory was developed as a result of the research in the domain of financial management. Its aim is the elaboration of a quantitative analysis of how investors can diversify their portfolio in order to minimize risk and maximize returns. The theory was introduced in 1952 by University of Chicago economics student Harry Markowitz, who published his doctoral thesis, “Portfolio Selection” in the Journal of Finance [12]. There exist many applications of portfolio theory to domains that do not imply finance such as agriculture, energy, biodiversity etc. For references regarding applications of portfolio theory to non-financial areas see [13] and [14]. The application of portfolio theory for finding an optimal harvesting portfolio is popular in the literature.
Managing fish stocks in terms of a portfolio of economic assets is likely to significantly increase benefits for society relative to single-species approaches. A portfolio framework systematically combines fish stocks that are joined by ecology (e.g., predation, competition) and unspecialized fishing technologies (e.g., mixed-species trawls) into a portfolio which balances expected aggregate returns against the risks associated with stock-attribute and other uncertainties. In [15] the authors note that in order to be productive, this framework must be combined with property rights institutions that clearly state management objectives, create long-run time-horizons among harvesters, internalize spillovers caused by ecological and technological jointness, and reduce uncertainty through research and adaptive management. Although the cost of reducing scientific uncertainty about ecological interactions may limit the portfolio approach to intensive management of relatively few species, its scope can be broadened to integrate tradeoffs among more types of marine resources, such as nature preserves and oil and gas deposits.
In [1] the authors adapt financial portfolio theory as a method for ecosystem-based fishery management that accounts for species interdependencies, uncertainty, and sustainability constraints. They illustrate their method with routinely collected data available from the Chesapeake Bay and demonstrate the gains from taking into account variances and covariances of gross fishing revenues in setting species total allowable catches.
In [16] the authors embed a portfolio decision framework into a multi-period bio-economic model in order to quantify the risk-benefit tradeoffs of alternative strategies. They develop alternative sets of processed seafood products for managing the risks that occur as a result of harvests from commercial fish stocks. The model is used to generate an efficient portfolio frontier to estimate possible rent dissipation from status quo management. Frontiers are also generated for seafood processors and brokers. The authors discuss implications for the different industry agents.
Drawing the analogy between managing risky assets and managing multispecies fisheries is a relatively new idea, even though the foundation for this idea is neither new to ecology nor economics. In ecology, Walters at al. [17] derives a mean-variance frontier for single-species management, while Real [18] uses portfolio theory to describe animal behavior.
Portfolio management of fisheries can be a means of allocating catch across life history stages. Baldursson and Magnusson [19], Arrason [20] alludes to multispecies portfolio management in a deterministic bioeconomic model by suggesting that managers choose a vector of Total Allowable Catches (TACs), while Hanna [21] explicitly discusses the idea of selecting “species portfolios” as a means to match management objectives with ecosystem structure. Hilborn et al. [22] provide a justification for portfolio management at the regional level by pointing out that total productivity aggregated across species is subject to less variability than the productivity of individual species. Edwards et al. [15] formally develop the analogy within the context of standard bio-economic models and provide a stylized simulation of a three-species system. More recently, Perusso at al. [23] apply portfolio theory to individual fishermen targeting decisions in the U.S. Atlantic and Gulf of Mexico pelagic longline fishery. An interesting survey on the application of portfolio theory to fisheries management may be found in [24]. Several references on applications of operations research to fish management can be found in [25], [26].
III. 2MEAN-VARIANCE PORTFOLIO SELECTION MODELS FOR FISHERIES MANAGEMENT
Suppose that we have n fish species . Denote by
n S S S1, 2,...,
i
ξ the return obtained from one kg of fish of species . Of course all
i S
i
ξ are random variables. Let ξ=
(
ξ1,ξ2,...,ξn)
i
denote the random vector of returns. Denote by μ the mean of ξi. Let μ=
(
μ1,μ2,...,μn)
. Denote by the costassociated to fishing one kg of fish from species and with the maximum sustainable yield for the fish of species S .
i b
i S
i
a i
Let a=
(
a1,a2,...,an)
,b=(
b1,b2,...,bn)
. Denote by( )
cij=
C the covariance matrix of the random vector
(
ξ1,ξ2,...,ξn)
=
ξ . That is cij =cov
(
ξi,ξj)
, 1≤i,j≤n. Thesignification of is the correlation between species
revenues. These correlations can be negative or positive depending on the relative strength of trophic interactions, environmental fluctuations, and fishing intensity and gear
ij c
Proceedings of the International Conference on Applied Computer Science
)
B. 5The maximum expected return problem
choices that determine fish stocks and corresponding catch rates, as well as output market interactions that affect prices.
Let be the quantity harvested from fish of species . Of course for every i=1,2,…,n. The vector
will be called a portfolio. The cost of
harvesting a portfolio x is equal to . The return
(resp. the expected return) from harvesting a portfolio x is
equal to (resp. to ).
i x
(
1,x2i i S 0 ≥ i x n x ξT = i ix x ,..., = x 1
∑
= n ξ x bT 1 =∑
= n i i ix b x μT = i ix μ x 1∑
= n iIn reality the vectors a=
(
a1,a2,...,an)
,(
nIn the frame of this problem the decision maker looks for a portfolio x=
(
x1,x2,...,xn)
that maximizes the expected returnand satisfies the following constraints: the risk is smaller than a given limit τand the sum invested in the portfolio of fish is equal to M.
⎪ ⎪ ⎩ ⎪⎪ ⎨ ⎧ ≤ ≤ = ≤ a x 0 x b Cx x x μ , max T T T M τ
)
τ. In order to find the limits of this range we shall solve the An important problem is to find the range of the parameter following problemsξ ξ ξ1, 2,...,
=
ξ
and μ=
(
μ1,μ2,...,μn)
and the matrix C=( )
cij depend ontime. Fishing and pollution are important factors that make that the above mentioned vectors and matrix vary along the time. For short periods of time one can consider that these vectors and the covariance matrix are constant.
The financial risk of the portfolio x may be defined in several ways. One traditional way is to define the risk as the variance of the return f1
( )
x =Var( )
ξTx =xTCx.A general problem in the fisheries management is the following multi-objective problem
(
)
( )
⎪ ⎪ ⎩ ⎪ ⎪ ⎨ ⎧ ≤ ≤= 0 x a
x b x μ Cx x , subject to maximize minimize T T T M
Starting from the above multi-objective problem one can formulate the following single objective problems: the minimum risk problem, the maximum expected return problem, the optimal tradeoff problem.
(τmin) min
{
xTCx:bTx= ,0≤x≤a}
M
(τmax) max
{
xTCx:bTx=M,0≤x≤a}
Denote the optimal value of the problem (τmin)with τ1
and the optimal value of the problem (τmax)with τ2. The
decision maker may choose the parameter τin the range
[
τ1,τ2]
.C. 6The optimal tradeoff problem
For every α∈
[ ]
0,1 consider the problem( )
αP min
{
(
1−)
xTCx− μ x:bTx= ,0≤x≤a}
M T
α α
Every optimal portfolio of the above problem is called an efficient portfolio.
D. 7Numerical example
In this section we shall study an application of the minimum risk model for a fish farm of semi-intensive type, located in the region Danube Delta, at village Jurilovca, Tulcea county, Romania. The fishery area is 834 ha and 779 ha of it are covered by water. We study 9 fish species: Carp, Sanger, Novac, Pike, Catfish, Crucian, Perch, Bream and Roach. The historical data on the fish market prices are from the period 2000-2008. The sum invested in the harvest plan is M=5000 RON. As a result of computation we find W min = 2.71 x 10³ RON,
A. 4The minimum risk problem
In the frame of this problem the decision maker looks for a portfolio that minimizes the financial risk and satisfies the following constraints: the expected return is greater than a given limit W and the sum invested in the portfolio of fish is equal to M.
(
x1,x2,...,xn=
x
)
W max = 21.81 x 10³ RON.
[image:4.612.328.545.561.718.2](
)
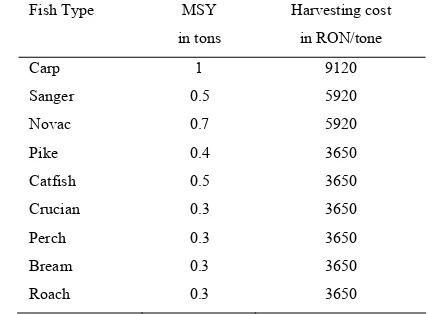
⎪ ⎪ ⎩ ⎪ ⎪ ⎨ ⎧ ≤ ≤ = ≥ a x 0 x b x μ Cx x M W T T T minTABLE 1. THE MAXIMUM SUSTAINABLE YIELD (MSY) AND THE HARVESTING COST FOR THE FISH SPECIES
Fish Type MSY
in tons
Harvesting cost
in RON/tone
Carp 1 9120
Sanger 0.5 5920
Novac 0.7 5920
Pike 0.4 3650
Catfish 0.5 3650
Crucian 0.3 3650
Perch 0.3 3650
Bream 0.3 3650
Roach 0.3 3650
One can easily see that . An important problem is to find the range of the parameter W. In order to find the limits of this range we shall solve the following problems
a b 0≤M ≤ T
(Wmin) min
{
μTx:bTx=M,0≤x≤a}
(Wmax) max
{
μTx:bTx=M,0≤x≤a}
Denote the optimal value of the problem (Wmin) with and the optimal value of the problem (Wmax) with . The decision maker may choose the parameter W in the range
.
1
W
2
W
TABLE 2. HISTORICAL DATA ON THE MARKET PRICES FOR THE FISH SPECIES (IN 103 RON /TONE) Fish Type 2000 2001 2002 2003 2004 2005 2006 2007 2008
Carp 4.5 4.5 5.0 5.5 6.2 6.7 7.0 7.5 7.8
Sanger 2.5 2.5 2.8 2.8 3.0 3.2 3.5 3.8 5.0
Novac 2.5 2.5 2.8 2.8 3.0 3.2 3.5 3.5 5.0
Pike 4.5 5.0 5.5 6.5 6.5 7.0 7.0 7.0 7.5
Catfish 6.5 7.0 7.0 8.0 8.5 8.5 9.0 9.0 9.5
Crucian 1.8 2.0 2.2 2.2 2.4 2.6 2.8 3.0 3.5
Perch 9.5 9.5 9.5 10.0 10.0 11.0 11.0 11.0 13.0
Bream 1.8 1.8 2 2.2 2.2 2.5 2.7 2.8 3.2
[image:5.612.94.517.229.519.2]Roach 1.8 1.8 2 2.2 2.2 2.5 2.7 2.8 3.2
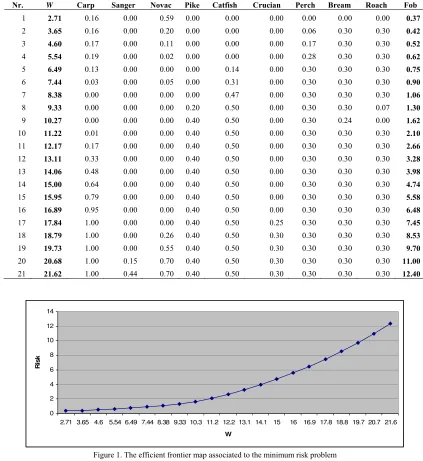
TABLE 3. FISH PORTFOLIOS FOR VARIOUS VALUES OF THE PARAMETER W.
Nr. W Carp Sanger Novac Pike Catfish Crucian Perch Bream Roach Fob
1 2.71 0.16 0.00 0.59 0.00 0.00 0.00 0.00 0.00 0.00 0.37
2 3.65 0.16 0.00 0.20 0.00 0.00 0.00 0.06 0.30 0.30 0.42
3 4.60 0.17 0.00 0.11 0.00 0.00 0.00 0.17 0.30 0.30 0.52
4 5.54 0.19 0.00 0.02 0.00 0.00 0.00 0.28 0.30 0.30 0.62
5 6.49 0.13 0.00 0.00 0.00 0.14 0.00 0.30 0.30 0.30 0.75
6 7.44 0.03 0.00 0.05 0.00 0.31 0.00 0.30 0.30 0.30 0.90
7 8.38 0.00 0.00 0.00 0.00 0.47 0.00 0.30 0.30 0.30 1.06
8 9.33 0.00 0.00 0.00 0.20 0.50 0.00 0.30 0.30 0.07 1.30
9 10.27 0.00 0.00 0.00 0.40 0.50 0.00 0.30 0.24 0.00 1.62
10 11.22 0.01 0.00 0.00 0.40 0.50 0.00 0.30 0.30 0.30 2.10
11 12.17 0.17 0.00 0.00 0.40 0.50 0.00 0.30 0.30 0.30 2.66
12 13.11 0.33 0.00 0.00 0.40 0.50 0.00 0.30 0.30 0.30 3.28
13 14.06 0.48 0.00 0.00 0.40 0.50 0.00 0.30 0.30 0.30 3.98
14 15.00 0.64 0.00 0.00 0.40 0.50 0.00 0.30 0.30 0.30 4.74
15 15.95 0.79 0.00 0.00 0.40 0.50 0.00 0.30 0.30 0.30 5.58
16 16.89 0.95 0.00 0.00 0.40 0.50 0.00 0.30 0.30 0.30 6.48
17 17.84 1.00 0.00 0.00 0.40 0.50 0.25 0.30 0.30 0.30 7.45
18 18.79 1.00 0.00 0.26 0.40 0.50 0.30 0.30 0.30 0.30 8.53
19 19.73 1.00 0.00 0.55 0.40 0.50 0.30 0.30 0.30 0.30 9.70
20 20.68 1.00 0.15 0.70 0.40 0.50 0.30 0.30 0.30 0.30 11.00
21 21.62 1.00 0.44 0.70 0.40 0.50 0.30 0.30 0.30 0.30 12.40
0 2 4 6 8 10 12 14
2.71 3.65 4.6 5.54 6.49 7.44 8.38 9.33 10.3 11.2 12.2 13.1 14.1 15 16 16.9 17.8 18.8 19.7 20.7 21.6
W
Ri
s
k
Figure 1. The efficient frontier map associated to the minimum risk problem
In the second (resp. third) column from Table 1 is displayed the vector a (resp. the vector b). In the Table 2 are presented
the historical data of the market prices for the fish species and in the Table 3, the optimal fish portfolios for different values Proceedings of the International Conference on Applied Computer Science
[image:5.612.91.514.235.696.2]of parameter W. In the last column of the Table 3 is displayed the optimal value of the objective function (the variance of the return).
In Figure 1 is displayed the graph of the efficient frontier map associated to the minimum risk problem. That is to every value of the parameter W corresponds the minimum value of the objective map (the variance of the return).
The minimum risk problem was solved for various values of the parameter W with the NLP solver from GAMS. The limits of the range of variation of the parameter W were obtained with the MINLP solver from GAMS.
3IV.CONCLUSION
The paper studies an approach based on portfolio theory for fisheries management. The numerical example presented is based on real data. It shows that the portfolio theory is a suitable approach for the fish management. A valuable idea for further research is to study portfolio selection models based on downside risk measures such as: semi-variance, lower partial moments, probability shortfall or value-at-risk.
REFERENCES
[1] J. N. Sanchirico, M. D. Smith, D. W. Lipton, “An empirical approach to ecosystem-based fishery management”, Ecological Economics, Volume 64, Issue 3, 15, 2008, pp 586-596.
[2] A.T. Charles, Sustainable Fishery Systems, Oxford U.K.: Blackwell Science, 2001, 370 p.
[3] R. R. Enríquez-Andrade, J. G. Vaca-Rodríguez, “Evaluating ecological tradeoffs in fisheries management: a study case for the yellowfin tuna fishery in the Eastern Pacific Ocean”, Ecological Economics, Volume 48, Issue 3, 31 March 2004, pp 303-315.
[4] V. Martinet, F. Blanchard, “Fishery externalities and biodiversity: Trade-offs between the viability of shrimp trawling and the conservation of Frigatebirds in French Guiana”, Ecological Economics, Volume 68, Issue 12, 15 October 2009, pp 2960-296.
[5] P. Wattage, S. Mardle, S. Pascoe, “Evaluation of the importance of fisheries management objectives using choice-experiments”, Ecological Economics, Volume 55, Issue 1, 5 October 2005, pp 85-95.
[6] V. M. Albornoz, C. M. Canales, “Total allowable catch for managing squat lobster fishery using stochastic nonlinear programming”,
Computers and Operations Research, Volume 33, Issue 8 August 2006 pp: 2113 - 2124.
[7] M Khorshid, “Fisheries development planning in Kuwait: An integer programming model”, European Journal of Operational Research, Volume 64, Issue 3, 5 February 1993, pp 338-353.
[8] L. E. Stanfel, “New dynamic programming models of fisheries management”, Mathematical and Computer Modelling, Volume 10, Issue 8, 1988, pp 593-607.
[9] I. Suryanarayana, A. Braibanti, R. S. Rao, V. A. Ramam, D. Sudarsan, G. N. Rao, “Neural networks in fisheries research”, Fisheries Research, Volume 92, Issues 2-3, August 2008, pp 115-139.
[10] P. Muthukude, J. L. Novak, C. Jolly, “A goal programming evaluation of fisheries development plans for Sri Lanka's coastal fishing fleet, 1988– 1991”, Fisheries Research, Volume 12, Issue 4, December 1991, pp 325-339.
[11] E. Meuriot and J. M. Gates, “Fishing Allocations and Optimal Fees: A Single and Multilevel Programming”, Analysis, American Journal of Agricultural Economics, Vol. 65, No. 4 Nov., 1983, pp. 711-721. [12] H.M. Markowitz, “Portfolio selection”, J.of Finance. 8, 1952, pp 77-91. [13] M. Radulescu, S. Radulescu, C.Z. Radulescu, Mathematical Models for
Optimal Asset Allocation. (Romanian). Editura Academiei Române, Bucureşti, 2006.
[14] M. Radulescu, C.Z. Radulescu, Gh. Zbaganu, “Asset allocation models in discrete variable”, Studies in Informatics and Control, Volume 18, Number 1, 2009, pp 63-70.
[15] F. S. Edwards, J. S. Link, B. P. Rountree, “Portfolio management of wild fish stocks”, Ecological Economics, Volume 49, Issue 3, 1, 2004, pp 317-329.
[16] S. Larkin, G. Sylvia, and C. Tuininga, “Portfolio Analysis for Optimal Seafood Product Diversification and Resource Management”, Journal of Agricultural and Resource Economics 28(2) 2003 pp: 252-271
[17] C. Walters, “Optimal Harvest Strategies for Salmon in Relation to Environmental Variability and Uncertain Production Parameters,”
Journal of the Fisheries Research Board of Canada 32, 1975, 1777-1784.
[18] L.A. Real, “Animal Choice Behavior and the Evolution of Cognitive Architecture”, Science 253, 1991, pp: 980-986.
[19] F.M. Baldursson, and G. Magnusson , “Portfolio Fishing,” Scandinavian Journal of Economics 99(3), 1997, 389-403.
[20] R. Arnason, “Ecological Fisheries Management Using Individual Transferable Share Quotas”, Ecological Applications 8, 1998, pp: S151-S159.
[21] S. Hanna, “Institutions for Marine Ecosystems: Economic Incentives and Fishery Management”,Ecological Applications 8, 1998, pp: S170-S174. [22] R. Hilborn, J-J. Maguire, A.M. Parma, A.A. Rosenberg, “The
Precautionary Approach and Risk Management: Can They Increase the Probability of Successes in Fishery Management?” Canadian Journal of Fisheries and Aquatic Sciences 58, 2001, pp: 99-107.
[23] L. Perruso, R. N. Weldon, and S. L. Larkin. "Predicting Optimal Targeting Strategies in Multispecies Fisheries: A Portfolio Approach."
Marine Resource Economics 20, no. 1, 2005, pp: 25-45.
[24] M. M. Yang, “The portfolio approach for the ecosystem-based fishery management”, Economics Department, University of Auckland, PhD Research Proposal, April 2008.
www.nzares.org.nz/pdf/A%20Portfolio%20Approach.pdf
[25] R. Arnason, “Fisheries management and operations research”, European Journal of Operational Research, Volume 193, Issue 3, 16 March 2009, pp: 741-751.