Pengisian poin C sampai dengan poin H mengikuti template berikut dan tidak dibatasi jumlah kata atau halaman namun disarankan seringkas mungkin. Dilarang menghapus/memodifikasi template ataupun menghapus penjelasan di setiap poin.
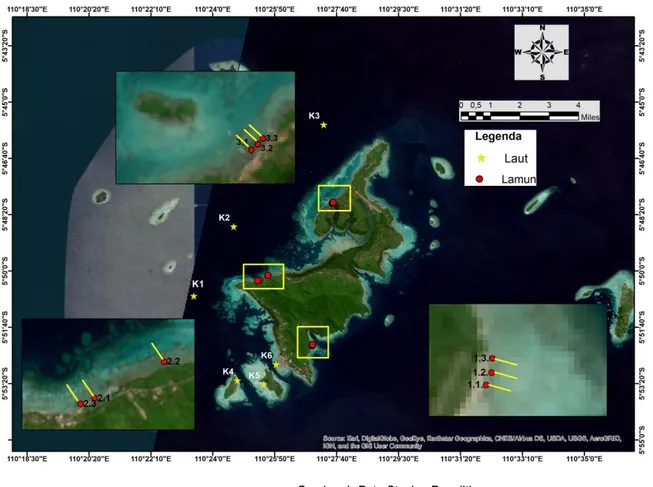
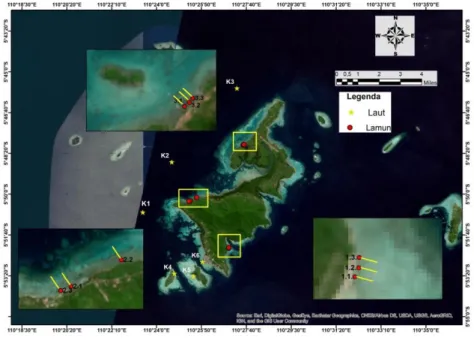
Tahun pertama (I) pelaksanaan penelitian “Sistem Karbonat dan Estimasi Potensi Serapan Karbon pada Lammun di Perairan Kepulauan Seribu dan Kepulauan Karimunjawa” dilaksanakan di perairan Karimunjawa pada tanggal 26-30 Agustus 2020 sesuai dengan rencana awal yang ada di proposal pelaksanaan. Terdapat 15 stasiun yang diambil dalam penelitian ini terdiri dari 9 stasiun (Pantai Bobi 1.1 ; 1.2 ; 1.3; Pantai Alang-Alang 2.1 ; 2.2 ; 2.3; Pantai dekat Pulau Mrican 3,1 ; 3,2 ; 3,3) yang dilakukan pengukuran fluks CO2 dan estimasi serapan karbon pada lamun. Enam (6) stasiun lainnya yaitu K1 ; K2 ; K3 ; K4 ; K5 : K6 hanya dilakukan pengukuran fluks CO2. Adapun peta sebaran stasiun tersaji pada Gambar 1.
Gambar 1. Peta Stasiun Penelitian
C.1. Peranan Perairan (Fluks CO2) Sistem Karbonat Laut
Di perairan alami, sistem karbon anorganik dapat didefinisikan oleh empat parameter yaitu total terlarut CO2 anorganik (DIC), alkalinitas total (TA), pH dan fugacity CO2 (fCO2) (Waters, 2012; Afdal, 2016). Data DIC diperlukan dalam perhitungan pCO2 (tekanan parsial) dan selanjutnya dapat dipakai sebagai dasar perhitungan fluks karbon (Prasetyawan et al. 2
Tabel 1. Sistem Karbonat Perairan Karimunjawa
Stasiun TA HCO3 out CO3 out CO2 out DIC
(µmol/kg) (µmol/kgSW) (µmol/kgSW) (µmol/kgSW) (µmol/kgSW) (mg/l) (mEq/L)
2 6 6 2 6 6 2
2 6 2 6 6 26
C. HASIL PELAKSANAAN PENELITIAN: Tuliskan secara ringkas hasil pelaksanaan penelitian yang telah dicapai sesuai tahun pelaksanaan penelitian. Penyajian dapat berupa data, hasil analisis, dan capaian luaran (wajib dan atau tambahan). Seluruh hasil atau capaian yang dilaporkan harus berkaitan dengan tahapan pelaksanaan penelitian sebagaimana direncanakan pada proposal. Penyajian data dapat berupa gambar, tabel, grafik, dan sejenisnya, serta analisis didukung dengan sumber pustaka primer yang relevan dan terkini.
6 2 2 6 6 2 2 2 6 2 2 2 22 2 2 6 6 6 2 2 2 2 2 2 2 2 6 62 2 6 6 6 2 2 2 2 2 2 2 6 2 26 2 2 2 2 6 6 6 666 2 6 2 K1 22 2 6 2 2 22 6 K2 2 2 6 2 2 6 K3 2 6 2 2 2 6 K4 2 6 6 6 2 2 K5 22 6 2 2 2 6 2 6 K6 2 2 2 2 2 2 22 2
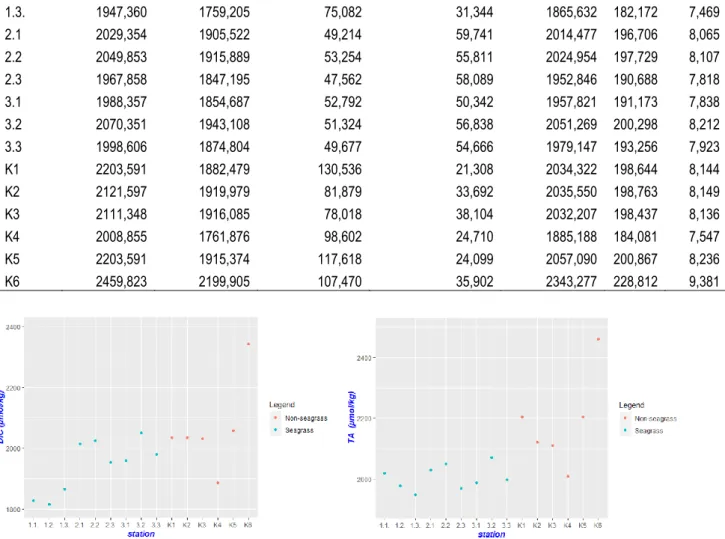
Gambar 2. Konsentrasi DIC dan TA pada ekosistem lamun dan non lamun
Pada Tabel 1 di atas terlihat bahwa semakin kecil HCO3- maka pH akan mengalami meningkat, sebaliknya semakin besar kandungan HCO3- dalam perairan maka pH semakin menurun. Hal tersebut dikarenakan terjadinya perubahan komposisi organisme pada perairan yang memanfaatkan bikarbonat (HCO3-) yaitu fitoplakton. Kelimpahan fitoplankton dalam hal ini diwakilkan oleh kandungan klorofil-a pada perairan, dimana klorofil-a semakin meningkat yang dimungkinkan melimpahnya kelimpahan fitoplankton sehingga konsumsi bikarbonat HCO3- untuk fotosintesis semakin banyak mengakibatkan HCO3- dalam perairan semakin rendah dan akan mengurangi jumlah ion H+ dan meningkan pH. Menurut Williams and Follows (2011) dan Millero (2013) bahwa penurunan pH disebabkan karena terjadi peningkatan pemanfaatan HCO3- dan akan mengurangi jumlah ion H+ dan meningkatkan pH.
Tekanan parsial karbon dioksida (pCO2) salah satunya dipengaruhi oleh suhu perairan. Jika dilihat pada Tabel 1 dan 2 pCO2 air berkurang dengan semakin menurunnya suhu perairan. Menurut Lakshmi (2013), menyatakan bahwa perairan laut hangat umumnya pada lintang rendah akan mengurangi kelarutan CO2 sehingga menyebabkan efek peningkatan pCO2 air laut, sebaliknya. Penelitian-penelitian lainnya seperti Yasunaka et al. (2016), Arnone et al., (2017) , Ito et al. (2018) menghasilkan bahwa suhu perairan yang relatif dingin akan menguragi pCO2 air laut sehingga laut cenderung berperan sebagai sink CO2. Tekanan parsial karbon dioksida (pCO2) dan produktivitas primer yang ada di lautan merupakan kunci penting dalam mekanisme pompa biologi (Ono et al. 2
Tabel 2. Variabel Kualitas Air dan Kesuburan Perairan Karimunjawa
Stasiun (mg/l) DO Salinitas Suhu Fosfat Nitrat Klorofil-a
(oC) (mg/l) (mg/l) (mg/m3) 2 2 2 2 6 2 2 6 2 2 2 6 2 2 2 2 2 2 2 2 2
Stasiun (mg/l) DO Salinitas Suhu Fosfat Nitrat Klorofil-a (oC) (mg/l) (mg/l) (mg/m3) 2 2 2 6 2 2 2 2 2 2 2 2 K1 2 6 2 K2 2 K3 2 2 6 2 2 K4 2 2 2 K5 2 2 2 K6 2 2 2 Fluks CO2
Analisis fluks CO2 berkisar antara 7,24 – 73,18 mmol/m2/hari dengan fungsi perairan sebagai source CO2 menyerap CO2 kemudian melepaskan kembali ke atmosfer baik untuk perairan yang terdapat ekosistem lamun maupun yang tidak terdapat ekosistem lamun. Hal tersebut dikarenakan nilai ΔpCO2 yang positif berkisar antar 21,57 – 213,89 µatm. Nilai ΔpCO2 yang positif dikarenakan nilai pCO2sea lebih tinggi (396,0 – 586,98 µatm) dibandingkan dengan nilai pCO2atm (372,16 – 375,0 µatm).
Tabel . Fluks CO2 Perairan Karimunjawa
Stasiun Suhu
(oC) Salinitas CO2 air pCO2sea(µatm) pCO2atm (µatm) ΔpCO2 (µatm) kwa Kh
Flux CO2 (mmol m-2 day- 2 266 2 2 2 26 6 22 2 2 662 2 2 2 2 2 2 2 6 2 2 2 6 2 22 26 2 2 6 266 6 2 6 2 26 2 2 2 2 2 6 2 2 6 2 2 2 2 2 2 2 6 6 66 66 2 2 6 6 2 6 6 2 22 6 26 26 66 2 2 2 2 2 6 2 6 2 6 2 26 2 2 2 2 6 6 6 2 2 2 26 66 K1 2 2 6 2 222 6 26 26 2 2 K2 6 2 2 6 6 6 2 6 K3 2 6 6 6 2 6 2 6 2 266 2 2 6 K4 2 2 2 2 6 26 2 K5 2 2 2 26 222 2 K6 2 2 2 62 2 26 26 6 2
Pada Tabel 3 terlihat bahwa fungsi perairan Karimunjawa terutama saat musim kemarau saat bertiup angin monsoon tenggara, berperan sebagai source CO2 artinya lautan menyerap CO2 dari atmosfer kemudian mengembalikan kembali ke atmosfer. Hal tersebut dikarenakan nilai tekanan parsial CO2 lautan yang lebih tinggi dibandingkan CO2 atmosfer, selain itu dikarenakan nilai suhu perairan yang tinggi. Perairan yang memiliki suhu tinggi lebih sukar untuk melarutkan CO2 sebaliknya perairan dengan suhu rendah / dingin, akan lebih mudah melarutkan CO2.
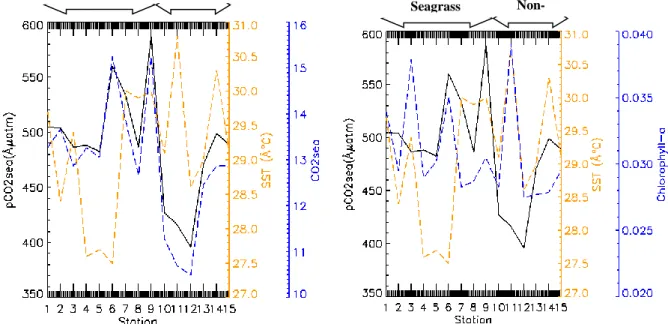
Gambar 3. Hubungan Tekanan Parsial CO2 Perairan dengan Suhu, CO2air dan Klorofil-a
Gambar 4.Hubungan FLuks CO2 dengan pCO2sea, PCO2atm, kwa dan kh
C.2. Estimasi Potensi Simpanan Karbon pada Jaringan Lamun
Kerapatan Lamun
Pada Tabel 4., tersaji kerapatan Lamun pada Pantai Bobi. Pada tabel tersebut terlihat bahwa jenis Cymodocea rotundata (Cr) yang mendominasi dan melimpah, selain jenis Cr terdapat juga jenis Th dan Ho yang banyak, sedangkan jenis Ea dan Cs tidak ditemukan di pantai ini. Ada jenis menarik dan baru ditemukan di Pantai Bobi yang tidak ditemukan di pantai lainnya yaitu jenis Zc (Zostera capricorni) walaupun kelimpahannya hanya sedikit. Selain Cr mendominasi persebaran Cr juga merata dari line 0 m (pertama kali ditemukan lamun), line 25 m setelahnya sampai line 50 m.
Tabel . Kerapaan Lamun pada Pantai Bobi
No. Jenis Lamun Kerapatan Lamun (ind/m) Stasiun 1 Pantai Bobi
Line1 Line 2 Line 3
Enhalus acoroides Ea 2 Thalassia hemprichii Th 2 2 2 2 2 Non-Seagrass Seagrass Non-Seagrass Seagrass Non-Seagrass Seagrass Non-Seagrass Seagrass
Cymodocea serrulata Cs
Cymodocea rotundata Cr
Halophila ovalis Ho 2 6 2 6 6
6 Zostera capricorni Zc
Pada Tabel , tersaji kerapatan lamun di Pantai Alang-Alang. Pada Pantai Alang-Alang jenis lamun yang ditemukan cukup banyak dibandingkan pada Pantai Bobi, dimana pada Pantai Alang-Alang terdapat 5 jenis lamin yang ditemukan yaitu Ea, Th, Cs, Cr dan Ho. Kerapatan lamun yang paling banyak ditemukan pada Cs kemudian Th dan Ea, dan ditemukan paling sedikit jenis Cr dan Ho. Pada Pantai Alang-Alang jenis yang mendominasi Cs banyak ditemukan pada Line 3 dari line 0, 25 sampai 50 m. Hal ini dikarenakan pada line 3 jauh dari tempat bersandar atau berlabuh kapal. Sedangkan line 1 dan 2 digunakan untuk tempat berlabuh kapal,sehingga jenis Cs yang memiliki morfologi yang kecil tidak dapat tumbuh dengan baik. Walaupun begitu, Line 1 dan 2 didominasi oleh Ea yang memiliki morofologi dan perakaran yang kuat sehingga dapat bertahan.
Tabel . Kerapatan Lamun pada Pantai Alang-Alang
No Jenis Lamun Kerapatan Lamun (ind/m2) Stasiun 2 Pantai Alang-Alang
Line1 Line 2 Line 3
Enhalus acoroides Ea 2 2 2 2 Thalassia hemprichii Th 6 2 Cymodocea serrulata Cs Cymodocea rotundata Cr 2 2 Halophila ovalis Ho 6 Zostera capricorni Zc
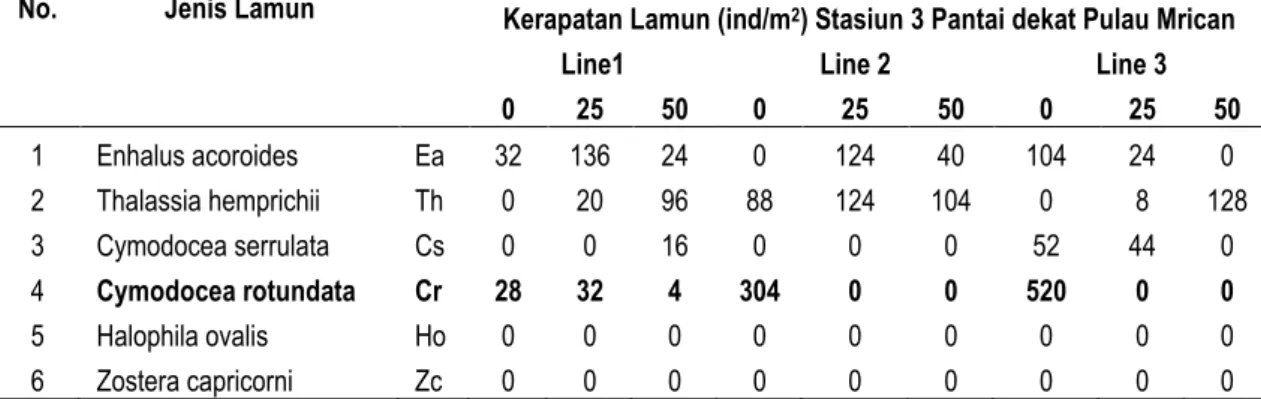
Pada Tabel 6, tersaji kerapatan lamun di Pantai dekat Pulau Mrican. Pada pantai ini jenis lamun yang ditemukan terdapat 4 jenis yaitu Cr, Th, Ea, dan Cs, dimana kerapatan tertingi ditemukan pada jenis Cymodocea rotundata (Cr) dan yang paling sedikit adalah Cs. Jenis Cr yang mendominasi sebagian besar ditemukan pada kuadran pertama 0 meter pada line 3 dan line 2, sedangkan pada line 1 ditemukan paling sedikit. Hal tersebut dikarenaka pada Line 1 dekat dengan tempat penyandaran kapal, sehingga dimungkinkan lamun jenis Cr rusak saat kapal berlalu-lalang, dengan morfologi Cr yang kecil. Jenis lamun yang mendominasi pada line 1 ini yait Ea dimungkinkan karena morfologi yang besar dan perakaran kuat, sehingga mampu bertahan. Pada Line 2 dan 3 jauh dari tempat bersandar kapal, sehingga lamun jenis Cr dapat tumbuh dengan baik. Tabel 6. Kerapaan Lamun pada Pantai dekat Pulau Mrican
No. Jenis Lamun Kerapatan Lamun (ind/m) Stasiun 3 Pantai dekat Pulau Mrican
Line1 Line 2 Line 3
Enhalus acoroides Ea 2 6 2 2 2 2 Thalassia hemprichii Th 2 6 2 2 Cymodocea serrulata Cs 6 2 Cymodocea rotundata Cr Halophila ovalis Ho 6 Zostera capricorni Zc
Pengukuran Karbon Lamun
Pengukuran karbon lamun belum selesai dilakukan dikarenakan keterbatasan alat tanur sehingga pemakaian alat tersebut harus bergantian dengan peneliti lainnya. Estimasi karbon lamun didekati dengan metode pengabuan Loss On Ignition (LOI) pada jaringan lamun atas (daun) dan Bawah (rhizome dan akar). Pada Tabel 7 terlihat bahwa kandungan karbon lamun bawah substrat (rhizome dan akar) memiliki nilai yang lebih besar dibandingkan kandungan karbon lamun atas substrat (daun). Kandungan total karbon lamun pada stasiun 2 (19,625 gC/m2) lebih tinggi dibandingkan dengan stasiun 1 (16,076 gC/m2) dan stasiun 3 (8,966 gC/m2).
Tabel 7. Karbon pada Lamun
Stasiun Line Biomassa (kgC/m2) Konversi (gC/m2)
Total substrat Atas substrat Bawah substrat Atas substrat Bawah Total
66 2 22 2 2 2 6 2 2
6 26 62 2 2 6 6226 2 2 6 2 6 2 2 2 2 6 6 2 2 6 6 6 6 6 6 6 6 2 626 2 2 2 2 22 2 2 22 22 6 6 2 6 2 2 6 2 2 2
C3. Hasil Penelitian TA Mahasiswa
Berikut adalah hasil penelitian tugas akhir mahasiswa yang mengikuti kegiatan penelitian ini, dimana terdapat 2 mahasiswa yang mengkaji Fluks CO2 dan 2 mahasiswa mengkaji estimasi karbon pada lamun.
TA mahasiswa mengkaji Fluks CO2 di Perairan Laut Lepas bagain barat karimunjawa
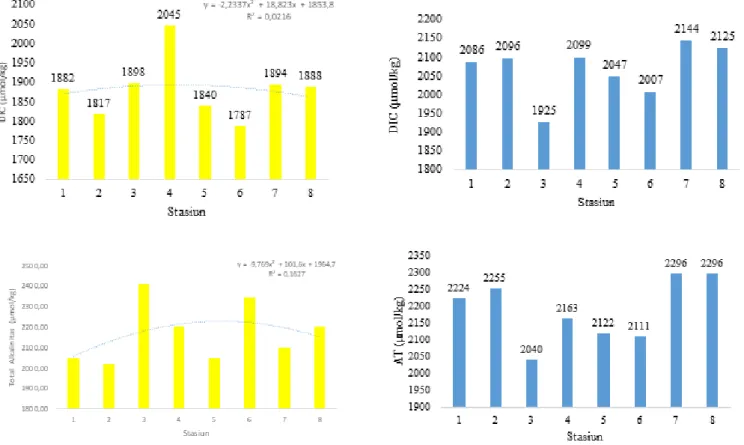
Pada Tabel. Sistem karbonat dan kualitas perairan dengan dua lokasi yang berbeda yaitu di laut yang tidak terdapat lamun (perairan dalam) dengan laut yang terdapat lamun (perairan dangkal), terlihat bahwa kandungan oksigen DO lebih tinggi pada perairan dalam berbanding terbalik dengan CO2 air yang lebih rendah daripada perairan dangkal. Pada perairan dangkal baik kandungan CO2 air maupun DIC (Dissolve Inorganic Carbon) lebih tinggi dibandingkan dengan perairan dalam. Hal tersebut dikarenakan pada perairan dangkal terdapat lamun yang memanfaatkan karbon dioksida untuk melakukan fotosintesis
Tabel. Sistem Karbonat dan Kualitas Perairan
St. pH Suhu (°C) Salinitas (o/oo)
DO
(mg/L) CO2 air (mg/L) CO2 atm (ppm) (µmol/kg) TA (µmol/kg) DIC Fosfat (mg/l) Laut yang tidak terdapat lamun (per.dalam) di bagian barat Karimunjawa
M1 2 6 2 6 2 66 2 M2 6 2 2 6 2 2 M3 2 2 6 2 6 2 M4 2 6 2 2 2 M5 6 2 2 M6 6 2 M7 2 2 M8 6 2 6 66 2 2 6
Laut yang terdapat lamun (per.dangkal) di bagian barat Karimunjawa
L1 2 2 6 2 22 2 6 2 L2 2 2 2 2 6 L3 6 2 2 2 2 L4 2 2 6 2 L5 2 2 2 22 2 L6 6 2 2 6 2 2 L7 2 2 2 2 6 2 L8 2 6 6 6 2 2 6 2 2
TA mahasiswa mengkaji Estimasi Serapan Karbon Lamun di Pulau Menjangan Besar dan Pantai Pokemon
Gambar. Lokasi Penelitian Pantai Pokemon Tabel Kualitas Air di Perairan P. Menjangan Besar dan Pantai Pokemon yang terdapat Ekosistem Lamun
Stasiun/Line Suhu( C) Salinitas(‰ pH DO(mg/l) CO(mg/l) Intensitas Cahaya(Lux)
Pulau Menjangan Besar
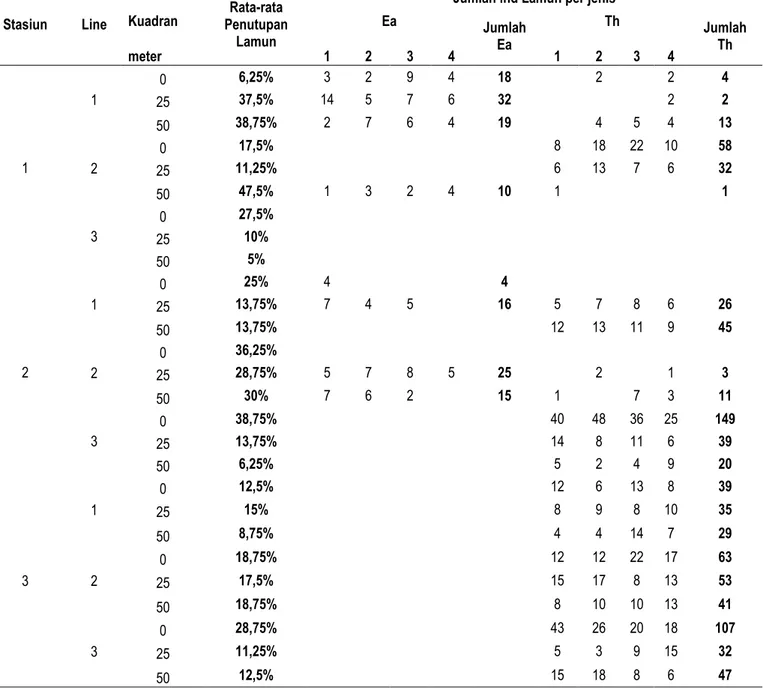
2 6 2 2 6 6 2 2 6 6 2 2 6 2 2 2 2 2 2 2 6 2 6 2 2 6 2 2 2 6 6 2 Pantai Pokemon 2 2 6 . 2 2 2 2 6 . 2 2 6 2 . 2 2 6 6 2.2 2 2 2 6 .6 2 2 6 2 . 2 6 . 2 2 2 2 . 2 6 .
Tabel Data Lamun Pulau Menjangan Besar
Transek Jumlah ind Lamun per jenis
Line Kuadran
Rata-rata Persentase
Lamun Ea
Jumlah
Ea (ind) Th Th (ind) Jumlah
2 2 St 1 2 2 2 2 - 2 2 6 2 6 2 2 2 6 2 6 2 2 2 2 6 - 2 2 2
St 2 2 2 2 2 2 2 6 2 2 2 2 2 2 2 2 6 2 2 2 2 2 2 2 2 St 3 2 2 2 22 2 2 2 2 2 2 2 2 Lanjutan Tabel Data Lamun Pulau Menjangan Besar Transek Jumlah ind Lamun per jenis Line Kuadran Rata-rata Persentase Lamun Ho Jumlah Ho (ind) Cr Jumlah Cr (ind) 2 2 St 1 2 2 2 - 6 2 6 2 2 2 2 2 2 2 2 2 St 2 2 2 2 2 2 6 2 2 2 2 2 2 2 2 2 2 2 6 2 2 2 St 3 22 2 2 2
Tabel Data Lamun Pantai Pokemon
Stasiun Line
Rata-rata
Penutupan Lamun
Jumlah ind Lamun per jenis
Kuadran Ea Jumlah Ea Th Jumlah Th meter 2 2 2 2 6 2 2 6 2 22 2 6 6 2 2 2 2 6 2 2 2 2 6 2 6 2 2 6 2 2 6 2 2 2 2 22 2 26 2 2 6
Lanjutan Tabel Data Lamun Pantai Pokemon
22 2 2 2 2 2 2 2 6 2 2 2 2 2 2
Stasiun Line
Rata-rata
Penutupan Lamun
Jumlah ind Lamun per jenis
Kuadran Cr Jumlah Cr Ho Jumlah Ho meter 2 2 2 6 2 2 2 2 22 2 2 6 2 2 2 2 2 2 6 2 2 6 2 2 2 2 6 6 6 2 2 2 6
D. STATUS LUARAN: Tuliskan jenis, identitas dan status ketercapaian setiap luaran wajib dan luaran tambahan (jika ada) yang dijanjikan pada tahun pelaksanaan penelitian. Jenis luaran dapat berupa publikasi, perolehan kekayaan intelektual, hasil pengujian atau luaran lainnya yang telah dijanjikan pada proposal. Uraian status luaran harus didukung dengan bukti kemajuan ketercapaian luaran sesuai dengan luaran yang dijanjikan. Lengkapi isian jenis luaran yang dijanjikan serta mengunggah bukti dokumen ketercapaian luaran wajib dan luaran tambahan melalui Simlitabmas mengikuti format sebagaimana terlihat pada bagian isian luaran
Luaran Wajib:
Draf Artikel Jurnal Internasional Terindeks SCOPUS
The Partial Pressure of CO2 and Sea-Air CO2 Fluxes in Ecosystem Seagrass and Non-Seagrass in the Waters of Karimunjawa Island in South East Monsoon 2020
Suryanti, Nurul Latifah, Sigit Febrianto, Churun Ain, Andreas Nur Hidayat
Dept. of Aquatic Resources, Faculty of Fisheries and Marine Sciences, Universitas Diponegoro
2Fish and marine resource management laboratory, Faculty of Fisheries and Marine Sciences, Universitas Diponegoro Email: [email protected]
ABSTRACT
The ocean has an important role to be the largest absorber of atropogenic CO2, in addition to the ocean, coastal ecosystems have also been identified as the main carbon source. In the sea CO2 will change its form to free aqueous CO2, bicarbonate ions HCO -, and carbonate CO 2-. The difference in the partial pressure of CO2 in seawater and the atmosphere determines the direction of the flow of CO2 gas between the sea and the atmosphere and will determine the value of the CO2 flux. The purpose of this study was to determine the distribution of CO2 flux in Ecosystem Seagrass and Non-Seagrass in the Waters of Karimunjawa Island in South East Monsoon 2020. The variables in this study were temperature; pH; salinity; DO; CO2 atm was measured using a CO2 meter; chlorophyll-a, phosphate, silicate were measured spectrophotometric method. Carbon seagrass was measured Loss On Ignition (LOI) method. Total Alkalinity / TA was measured using the titration method with the principle of changing pH; DIC (Dissolved Inorganic Carbon) was measured using CO2sys software. The calculation of the estimated CO2 flux using the formula:Flux CO2 = Kh x kwa x (∆pCO2).
INTRODUCTION
Naturally, the earth's surface consists of land, water, will absorb carbon dioxide gas in the atmosphere, but the rate of emission of CO2 release into the atmosphere is greater than natural absorption with the result that increasing concentration of CO2 in the atmosphere every year. The concentration of carbon dioxide in the atmosphere before the industrial revolution was 280 µatm and in 2005 380 µatm (Turley and Findlay 2 . This is supported by observations from NOAA-ESRL that from 2000; 2010 and 2018 there was an increase in CO2 in the atmosphere, respectively 369.55 ppm; 389.90 ppm; and 409.68 ppm (Jackson et al. 2018). Increased CO2 in the atmosphere is also influenced by human activities that are not environmentally friendly such as burning fossil fuels (petroleum, coal), deforestation, conversion of forests into settlements or ponds, and so on. These activities can increase greenhouse gases in the atmosphere. Greenhouse gases consisting of carbon dioxide (CO2), methane (CH ), di nitroxide (N2O), methane (CH ), sulfur Hexa Flouride (SF6), perfluorocarbons (PFCs), and hydrofluorocarbons (HFCs) with the largest gas composition in the atmosphere namely carbon gas dioxide (CO2) by 75% of the total gases in the atmosphere (Darussalam, 2011). Increasing greenhouse gases in the atmosphere will have an impact on sunlight that cannot be transmitted outside the surface of the earth causing the temperature on the earth to get hotter (global warming). Human activities are estimated to have caused global warming of - 2 oC above pre-industrial levels (Hoegh-Guldberg O. et al. 2018).
The increase in the earth's temperature because global warming will be an impact on climate change and rising temperatures in the marine ecosystem (Pachauri 2014). Besides the increase in temperature, there is an increase in CO2 in the ocean because there is a lot of CO2 gas in the atmosphere. Increased carbon dioxide CO2 in the ocean will trigger a decrease in oxygen vertically and horizontally until hypoxia-anoxia occurs ((Oschlies et al. 2008) and (Engel et al. 2 ) Hypoxia-anoxia conditions in Indonesian waters especially in coastal areas can trigger the occurrence of toxic algal blooms, fish mortality, changes in stratification, reduction in the diversity of aquatic biota, decreased production of fish catches. Besides that, the increase of organic and inorganic carbon in the sea can stimulate the growth of phytoplankton which will utilize inorganic carbon through photosynthesis into dissolved inorganic carbon (Oschlies et al. 2008). An understanding of the existence of carbon systems in the ocean is very important to estimate atmospheric CO2 concentrations in the future as well as the rate of global warming, especially in the context of changes in ocean circulation (Oschlies et al. 2008).
The oceans absorb atmospheric CO2 through a transfer process called a solubility pump which functions as a solubility gas in seawater. Penurunan gas CO2 antropogenik di atmosfer dilakukan oleh tumbuhan darat yang dapat menyerap CO2 untuk proses fotosintesis kemudian disimpan dalam bentuk biomassa atau disebut dengan the carbon sequestration (Akhand et al. 2021). Selain tumbuhan darat, vegetasi pantai dan lautan juga dapat melakukan pengurangan CO2 atropogenik melalui proses fotosintesis yang dilakukan oleh mangroves, meadows, seagrass, phytoplankton algae sequester and store „blue carbon‟ in their biomass and deposit it in the sedimen (Gulliver et al, 2020; Su et al., 2020; (Akhand et al. 2021)). The flow of carbon dioxide from atmosphere to the sea surface, the carbon dioxide on the surface sequester and stored to the sediment through the biological pumping and physical/solubility pump). Physical pumping that transfer surface water and suspended and dissolved organic matter to depth.. Biological pumping can transfer carbon dioxide from the surface to the bottom of the ocean. The phytoplankton takes place as primary production use DIC (dissolve inorganic carbon) consisting of CO2(aq), H2CO3, HCO3- and CO32- (Cavan et al. 2019); (Jin, Hoagland, and Buesseler 2020).
In the sea, CO2 will change its form to free aqueous CO2, bicarbonate (HCO -), and carbonate (CO 2-). The difference in the partial pressure of CO2 in seawater and the atmosphere determines the direction of the flow of CO2 gas between the ocean and the atmosphere. Thus the direction of CO2 flux is controlled mainly by changes in ocean pCO2 (Zeebe 2012). The partial pressure of CO2 in seawater is determined by sea surface temperature and biological processes in the sea such as photosynthesis, so that the two parameters can determine between the sink CO2 and source CO2 (Feely et al. 2001). Research has been conducted to determine the distribution of CO2 flux, the results of the study concluded that the high latitude sea which has 4 seasons and relatively cold temperatures has a function as a sink CO2 ((Takahashi et al. 1997); (Takahashi et al. 2 2 ; (Cai, Dai, and Wang 2006); (Yasunaka et al. 2016); (Arnone, González-Dávila, and Magdalena Santana-Casiano 2017); (Ito et al. 2018)), whereas at low latitudes it has a function as a source CO2 due to warm waters ((Fitranti et al. 2013); (Kartadikaria et al. 2015); (Afdal 2016); (Yan et al. 2018); (Wirasatriya et al. 2020)), however, in several studies, the waters in Indonesia can function as a sink CO2 (Fachri et al. 2015) (Latifah,
Endrawati, and Febrianto 2019). The investigation of CO2 flux in the Java Sea has been conducted by Wirasatriya et al (2020) by using remote sensing approach. They show that Java Sea during May 2016 – February 2017 in mainly acts as carbon source. However, due to the limitation of the spatial resolution of the used satellite data, Karimunjawa area were left blank. In the present study we use field observation to reveal the CO2 flux in the Sea around Karimunjawa Island. Therefore, the purpose of this study was to determine the distribution of CO2 flux in Ecosystem Seagrass and Non-Seagrass in the Waters of Karimunjawa Island in South East Monsoon 2020
2. MATERIALS AND METHODS
2 Study Area
We used a site on the waters that have a seagrass ecosystem (9 station) and non seagrass (6 station) (Figure 1). The research was conducted in August 2020 when the south east monsoon, where the wind blows from the Australian continent to the Asian Continent. At that time, in Indonesia including Karimunjawa there was a dry season.
Figure 1. Map of Study Site
Sample collection
Field data collection was conducted 27 August 2020 (9 statoin), 28 August 2020 (3 station), and 29 August 2020 (3 station) (Table 1).. Sampel yang dimabil berupa sampel air laut yang terletak di permukaan. Pengambilan sampel air laut menggunakan alat Nansan Water Sampler. Sampel yang telah di ambil dimasukkan ke dalam botol kaca 250 ml kemudian diberikan 1 tetes HgCl2 sebagai pengawet. Setelah itu, sampel dimasukkan ke dalam cool bon untuk dianalisis DIC (Dissolved Inorganic Carbon ) dan TA (Total Alkalinity). Selain itu sampel air yang telah diambil dimasukkan juga ke dalam botol 1,5 l untuk uji klorofil-a dan botol 600 ml untuk uji nitrat dan fosfat.
Pengukuran parameter lainnya (suhu, pH, salinitas) menggunakan alat DO meter dan pH meter. CO2 atmosfer menggunakan alat CO2 meter dan CO2 menggunakan metode titrimetri.
Table 1. St. Information Pantai Bobi Seagrass 2 2 Pantai Alang-Alang 2 2 2
Pantai dekat P.Mrican 2 K1 Barat P. Karimun Non Seagrass K2 K3 K4 Timur P. Karimun K5
K6
Khusus untuk stasiun 1, 2 dan 3 yang merupakan ekosistem lamun dilakukan pengukuran kerapatan, dan estimasi karbon pada jaringan lamun. Oleh karena itu pada ketiga stasiun tersebut dipasang 3 line transek, dan tiap line transek terdapat 3 kuadran transek dengan ukuran 50 x 50 cm. Pengukuran kerapatan dilakukan dilapangan dengan bantuan buku dari seagrass-watch (McKenzie, Cabell, and Roder 2003); (Afiati et al. 2 . Sedangkan estimasi karbon pada lamun dengan mengambil/mencuplik lamun yang dominan yang terdapat pada kuadran transek. Setelah itu lamun dibersihkan dan dimasukkan ke dalam plastic zipper dan cool box yang telah berisi es.
Estimation of the partial pressure of CO2
Seawater CO2 partial pressure was calculated using a formula (Andrew G. Dickson, Sabine, and Christian 2007) : fCO2 = [CO2] / Ko
pCO2 sea (µatm) = fCO2 (µatm) * [1,00436 – 66 - *SST(oC)] where [CO2] adalah konsentrasi CO2 air laut ; Ko adalah CO2 solubility air laut
The partial pressure of atmospheric CO2 can be calculated using a formula (A G Dickson, Sabine, and Christian 2007); (Zhu et al. 2009); (Kartadikaria et al. 2015):
pCO2atm = xCO2atm (pb - pH2O)
where pb = air pressure (atm); xCO2atm (ppm) is the molar fraction of CO2 air in the troposphere obtained from tropospheric mole fraction of CO2 https://disc.gsfc.nasa.gov/datasets/AIRX3C2M_V005/summary, pH2O is the water vapor pressure at the air boundary and observing the sea obtained from (Ray F. Weiss et al. 1980):
pH2O = exp (24.4543 – 6 4509 x (100/Tk)) – 89 x ln (Tk / 100) – 0.000544 x S where: T is sea surface temperature (Kelvin); S is sea surface salinity (‰).
Estimation of the sea-air CO2 Flux
Calculation of CO2 flux or CO2 gas flow exchange is calculated using a formula (Takahashi et al. 2002); (Du et al. 2015); (Fachri et al. 2015); (Kartadikaria et al. 2015); (Takahashi and Sutherland 2017); (Yan et al. 2018); (Wirasatriya et al. 2020):
Flux CO2 = Kh x kwa x (∆pCO2) ∆pCO2 = pCO2sea – pCO2atm
Where: Flux CO2 is a carbon dioxide flux (mmol/m2/day); Kh = solubility of CO2 in mol/l/atm; kwa = CO2 gas transfer velocity in m/s; ∆pCO2 sea+atm = the partial pressure difference of CO2 in the seawater and the atmosphere.
Berdasarkan rumus di atas apabila Fluks CO2bernilai positif maka suatu perairan berperan sebagai pelepas (source) CO2 sebaliknya jika bernilai negatif maka perairan berperan sebagai penyerap (sink) CO2 ().
Calculate Kh solubility of CO2 is derived from (R. F. Weiss 1974); (Wirasatriya et al. 2020):
Ln Kh = -58.0931 + 90.5069/(Tk/100) +22.2940 x ln(Tk/100) + S x (0.02776 – 0.02588 x (Tk/100) + 0.0050578 x (Tk/100)2) Where Tk is sea surface temperature (Kelvin) and S is sea surface salinity (‰).
Calculate the kwa value using the WM99 formula to parameterize the gas transfer rate ((Zhu et al. 2009); (Robbins et al. 2010); (Kartadikaria et al. 2 ):
kwa = f x U 2 x (Sc/660)- 2
Where K is in cm/day; U is the wind speed at an altitude of 10 m (m/s); U data is obtained from the ECMWF website (European Centre for Medium-Range Weather Forecasts) https://apps.ecmwf.int/datasets/data/interim-full-daily/; f is the proportional coefficient, when the average wind speed is long-term, the value is f = 0.39 and if the wind speed is instantaneous the value is f = 0.31.
Sc is a dimensionless Schmidt number calculated from (Wanninkhof, 1992):
Sc = 2073.1 – 125.62 T + 3.628 T2 – 2 T
Where: Sc = Schmidt number (Schmidt number) radon gas CO2 seawater and T is sea surface temperature (oC).
Estimation Simpanan Karbon pada Jaringan Lamun
Perhitungan nilai kandungan karbon lamun berdasarkan jaringan (daun, rhizoma dan akar) dianalisis dengan menggunakan metode pengabuan atau Loss On Ignition (LOI) Method . Perhitungan kandungan karbon dengan rumus :
Kandungan Karbon =
Menurut menjelaskan bahwa total stok karbon lamun dihitung dengan menggunakan rumus yang sebagai berikut: Ct = ∑ (Li x Ci
dimana: Ct = karbon total (ton) ; Li = luas padang lamun kategori kelas ke-i (m2) ; Ci = rata-rata stok karbon lamun kategori kelas ke-i (gC/m2)
Statistical analyses
Results
Physico-Chemical, Carbonat System
Pada Tabel 1 di atas terlihat bahwa semakin kecil HCO3- maka pH akan mengalami meningkat, sebaliknya semakin besar kandungan HCO3- dalam perairan maka pH semakin menurun. Hal tersebut dikarenakan terjadinya perubahan komposisi organisme pada perairan yang memanfaatkan bikarbonat (HCO3-) yaitu fitoplakton. Kelimpahan fitoplankton dalam hal ini diwakilkan oleh kandungan klorofil-a pada perairan,
dimana klorofil-a semakin meningkat yang dimungkinkan melimpahnya kelimpahan fitoplankton sehingga konsumsi bikarbonat HCO3- untuk fotosintesis semakin banyak mengakibatkan HCO3- dalam perairan semakin rendah dan akan mengurangi jumlah ion H+ dan meningkan pH. Menurut Williams and Follows (2011) dan Millero (2013) bahwa penurunan pH disebabkan karena terjadi peningkatan pemanfaatan HCO3- dan akan mengurangi jumlah ion H+ dan meningkatkan pH.
Di perairan alami, sistem karbon anorganik dapat didefinisikan oleh empat parameter yaitu total terlarut CO2 anorganik (DIC), alkalinitas total (TA), pH dan fugacity CO2 (fCO2) (Waters, 2012; Afdal, 2016 Gas CO2 di udara ditransfer ke laut dan berubah bentuk menjadi dissolved inorganik carbon (DIC) yaitu karbondioksida air (CO2(aq)), asam karbonat (H2CO ), bikarbonat (HCO -) dan karbonat (CO 2-).
Stasiun Suhu (oC) pH Salinitas Klorofil-a (mg/m3) Nitrat (mg/l) Fosfat (mg/l) CO2 air
2 2 2 266 2 2 2 6 662 2 2 6 2 2 2 6 2 2 2 2 2 266 2 2 2 2 2 6 2 2 2 2 6 6 2 2 2 6 6 2 2 2 2 2 2 6 2 2 2 6 K1 2 2 6 K2 2 6 2 K3 2 6 2 2 6 K4 2 6 2 2 K5 6 2 2 2 2 K6 2 2 2 2
Changes in seawater pH will cause changes in the composition if carbon dioxide in the water. According to (Effendi 2003); (National Research Council 2010) states that the composition of carbon dioxide in waters with a normal pH of 7-8 will be dominated by bicarbonate ions (HCO -), acidic pH will be dominated by carbon dioxide ions (CO2) and in alkaline conditions will be dominated by carbonate ions (CO 2). The theory was the same as the results in this study where the composition of carbon dioxide can be seen from the analysis of DIC (Dissolved Inorganic Carbon) which is the sum of HCO -, CO 2- and CO2. DIC (Dissolved Inorganic Carbon) is the addition of CO2 dissolved in water. Carbon dioxide in water was present in several forms, carbon dioxide free (CO2 (aq)); carbonic acid ions (H2CO ); bicarbonate ion (HCO -) and carbonate ion (CO 2-) which form some equilibrium:
CO2(gas) CO2(aq) (free carbon dioxide) CO2 + H2O H2CO (carbonic acid) H2CO H+ + HCO - (bicarbonate) HCO - CO 2- + H+ (carbonate)
Alkalinity is the capacity of water to neutralize acids, as a buffering capacity against changes in water pH. According to (Gerardi 2003), total alkalinity is the amount of acid needed to lower the pH to a point where all carbonate (CO -) and bicarbonate (HCO -) can be converted into carbonic acid (H2CO ). High alkalinity has a good buffer system. Total alkalinity is the amount of acid needed to lower the pH of the sample water to a point where all carbonates and bicarbonates turn into carbonic acid (Yang, Byrne, and Lindemuth 2015).
Partial Pressure of CO
Tekanan parsial karbon dioksida (pCO2) salah satunya dipengaruhi oleh suhu perairan. Jika dilihat pada Tabel 1 dan 2 pCO2 air berkurang dengan semakin menurunnya suhu perairan. Menurut Lakshmi (2013), menyatakan bahwa perairan laut hangat umumnya pada lintang rendah akan mengurangi kelarutan CO2 sehingga menyebabkan efek peningkatan pCO2 air laut, sebaliknya. Penelitian-penelitian lainnya seperti Yasunaka et al. (2016), Arnone et al. (2 Ito et al. (2 menghasilkan bahwa suhu perairan yang relatif dingin akan menguragi pCO2 air laut sehingga laut cenderung berperan sebagai sink CO2. Tekanan parsial karbon dioksida (pCO2) dan produktivitas primer yang ada di lautan merupakan kunci penting dalam mekanisme pompa biologi (Ono et al. 2
The results of the partial pressure of carbon dioxide and CO2 flux at 15 stations were different. The difference in CO2 flux and partial pressure of CO2 in each water is due to the interaction of the oceans and the atmosphere in each water, because the earth rotates and evolves with respect to the sun and moon. The form of interaction between the oceans and the atmosphere is the atmosphere will transfer gases including carbon dioxide gas and transfer rainfall to the waters, while the oceans will transfer water vapor and return the gases back to the atmosphere. This interaction causes differences in carbonate systems in the sea, differences in the partial pressure of carbon dioxide and CO2 flux spatially ((Song et al. 2016); (Yasunaka et al. 2016)).
Flux CO
During the south east monsoon 2020, the waters of Karimunjawa act as a source of CO2, meaning that the partial pressure of sea CO2 is higher than the partial pressure of atmospheric CO2so that the transfer of gases including carbon dioxide gas from the oceans is returned to the atmosphere. The results of this study are the same as previous research by (Wirasatriya et al. 2020)in the Java Sea during the summer monsoon 2 that the Java Sea acts as a source of CO2 where the CO2 flux value is more than 10 mmol/m2/day. The seawater pCO2 depends on the dissolved inorganic carbon (DIC), the temperature dan the pH of seawater (Takahashi and Sutherland 2017). According to the research results of (Kartadikaria et al. 2015), showed that temperature has a limited effect in controlling the CO2 sink or the source of CO2. It added that the change in sea surface temperature during La Nina effectively reduced the pCO2 difference between the oceans and the atmosphere by 50% compared to a normal year.
ΔpCO2 was influenced by phytoplankton, the abundance of different phytoplankton in the waters will cause a difference in the partial pressure of ocean carbon dioxide. According to (Moreau et al. 2013)and (Takao et al. 2020) there was a significant negative correlation between chlorophyll-a and ΔpCO2 concentrations at stations that were dominated by diatomic phytoplankton, but not at stations dominated by phytoflagellates. In this study, the phytoplankton variable was approached using the chlorophyll-a variable, the results showed that the relationship between chlorophyll-a, and ΔpCO2 was very strong correlation with a value of 0.8133 using polynomial regression (Figure 9).
Result study of (Takao et al. 2020) shows that ΔpCO2 has a strong correlation with productivity primary. In this study, productivity primary was approached using chlorophyll-a, phosphate and silicate variables (Figure 10). Increased nutrients can increase phytoplankton growth, increase chlorophyll-a concentration and increase the consumption of carbon dioxide by phytoplankton for photosynthesis so that it can change the partial pressure of carbon dioxide to low. pCO2sea is also influenced by sea water temperature where the higher the sea water temperature will make it difficult for CO2 to dissolve in water so that it will be released into the atmosphere and cause high pCO2sea.
Non-Seagrass Seagrass
Non-Seagrass Seagrass
Carbon Seagrass
Pada Tabel 1., tersaji kerapatan Lamun pada Pantai Bobi. Pada tabel tersebut terlihat bahwa jenis Cymodocea rotundata (Cr) yang mendominasi dan melimpah, selain jenis Cr terdapat juga jenis Th dan Ho yang banyak, sedangkan jenis Ea dan Cs tidak ditemukan di pantai ini. Ada jenis menarik dan baru ditemukan di Pantai Bobi yang tidak ditemukan di pantai lainnya yaitu jenis Zc (Zostera capricorni) walaupun kelimpahannya hanya sedikit. Selain Cr mendominasi persebaran Cr juga merata dari line 0 m (pertama kali ditemukan lamun), line 25 m setelahnya sampai line 50 m.
Tabel . Kerapaan Lamun pada Pantai Bobi
No. Jenis Lamun Kerapatan Lamun (ind/m) Stasiun 1 Pantai Bobi
Line1 Line 2 Line 3
Enhalus acoroides Ea 2 Thalassia hemprichii Th 2 2 2 2 2 Cymodocea serrulata Cs Cymodocea rotundata Cr . Halophila ovalis Ho 2 6 2 6 6 6 Zostera capricorni Zc
Pada Tabel , tersaji kerapatan lamun di Pantai Alang-Alang. Pada Pantai Alang-Alang jenis lamun yang ditemukan cukup banyak dibandingkan pada Pantai Bobi, dimana pada Pantai Alang-Alang terdapat 5 jenis lamin yang ditemukan yaitu Ea, Th, Cs, Cr dan Ho. Kerapatan lamun yang paling banyak ditemukan pada Cs kemudian Th dan Ea, dan ditemukan paling sedikit jenis Cr dan Ho. Pada Pantai Alang-Alang jenis yang mendominasi Cs banyak ditemukan pada Line 3 dari line 0, 25 sampai 50 m. Hal ini dikarenakan pada line 3 jauh dari tempat bersandar atau berlabuh kapal. Sedangkan line 1 dan 2 digunakan untuk tempat berlabuh kapal,sehingga jenis Cs yang memiliki morfologi yang kecil tidak dapat tumbuh dengan baik. Walaupun begitu, Line 1 dan 2 didominasi oleh Ea yang memiliki morofologi dan perakaran yang kuat sehingga dapat bertahan.
No Jenis Lamun Kerapatan Lamun (ind/m2) Stasiun 2 Pantai Alang-Alang
Line1 Line 2 Line 3
Enhalus acoroides Ea 2 2 2 2 Thalassia hemprichii Th 6 2 Cymodocea serrulata Cs Cymodocea rotundata Cr 2 2 Halophila ovalis Ho Non-Seagrass
6 Zostera capricorni Zc
Pada Tabel , tersaji kerapatan lamun di Pantai dekat Pulau Mrican. Pada pantai ini jenis lamun yang ditemukan terdapat 4 jenis yaitu Cr, Th, Ea, dan Cs, dimana kerapatan tertingi ditemukan pada jenis Cymodocea rotundata (Cr) dan yang paling sedikit adalah Cs. Jenis Cr yang mendominasi sebagian besar ditemukan pada kuadran pertama 0 meter pada line 3 dan line 2, sedangkan pada line 1 ditemukan paling sedikit. Hal tersebut dikarenaka pada Line 1 dekat dengan tempat penyandaran kapal, sehingga dimungkinkan lamun jenis Cr rusak saat kapal berlalu-lalang, dengan morfologi Cr yang kecil. Jenis lamun yang mendominasi pada line 1 ini yait Ea dimungkinkan karena morfologi yang besar dan perakaran kuat, sehingga mampu bertahan. Pada Line 2 dan 3 jauh dari tempat bersandar kapal, sehingga lamun jenis Cr dapat tumbuh dengan baik.
No. Jenis Lamun Kerapatan Lamun (ind/m) Stasiun 3 Pantai dekat Pulau Mrican
Line1 Line 2 Line 3
Enhalus acoroides Ea 2 6 2 2 2 2 Thalassia hemprichii Th 2 6 2 2 Cymodocea serrulata Cs 6 2 Cymodocea rotundata Cr Halophila ovalis Ho 6 Zostera capricorni Zc
Pengukuran Karbon Lamun
Pengukuran karbon lamun belum selesai dilakukan dikarenakan keterbatasan alat tanur sehingga pemakaian alat tersebut harus bergantian dengan peneliti lainnya. Estimasi karbon lamun didekati dengan metode pengabuan Loss On Ignition (LOI) pada jaringan lamun atas (daun) dan Bawah (rhizome dan akar).
Pengukuran karbon lamun belum selesai dilakukan dikarenakan keterbatasan alat tanur sehingga pemakaian alat tersebut harus bergantian dengan peneliti lainnya. Estimasi karbon lamun didekati dengan metode pengabuan Loss On Ignition (LOI) pada jaringan lamun atas (daun) dan Bawah (rhizome dan akar). Pada Tabel 7 terlihat bahwa kandungan karbon lamun bawah substrat (rhizome dan akar) memiliki nilai yang lebih besar dibandingkan kandungan karbon lamun atas substrat (daun). Kandungan total karbon lamun pada stasiun 2 (19,625 gC/m2) lebih tinggi dibandingkan dengan stasiun 1 (16,076 gC/m2) dan stasiun 3 (8,966 gC/m2).
Tabel . Karbon pada Lamun
Stasiun Line Biomassa (kgC/m2) Konversi (gC/m2)
Total substrat Atas substrat Bawah substrat Atas substrat Bawah Total
66 2 22 2 2 2 6 2 2 2 2 2 2 2 6 6 26 62 2 2 6 6226 2 2 6 2 6 2 2 2 2 6 6 2 2 6 6 6 6 6 6 6 6 2 626 2 2 2 2 22 2 2 22 22 6 6 2 6 2 2 6 2 2 2 CONCLUSION
Results of study on CO2 flux in Karimunjawa waters during south east monsoon (represented by August 2020) showed that………… The partial pressure of sea CO2 is higher than the partial pressure of atmospheric CO2 so the role of Karimunjawa waters as a source of CO2 where there is release of carbon dioxide into the atmosphere with CO2 flux values ranging …… mmol m2/day. The variables that affect the flux of CO2 in this study were the pCO2sea and ΔpCO2 with a very strong and positive correlation. Where both were influenced by sea water temperature, salinity, chlorophyll-a, phosphate and silicate. ………
ACKNOWLEDGMENTS
This work was partially funded by Directorate General of research and development, the Ministry of Research, Technology and Higher Education, Republic Indonesia (grant agreement number: 225-65/UN7.6.1/PP/2020) with research scheme was Fundamaental Research. The research team also thankful for the Balai Taman Nasional Karimunjawa, Indonesia, and all those who helped with this research.
Afdal Afdal 2 6 “Fluks CO2 Di Perairan Pesisir Pulau Lombok Nusa Tenggara Barat CO2 Flux in the Coastal Waters of Lombok, West Nusa Tenggara ” Oseanografi Dan Limnologi Di Indonesia 1 (2): 91–
Afiati, Restu Nur, Agustin Rustam, Terry L Kepel, Nasir Sudirman, Mariska Astrid, August Daulat, Dwiyanti Suryono, et al. 201 “Karbon Stok Dan Struktur Komunitas Mangrove Sebagai ” no. Station 1.
Akhand, Anirban, Kenta Watanabe, Abhra Chanda, Tatsuki Tokoro, Kunal Chakraborty, Hirotada Moki, Toko Tanaya, Jayashree Ghosh, and Tomohiro Kuwae 2 2 “Lateral Carbon Fluxes and CO2 Evasion from a Subtropical Mangrove-Seagrass-Coral Continuum ” Science of the Total Environment 752: 142190. https://doi.org/10.1016/j.scitotenv.2020.142190.
Arnone, Verónica, Melchor González-Dávila, and J. Magdalena Santana-Casiano 2 “CO2fluxes in the South African Coastal Region ” Marine Chemistry 195 (December 2016): 41–49. https://doi.org/10.1016/j.marchem.2017.07.008.
Cai Wei Jun Minhan Dai and Yongchen Wang 2 6 “Air-Sea Exchange of Carbon Dioxide in Ocean Margins: A Province-Based Synthesis ” Geophysical Research Letters 33 (12): 2–5. https://doi.org/10.1029/2006GL026219.
Cavan, E. L., E. C. Laurenceau-Cornec M Bressac and P W Boyd 2 “Exploring the Ecology of the Mesopelagic Biological Pump ” Progress in Oceanography 176 (May): 102125. https://doi.org/10.1016/j.pocean.2019.102125.
Dickson, A G, C. L. Sabine, and J. R. Christian. 2007. Citation Instructions. Guide Tp Best Practices for Ocean CO2 Measurements. PICES Special Publication. Vol. 3.
Dickson, Andrew G., Christopher L. Sabine, and James R. Christian. 2007. Guide to Best Practices for Ocean CO 2 Measurements.
Du Zhenhong Lei Fang Yan Bai Feng Zhang and Renyi Liu 2 “Spatio-Temporal Visualization of Air-Sea CO 2 Flux and Carbon Budget Using Volume Rendering ” Computers and Geosciences 77: 77–86. https://doi.org/10.1016/j.cageo.2015.01.004.
Effendi Hefni 2 “Telaah Kualitas Air: Bagi Pengelolaan Sumber Daya Dan Lingkungan Perairan ” Yogyakarta: Kanisius https://doi.org/ISBN - -2 - 6 -
Engel, Anja, Judith Piontek, Hans Peter Grossart, Ulf Riebesell, Kai G. Schulz, and Martin Sperling 2 “Impact of CO2 Enrichment on Organic Matter Dynamics during Nutrient Induced Coastal Phytoplankton Blooms ” Journal of Plankton Research 36 (3): 641–57. https://doi.org/10.1093/plankt/fbt125.
Fachri, Faridz R., Afdal, A. Sartimbul and N Hidayati 2 “Fluks Co2 Di Perairan Pesisir Timur Pulau Bintan Propinsi Kepulauan Riau ” Jurnal Segara 11 (1): 57–66
Feely R A C L Sabine T Takahashi and R Wanninkhof 2 “Uptake and Storage of Carbon Dioxide in the Ocean ” Oceanography ( : Fitranti, Bandari Arining, Donny Juliandri, Bambang Herunadi, Potensi Pelepasan, D A N Penyerap, C O Kaitannya, Dengan Suhu, Salinitas Di, and
Perairan Teluk 2 “Potensi Pelepasan Dan Penyerap Co2 Kaitannya Dengan Suhu Dan Salinitas Di Perairan Teluk Banten” 2: – 2 Gerardi Michael H 2 “Alkalinity and PH ” The Microbiology of Anaerobic Digesters, 99–103. https://doi.org/10.1002/0471468967.ch16.
Hoegh-Guldberg O., Jacob D., Taylor M., Bindi M., Brown S., Camilloni I., Diedhiou A., and Djalante R 2 “Chapter : Impacts of °C Global Warming on Natural and Human Systems. In: Global Warming of 1.5 °C. An IPCC Special Report on the Impacts of Global Warming of 1.5 °C above Preindustrial Levels and Related Global Greenhouse Gas Emission Pathways [ ] ” Special Report, Intergovernmental Panel on Climate Change, no. ISBN 978-92-9169-151-7: 175–
Ito Rosane Gonçalves Virginia Maria Tavano Carlos Rafael Borges Mendes and Carlos Alberto Eiras Garcia 2 “Sea-Air CO2 Fluxes and PCO2 Variability in the Northern Antarctic Peninsula during Three Summer Periods (2008–2 ” Deep-Sea Research Part II: Topical Studies in Oceanography 149 (September 2017): 84–98. https://doi.org/10.1016/j.dsr2.2017.09.004.
Jackson, R. B., C. Le Quéré R M Andrew J G Canadell J I Korsbakken Z Liu G P Peters and B Zheng 2 “Global Energy Growth Is Outpacing Decarbonization ” Environmental Research Letters 13 (12). https://doi.org/10.1088/1748-9326/aaf303.
Jin, Di, Porter Hoagland, and Ken O Buesseler 2 2 “The Value of Scientific Research on the Ocean‟s Biological Carbon Pump ” Science of the Total Environment 749: 141357. https://doi.org/10.1016/j.scitotenv.2020.141357.
Kartadikaria, A. R., A. Watanabe, K. Nadaoka, N. S. Adi, H. B. Prayitno S Soemorumekso M Muchtar et al 2 “CO2 Sink Source Characteristics in the Tropical Indonesian Seas ” Journal of Geophysical Research: Oceans 120 (12): 7842–56. https://doi.org/10.1002/2015JC010925.
Latifah, Nurul, Hadi Endrawati, and Sigit Febrianto 2 “Distribusi Spasial Fluks Karbon Dioksida Di Perairan Karimunjawa Indonesia ” Jurnal Ilmu Dan Teknologi Kelautan Tropis 11 (2): 357–68. https://doi.org/10.29244/jitkt.v11i2.23692.
McKenzie, L J, S J Cabell, and C A Roder. 2003. Seagrass-Watch: Manual for Mapping Ans Monitoring Seagrass Ressources by Community Volunteers - 2ed Edition.
Moreau Sébastien Irene R Schloss Gastón O Almandoz José L Esteves Flavio E Paparazzo and Gustavo A Ferreyra 2 “Deep-Sea Research I The Role of Phytoplankton Composition and Microbial Community Metabolism in Sea – Air Δ PCO 2 Variation in the Weddell Sea ” Deep-Sea Research Part I 82: 44–59. https://doi.org/10.1016/j.dsr.2013.07.010.
National Research Council. 2010. Ocean Acidification: A National Strategy to Meet the Challenges of a Changing Ocean. Ocean Acidification: A National Strategy to Meet the Challenges of a Changing Ocean. Washington, DC: The National Academic Press. https://doi.org/10.17226/12904.
Oschlies, Andreas, Kai G. Schulz, Ulf Riebesell and Andreas Schmittner 2 “Simulated 2 st Century‟s Increase in Oceanic Suboxia by CO 2-Enhanced Biotic Carbon Export ” Global Biogeochemical Cycles 22 (4): 1–10. https://doi.org/10.1029/2007GB003147.
Pachauri Rajendra K 2 “Climate Change 2 Synthesis Report Summary Chapter for Policymakers ” Ipcc, 31. https://doi.org/10.1017/CBO9781107415324.
Robbins L L M E Hansen J A Kleypas and S C Meylan 2 “CO2calc: A User Friendly Carbon Calculator Foe Windows Mac OS X and IOS (IPhone ” United States Geological Survey 1280: 1210–80. https://doi.org/10.3133/OFR20101280.
Song Xuelian Yan Bai Wei Jun Cai Chen Tung Arthur Chen Delu Pan Xianqiang He and Qiankun Zhu 2 6 “Remote Sensing of Sea Surface PCO2 in the Bering Sea in Summer Based on a Mechanistic Semi-Analytical Algorithm (MeSAA ” Remote Sensing 8 (7): 1–25. https://doi.org/10.3390/rs8070558.
Takahashi, Taro, Richard A Feely, Ray F Weiss, Rik H Wanninkhofs, David W Chipman, Stewart C Sutherland, and Timothy T Takahashi. 1997. “Global Air-Sea Flux of CO 2 : An Estimate Based on Measurements of Sea – Air PCO 2 Difference ” Proc. Natl. Acad. Sci. USA 94 (August):
8292–
Takahashi Taro and Stewart C Sutherland 2 “GLOBAL OCEAN SURFACE WATER PARTIAL PRESSURE OF CO2 DATABASE: MEASUREMENTS PERFORMED DURING 1957–2 6 (Version 2 6 ” NOAA/NCEI/OCADS 4 (Version 2016): 1–16. https://doaj.org/article/f820bd6e28cf44988e96d72e946a06ff.
Takahashi, Taro, Stewart C. Sutherland, Colm Sweeney, Alain Poisson, Nicolas Metzl, Bronte Tilbrook, Nicolas Bates, et al. 20 2 “Global Sea-Air CO2 Flux Based on Climatological Surface Ocean PCO2 and Seasonal Biological and Temperature Effects ” Deep-Sea Research Part II: Topical Studies in Oceanography 49 (9–10): 1601–22. https://doi.org/10.1016/S0967- 6 ( 2 -6
Takao, Shintaro, Shin-ichiro Nakaoka Fuminori Hashihama and Keishi Shimada 2 2 “Deep-Sea Research Part I Effects of Phytoplankton Community Composition and Productivity on Sea Surface p CO 2 Variations in the Southern Ocean ” Deep-Sea Research Part I 160 (September 2019): 103263. https://doi.org/10.1016/j.dsr.2020.103263.
Turley Carol and Helen S Findlay 2 “Ocean Acidification ” In Climate Change: Observed Impacts on Planet Earth: Second Edition. https://doi.org/10.1016/B978-0-444-63524-2.00018-X.
Weiss R F “Carbon Dioxide in Water and Seawater: The Solubility of a Non-Ideal Gas ” Marine Chemistry 2 (3): 203–15. https://doi.org/10.1016/0304- 2 ( -2
Weiss, Ray F., B. A. Price, Environment Canada, Philippe Rochette, Gordon L. Hutchinson, Susantha Jayasundara, and Claudia Wagner-Riddle. “N I T R O U S Oxide S O L U B I L I T Y in Water and Seawater ” Agricultural Systems 8 (47): 247–86. https://doi.org/10.1017/CBO9781107415324.004.
Wirasatriya, Anindya, Denny Nugroho Sugianto, Lilik Maslukah, Muhammad Faqih Ahkam, Sri Yulina Wulandari, and Muhammad Helmi. 2020. “Carbon Dioxide Flux in the Java Sea Estimated from Satellite Measurements ” Remote Sensing Applications: Society and Environment 20 (July): 100376. https://doi.org/10.1016/j.rsase.2020.100376.
Yan Hongqiang Kefu Yu Qi Shi Ziyun Lin Meixia Zhao Shichen Tao Guohui Liu and Huiling Zhang 2 “Air-Sea CO 2 Fluxes and Spatial Distribution of Seawater PCO 2 in Yongle Atoll, Northern-Central South China Sea ” Continental Shelf Research 165 (October 2017): 71–77. https://doi.org/10.1016/j.csr.2018.06.008.
Yang Bo Robert H Byrne and Michael Lindemuth 2 “Contributions of Organic Alkalinity to Total Alkalinity in Coastal Waters : A Spectrophotometric Approach.” Marine Chemistry 176: 199–207. https://doi.org/10.1016/j.marchem.2015.09.008.
Yasunaka, Sayaka, Akihiko Murata, Eiji Watanabe, Melissa Chierici, Agneta Fransson, Steven van Heuven, Mario Hoppema, et al. 2 6 “Mapping of the Air–Sea CO2 Flux in the Arctic Ocean and Its Adjacent Seas: Basin-Wide Distribution and Seasonal to Interannual Variability ” Polar Science 10 (3): 323–34. https://doi.org/10.1016/j.polar.2016.03.006.
Zeebe Richard E 2 2 “ History of Seawater Carbonate Chemistry Atmospheric CO 2 and Ocean Acidification ” Annual Review of Earth and Planetary Sciences 40 (1): 141–65. https://doi.org/10.1146/annurev-earth- 2 - 2
Zhu Yu Shaoling Shang Weidong Zhai and Minhan Dai 2 “Satellite-Derived Surface Water PCO2 and Air-Sea CO2 Fluxes in the Northern South China Sea in Summer ” Progress in Natural Science 19 (6): 775–79. https://doi.org/10.1016/j.pnsc.2008.09.004.
Draf Artikel Jurnal Internasional Terindeks SCOPUS
CO FLUX ANALYSIS TO KNOW THE ROLE OF WATER AS A SINK OR SOURCE CO IN THE WEST SEA, KARIMUNJAWA ISLAND
Elvina Wulan Fitria Suci, Suryanti*, Nurul Latifah, Churun Ain, Sigit Febrianto
Aquatic Resource Management Study Program Faculty of Fisheries and Marine Science, Diponegoro University
Jl. Prof Soedarto, SH Tembalang, Semarang, Jawa Tengah-50275, Telp/Fax +6224 7474698 Email: [email protected]
ABSTRACT
Global warming is an environmental problem that is currently occurring, where there is a continuous increase in temperature in the atmosphere, oceans and also earth. The increase in temperature is caused by the presence of greenhouse gases which include carbon dioxide, methane, nitrogen oxides, CFC and other small elements whose radiation is reflected repeatedly so that the temperature on earth has increased. The biggest impact is global climate change. The highest consentration of greenhouse gasses is carbondioxide (CO2). Ocean has the important have an the carbon cycle. Total of the carbon on the ocean are greater than total of the carbon in the air. Aims of the research ti analyse the value of CO2 flux in the west sea of Karimunjawa, to know the role of west sea of Karimunjawa as a sink or source CO2 and know the dominant factor that influence the value of CO2 flux. The research was conducted in August 2020 ini Karimunjawa Island with 8 station. The sampling method is purposive sampling. The variabel are Dissolved Inorganic Carbon (DIC), total alkalinity, pCO2 and sea water quality. Data anlysis using Principal Component Analysis (PCA). The measurement of Dissolved Inorganic Carbon use software CO2Sys, while the measurement of the total alkalinity concentration uses the titrimetric method. The results obtaine the concentration of CO2 flux ranging form 1,93 – mmol/m2/day. In general west sea of Karimunjawa Island the source of CO2. In addition flux CO2 are related to pCO2 sea water and clorophyll-a.
Keywords : CO2 Flux; Sink/Source; Karimunjawa
1. INTRODUCTION
Global warming is a big threat for environment that will increase the temperature on the earth and the biggest impact that will occur is climate change. Global warming occurs due to increased greenhouse gases including carbon dioxide, methane, nitrogen oxides, CFC and other small elements those radiation is reflected repeatedly so that the temperature on earth has increased (Cai et al., 2011). Carbon dioxide (CO2) has the highest concentration compared to other greenhouse gases (Samiaji, 2011;Samiaji, 2009) High carbon dioxide (CO2) on earth cause the temperature of the earth's surface increase, this is because sunlight will be trapped on the earth. Other than that, the high content of CO2 increases sea surface temperature that causes sea level rise. Remind the high CO2 content on earth, efforts are needed to reduce CO2 content. Efforts that can be made to reduce CO2 content on earth include adding facilities that can absorb CO2, such as increasing reforestation in cities. In addition to being able to absorb carbon, vegetation on land (green carbon) can also be carried out by coastal and marine vegetation (blue carbon).
Sea is a vast collection of saltwater that separates islands from one another. The ocean has a role to absorb carbon, where the total carbon in marine waters is estimated to be 50 times greater than the carbon in the atmosphere (Fachri et al., 2 . The oceans can store carbon in high concentrations and for a relatively long time, this is because there are ecosystems in the sea that have a role to absorb and store carbon such as seagrass ecosystems and coral reef ecosystems (Sari et al., 2 . Carbon absorption by marine waters occurs through two mechanisms, namely the solubility pump (physical pump / solubility pump) which can be said to be two-way in nature and the biological pump which can be said to be one-way. The biological pump works through food webs in the sea through plankton which includes phytoplankton and macrozooplankton which will produce carbon exports into deeper waters. Started with phytoplankton which uses CO2 for photosynthesis and from this process forms the phytoplankton biomass itself. After that process, the phytoplankton will be eaten by primary consumers, but not all phytoplankton will be eaten by primary consumers. Phytoplankton that not eaten by primary consumers will decompose and sink to the seabed and form larger aggregates called marine snow (Sigman et al., 2012; Setiawan 2 . The solubility pump itself is generated by the exchange of gases that occur between sea level and air and physical processes that bring CO2 into the sea. This gas transfer can occur because there is a difference in the partial pressure of CO2 between the atmosphere and the ocean.
The rate of transfer of CO2 gas between the sea and the atmosphere is called the CO2 flux.The CO2 flux value itself is influenced by several factors including gas transfer rate (cm / hour), carbon gas solubility in seawater (mol / m atm) and partial pressure difference (ΔpCO2). The value of CO2 flux has a close correlation with the temperature where in an area that has a lower temperature it will act as a CO2 source. Also, in the waters that are in areas with high temperatures, it will act as a CO2 sink.
This analysis of CO2 flux can be used to determine the role of a waters. If the CO2 flux of a water has a positive value (+), it will act as a source or release of CO2. The other hand, if a water has a CO2 flux value (-) then the water acts as a sink or source of CO2. In tropical waters it acts as a source of CO2, while in subtropical waters it can act as a sink of CO2 (Chen and Borges 2009; Cai et al 2 6 . Based on previous research, even though Indonesia is a tropical country, not all waters in Indonesia act as a source of CO2, but there are several locations that act as a CO2 sink (Afdal, 2016). Karimunjawa is the waters directly adjacent to the Java Sea in the north, south, west and east of its territory. Based on research conducted by Muchtar et al., (2013) that the role of the Java Sea on CO2 is a CO2 source. This is consistent with the research of Rustam et al., (2 , that banten bay in the east season have a acts as a source of CO2. Whereas in the research of Latifah et al., (2 , which conducted research on Karimunjawa, it was found that Karimunjawa had a role as a sink as well as a source of CO2. Therefore, researchers are interested in proving the role of the Karimunjawa sea which is in the tropics, whether it is a source CO2 ,sink CO2 or sink CO2 and source CO2.
The purpose of this research are to determine the CO2 flux in the western sea waters of Karimunjawa Island, to determine the role of the western sea waters of Karimunjawa Island and to determine the factors that make a bigger impact on the value of CO2 flux.
2. DATA AND METHOD
A. Data
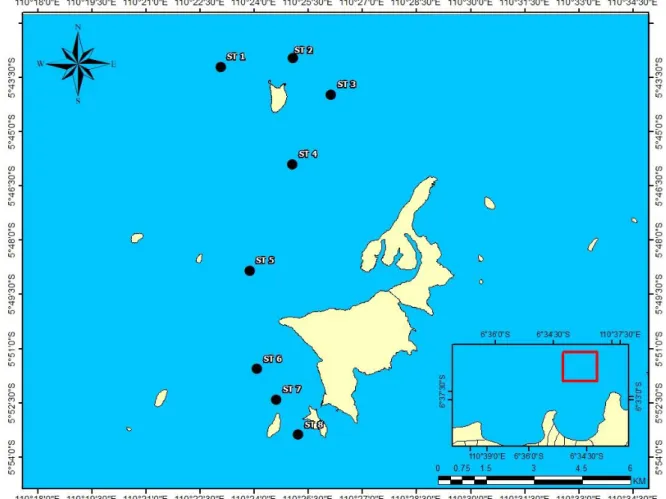
The material in this research is divided into two, which is research in the field and data analysis in the laboratory. This material includes water samples taken at 8 stations in the west sea of Karimunjawa Island which used for the measurement of carbonate systems which include pH, dissolved inorganic carbon (DIC), total alkalinity (TA), partial pressure of CO2 in the water, partial pressure of CO2 in the air and supporting parameters which include temperature, salinity, dissolved oxygen (DO), phosphate. In addition, this study uses secondary data obtained from the European Center for Medium-Range Weather Forecasts (ECMWF) for wind speed data at an altitude of 10m and pressure data at sea level, XCO2 data obtained from the website https: // disc. gsfc.nasa.gov/datasets/AIRXSCZM_V005/summary and chlorophyll-a data obtained from satellite imagery esa-oceancolour-cci.org.
B. Method
The method used is purposive sampling method, which is the sampling station has been adjusted to the objectives of this study (Ferdian et al., 2 2 . In this study, sampling was done in 8 observation stations which were considered to represent the west sea of Karimunjawa Island. The map of the research location is presented in Figure 1.
Figure Map of the Research Location
Sampling Method
Water samples for Dissolved inorganic carbon (DIC) and total alkalinity (TA) measurement taken by inserting a rope on nansen water sampler into the water body vertically and then waiting for the bottle to be filled. The nansen water sampler lifted if it was full. In the process of extracting a water sample, it was kept from having bubbles in it, it would affect the measurements. Afterward the water sample was transferred into a 250-ml glass sample bottle. Then adds a preservative of HgCl2 (1-2 drops) that stops biological activity. Water sample is carried out on water surface. To maintain the quality, the sample bottle was coated with a parafilm to prevent leakage. After that the sample stored in the coolbox. The use of coolbox helps it keep the temperatures from falling(Ritonga, 2 2). As for the samples used for phosphate measuring are using nansen water samplers on sea levels (Karil et al., 2015). After taking a water sample, the sample water poured into a 600ml bottle and stored it in a coolbox.
Measurement of Physical and Chemical Parameters