L
Journal of Experimental Marine Biology and Ecology 249 (2000) 263–280
www.elsevier.nl / locate / jembe
Effect of food and sediment pre-treatment in experiments
with a deposit-feeding amphipod, Monoporeia affinis
*
Albashir A. Aljetlawi , Jan Albertsson, Kjell Leonardsson
˚ ˚
Department of Ecology and Environmental Science, Umea University, SE-901 87 Umea, Sweden Received 9 December 1999; received in revised form 9 March 2000; accepted 28 March 2000
Abstract
We experimentally investigated the effects of different pre-treatments of the sediment, and the effect of daily addition of fresh phytoplankton, on the growth and survival of 1-year-old (11) individuals of the deposit feeder Monoporeia affinis (Amphipoda). We used three different types of sieved sediment: pre-frozen muddy clay, non-pre-frozen muddy clay, and fine sand. The muddy clay contained phytoplankton originating from the surface sediment sampled in the field during the late spring bloom. No phytoplankton was initially present in sand. The experiment lasted for 18 days. M. affinis responded to the daily phytoplankton addition by increasing growth. Phyto-plankton addition had no significant effects on the survival of M. affinis. Upon phytoPhyto-plankton addition, the sandy and non-frozen muddy clay gave similar growth and survival responses. In contrast, the pre-frozen sediment resulted in significantly lower growth and survival. The growth was negative in all treatments without phytoplankton. Thus, the high initial chlorophyll content in the muddy clay was not of sufficient quality or concentration to allow a positive growth response in M. affinis. The growth of M. affinis was significantly correlated with the reduction of the chlorophyll. Our results indicated that M. affinis is capable of assimilating settled phytoplankton with no, or only a few days’ time delay. 2000 Elsevier Science B.V. All rights reserved.
Keywords: Deposit feeder; Growth; Monoporeia affinis; Phytoplankton addition; Sediment treatment; Survival
1. Introduction
To understand how species interact, it is fundamental to have a basic knowledge about their food resources and environmental requirements. A negative influence of one
*Corresponding author. Tel.:146-90-786-6637; fax:146-90-786-7665.
E-mail address: [email protected] (A.A. Aljetlawi)
species on another could be explained either by resource competition, interference, or predation. One group of animals for which information on food sources is difficult to derive is for deposit feeding benthic animals. In addition, experiments with infauna species are difficult to perform without disturbing their environment—the sediment. To get rid of unwanted species or individuals prior to the experiment, the sediment is often sieved (Hill and Elmgren, 1987; Bianchi et al., 1988; Leonardsson, 1991; Hill, 1992; Webb and Montagna, 1993; Sparrevik and Leonardsson, 1998, 1999; Sparrevik, 1999) or frozen (Kern and Taghon, 1986; Smith and Brumsickle, 1989; Turner et al., 1997; Vriser, 1998). Little is known about how such treatment affects (a) the amount and quality of food for deposit feeders, and (b) the behaviour of the species.
Several different approaches have been used to find out the food source of benthic animals. One method is to use stable isotopes to find out the origin of the assimilated carbon and nutrients (Miyazaki et al., 1985; Couch, 1989; Gu et al., 1994; Hobson et al., 1995; Newell et al., 1995). However, if the resources come from several trophic levels, and different geographical origins, it may be difficult to estimate the relative contribution of each food source due to the additive inclusion of the isotopes in the somatic tissues. This method can provide a rough estimate of which trophic levels the main food sources come from, but it cannot tell us if prey were dead or alive when eaten. This question is crucial when discussing species interactions.
The traditional gut content analyses do not usually provide an answer to the question concerning the essential food source of deposit feeders. Such studies often show that unspecified detritus makes up a dominant fraction of the gut content (Moore, 1977; Johnson, 1987a,b). This is the case with the swimming and burrowing amphipods of the
¨
Pontoporeiidae, Monoporeia affinis (Lindstrom), and the closely related species Pon-¨
toporeia femorata Kroyer, and Diporeia hoyi (Smith). These species are semelparous
this issue for M. affinis. These observations are somewhat ambiguous. Cederwall (1977) found a direct response of M. affinis growth to the phytoplankton spring bloom, while others have found a delayed response (Elmgren, 1978; Sarvala, 1986; Uitto and Sarvala, 1991; Lehtonen and Andersin, 1998). Such observations raise the question of whether
M. affinis can grow on newly settled phytoplankton or if some degradation is necessary. Does the pre-treatment of the sediment, and the way food is offered in experiments prevent us from observing a natural response in deposit feeders? How does the choice of sediment type affect the results? Here we investigate these questions using an experimental design focusing on the effects of (a) different pre-treatments of the sediment, (b) different sediment types, and (c) addition of fresh phytoplankton. We used
M. affinis, for which we studied growth and survival to investigate these questions.
2. Materials and methods
2.1. Experimental set-up and accomplishment
To investigate the impact of fresh phytoplankton, and sediment type and pre-treatment on the growth of M. affinis we used a two-way factorial experiment. The impact of phytoplankton was investigated with and without addition of fresh phytoplankton. The other factor constituted sediment type and pre-treatment of the sediment, with three levels; non-frozen and pre-frozen muddy clay, and non-frozen terrestrial fine sand.
The population of M. affinis consisted of three age cohorts from the northern Bothnian Sea. We only used 1-year-old (11) individuals for the experiments. These were collected by dredging at a depth of 16–18 m from an inshore area near Norrbyn (638
˚
33.59 N, 198 49.79 E), 40 km south of Umea, northern Sweden. Oxidised surface sediment, the upper 2–3 cm, was collected from the same area by using a sledge-like dredge during the late spring bloom on May 20, 1998, about 2 weeks before we started the experiments. We first sieved the sediment through a 0.5-mm mesh to remove the macrofauna, then homogenised the sediment–water mixture by stirring, and left it outdoors for sedimentation, covered with a black plastic lid. After 1 week we split the sediment into two portions, of which one was kept in a freezer (2218C) for 4 days. The remaining portion was left outdoors, covered with a black plastic lid. The aim of the freezing was to reduce potential competitors, i.e., meiofauna and bacteria, in the sediment. Since pre-freezing of sediments prior to experiments is often used in marine ecological experiments, we wanted to evaluate the general impact of freezing. In addition to non-frozen and pre-frozen muddy clay, we used wet-sieved (0.5-mm mesh size), clean, fine, terrestrial, non-frozen, sand as separate sediment without organic content.
The initial chlorophyll a (chl a) content of the non-phytoplankton treatments was 21
0.03560.014 mg l (61 S.D., n55), while for the phytoplankton treatments it was 21
2.1260.01 mg l . These levels are negligible when compared with the total amounts added to the treatments. The cylinders were randomly assigned to two large tanks with flowing water (5.460.48C) to keep temperature variation to a minimum. The surface level of the water was the same inside and outside the cylinders. The tanks were covered with black plastic lids to mimic deep-water light conditions and to prevent phyto-plankton growth during the experiment.
One week after the addition of the sediments, we placed 50 randomly picked 11 M. 22
affinis individuals in each cylinder (1840 ind m ). We excluded individuals with an empty gut (examined by eye), to avoid individuals close to the moulting stage. Before adding the animals to the cylinders, we kept them in darkness in aquaria at 78C for 48-h acclimation, to allow for accidentally injured animals to die before the onset of the experiment. From these animals we also preserved five replicates with 50 11 M. affinis in each for analysis of the initial ash-free dry weight (AFDW) (Table 3). We measured the AFDW following HELCOM (1988).
From the onset of the experiment, we added 100 ml of a phytoplankton suspension 21 21
corresponding to 56624 mg chl a cylinder day (61 S.D.) from a phytoplankton culture (see Section 2.4) on a daily basis to the cylinders belonging to the phytoplankton addition category. The variation given was over the time and originated from daily variation of chl a in the algal culture. The amount of phytoplankton added daily to the cylinders corresponded to the daily sedimentation of phytoplankton during the spring bloom of 1991 in the southern Bothnian Sea (Kuparinen et al., 1994). To minimise handling differences between the treatments the same volume, 100 ml, of filtered seawater was added to each of the cylinders belonging to non-addition treatments. The experiment began on June 19 1998 and lasted for 18 days. The experiment was terminated by sieving the contents of the cylinders through a 0.5-mm mesh size net. The
M. affinis were collected from the sieve and preserved in a 4% formaldehyde solution for 7 days. Thereafter we counted the animals and measured their AFDW. The specific growth rate of M. affinis was calculated from G5hln(W )f 2ln(W )j/ time, where W isi f the final weight (i.e., AFDW), W is the initial weight, and time is the length of thei experimental period in days.
2.2. Estimation of time delay
Although the experiment was not originally intended to investigate the presence of a time delay between the settling of the phytoplankton and the onset of feeding, it provides useful information on this issue. While a time delay can be explained by several different mechanisms, the absence of a time delay suggests that the Monoporeia started feeding immediately, without any need for the algae to degrade. For this estimation, we included results from a pilot experiment, identical to the main experiment except that it only lasted for 10 days and the daily resource addition amounted to 15.2614.3 mg chl a
21
accurate measure of the specific growth rate would be to calculate the growth rate using the number of days actually feeding. This would also require an adjustment of the initial individual mass because of starvation during the initial phase. We calculated the growth rates for a range of time delays for both experiments to evaluate the resulting growth rates from this scenario. To estimate the initial mass for different time delays we used the following differential equation:
m 2
dW/ dt5 2m W1 (1)
This equation accounts for loss of weight due to metabolic costs, where m and m are1 2 constants, and W is the individual mass. We estimated m1 from the sandy sediment treatments without addition of algae. The exponent of the allometric scaling of these costs was m250.75, obtained from Lehtonen (1994). Under the assumption of T days initially without feeding in the experiment, we calculated the individual mass, W , at theT onset of feeding. For each value of T, between 0 and 9 days, we calculated the expected growth rate in each of the experiments. We only used data from the sandy sediment with addition of phytoplankton for these calculations, since in the other treatments some additional food should have been originally present in the sediment. Our goal with these calculations was to find the delay when the growth rates were equal in the two experiments. In that situation, the value of T gives us the time delay, given that the individuals had maximum food supply in both experiments. If the food supply were below this threshold, the time delay would be shorter than the time T where the growth rates were equal. The reason for this is that less food was added in the pilot experiment, which could make the growth rate without a time delay lower in this experiment.
2.3. Sediment and water analyses
Sub-samples for sediment analyses were collected with thin steel cylinders of 2.3-cm inner diameter. For the sediment characteristics, we measured loss on ignition from two sub-samples per treatment the day before the start and at the end of the experiment. For these measurements, the upper 3-cm of the cylinders was used. The loss on ignition was analysed following standard techniques (Dybern et al., 1976). The organic content in fine sand, and non-frozen and pre-frozen muddy clay at the start of the experiment was 0.1460.01% (61 S.D., n54), 3.2160.08 and 3.1660.08%, respectively. The organic content did not change significantly from the start to the end of the experiment (ANOVA
F1,1851.85, P50.19) In the addition treatment, the organic content was 0.1560.001% in fine sand, 3.1360.10% in non-frozen, and 3.1760.14% in pre-frozen muddy clay, while its value was 0.1860.04, 3.1460.08 and 2.8460.28%, respectively, in treatment without phytoplankton addition. For analyses of phaeopigment and chl a content, we collected one additional sub-sample from each of two cylinders per treatment. The uppermost 5-mm of the sediment was collected from each of these cylinders.
dried and wrapped in a piece of clean filter paper in air for 30 min. The chl a retained on the filter was extracted for 24 h in darkness at room temperature with 10 ml of 95% ethanol. After 10-min centrifugation at 3500 rpm, the extract was measured fluorimetri-cally (Perkin-Elmer fluorometer LS30) at 433 and 676 nm for excitation and emission wavelengths, respectively. Fifteen ml of 95% ethanol were added to the sediment samples, and after a 5-min ultrasonic bath, extracted for 24 h in darkness at room temperature. Ten ml of the supernatant were transferred to clean Falcon tubes and centrifuged and measured as above. Fluorescence was measured both before and 3 min
21
after acidification with 1 M HCl (12 ml ml extract). Chl a and phaeopigment concentration was calculated according to Edler (1979), using calibration factors obtained from a pure standard of chl a (Fluka) measured before and after acidification.
2.4. Phytoplankton culture
The phytoplankton culture was started from filtered (100-mm mesh size to exclude most meso-zooplankton) seawater during the spring bloom. The culture volume amounted to 80 l. To keep the algal population growing we added daily the basic
21 21
nutrients nitrogen, as NaNO (50 mg l3 ), phosphorus, as Na HPO (3.5 mg l2 4 ), and 21
silica, as Si(OH) (2.5 ml l4 ). The culture was kept indoors in 12-h light and natural seawater temperature (|128C). We collected daily samples for chl a analysis and for the
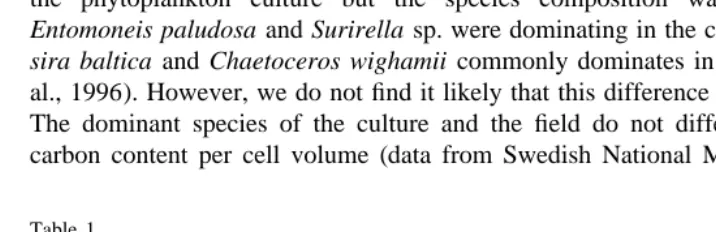
addition to the phytoplankton treatments in the cylinders. Dominating phytoplankton species in the culture were noted by visual inspection using a microscope. The species composition of the culture did not change markedly throughout the experimental period (Table 1). As in a typical phytoplankton spring bloom in our area, diatoms dominated in the phytoplankton culture but the species composition was somewhat different.
Entomoneis paludosa and Surirella sp. were dominating in the culture, while Thalassio-sira baltica and Chaetoceros wighamii commonly dominates in the field (Kuparinen et
al., 1996). However, we do not find it likely that this difference has affected the results. The dominant species of the culture and the field do not differ markedly by size or carbon content per cell volume (data from Swedish National Monitoring Programme).
Table 1
The percent by volume (V, %), carbon content (C, %), and average cell size (l3bmm, l denotes length and b denotes breadth) of dominant phytoplankton culture taxa (.7mm) at the start and end of the experiment
Taxon Average Start End
cell size V (%) C (%) V (%) C (%)
l3b (mm)
Entomoneis paludosa 40.5317.7 45.4 38.2 50.0 40.9
Surirella sp. 30.6321.9 41.3 42.2 31.8 31.6
Pennate diatoms 98.038.7 8.5 10.8 12.1 15.0
Pigmented flagellate 6.636.6 1.7 3.6 2.2 4.5
Chaetoceros wighamii 9.538.1 1.6 3.1 0.2 0.3
Aulacoseira sp. 12.0310 1.2 1.3 0.1 0.1
Before addition of cultured phytoplankton to the experimental treatments, we collected 25–30 l of the culture and filtered it through a 7-mm mesh, after which the sample was rinsed with filtered water to dilute the nutrients. A 7-mm filter was used to concentrate the larger phytoplankton and to remove the nutrient-rich water. Thereafter we stirred the phytoplankton into 1.5 l filtered (as in Section 2.1) water and distributed it equally among the replicates in the experiment. After the removal of phytoplankton from the culture, we replaced the removed volume of nutrient-enriched seawater.
2.5. Statistical treatment of the results
We used ANOVA to test for effects of sediment type and addition of phytoplankton on growth and survival of M. affinis. We checked the residuals for homogeneity and normality of variances. The survival probabilities were arcsine-transformed before the statistical analysis to achieve homogeneity of variances. To test for differences between groups we used Tukey’s test of multiple comparisons (Systat, 1992).
3. Results
3.1. Growth and survival
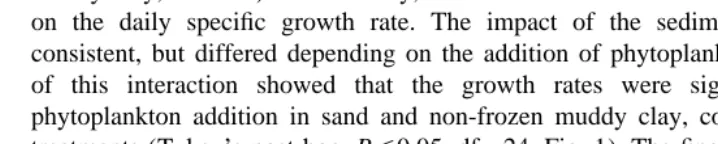
The addition of phytoplankton had a significant positive effect on the daily specific growth rate of M. affinis compared with treatments without phytoplankton addition (Table 2). With addition of phytoplankton, the specific growth rates were 0.017 in fine sand, 0.010 in non-frozen muddy clay, and negative, 20.001, in pre-frozen muddy clay (Table 3 and Fig. 1). In all treatments without phytoplankton addition M. affinis had negative growth rates (sand, 20.005; non-frozen muddy clay, 20.003; pre-frozen muddy clay, 20.008). Additionally, the sediment treatment showed a significant effect on the daily specific growth rate. The impact of the sediment treatment was not consistent, but differed depending on the addition of phytoplankton. The interpretation of this interaction showed that the growth rates were significantly higher with phytoplankton addition in sand and non-frozen muddy clay, compared with the other treatments (Tukey’s post-hoc, P,0.05, df524, Fig. 1). The final body masses resulting from each treatment are given in Table 3. In contrast to growth, food addition had no
Table 2
Two-factor ANOVA table for effects of phytoplankton addition (Phytoplankton) and sediment treatment a
(Sediment) on the daily specific growth rate of 1-year-old (11) Monoporeia affinis amphipods
Source df MS F P
Phytoplankton 1 0.00147 61.58 ,0.0001
Sediment 2 0.00028 11.88 0.0003
Phytoplankton3 2 0.00015 6.37 0.0061
sediment
Error 24 0.00002
a
Table 3
Average and standard deviation (S.D.) of initial and final body masses (mg AFDW) and, specific growth rate
21
(day ) of 1-year-old (11) Monoporeia affinis amphipods
Treatment Body mass (mg) Specific growth rate
21 (day )
Average S.D. Average S.D.
Initial 0.64 0.03
Final
Phytoplankton addition:
Sand 0.87 0.09 0.017 0.005
Non-frozen muddy clay 0.76 0.07 0.010 0.005
Pre-frozen muddy clay 0.63 0.07 20.001 0.006
Non-phytoplankton addition:
Sand 0.58 0.05 20.005 0.005
Non-frozen muddy clay 0.61 0.03 20.003 0.003
Pre-frozen muddy clay 0.55 0.04 20.008 0.004
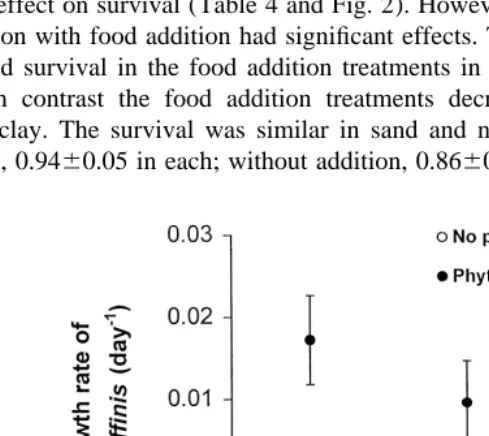
overall effect on survival (Table 4 and Fig. 2). However, the sediment treatment, and its interaction with food addition had significant effects. The interaction originated from an increased survival in the food addition treatments in sand and non-frozen muddy clay, while in contrast the food addition treatments decreased survival in the pre-frozen muddy clay. The survival was similar in sand and non-frozen muddy clay (with food addition, 0.9460.05 in each; without addition, 0.8660.11 and 0.8460.09, respectively).
21
Table 4
Two-factor ANOVA table for effects of sediment treatment (Sediment) and phytoplankton addition (Phyto-a
plankton) on the survival of 1-year-old (11) Monoporeia affinis amphipods
Source df MS F P
Sediment 2 0.29452 28.39 ,0.0001
Phytoplankton 1 0.00022 0.02 0.8871
Sediment3 2 0.05385 5.19 0.0133
phytoplankton
Error 24 0.01037
a
The squared multiple r was 0.74.
The survival was generally lower in the pre-frozen sediment, 0.5260.16 with food addition, and 0.6860.1 without. During the daily procedure of adding phytoplankton / water to the cylinders we observed high swimming activity in all pre-frozen muddy clay treatments. This high swimming activity could be related to the lower growth rates and survival rates in these treatments.
3.2. Estimation of time delay
Estimation of a time delay in the onset of feeding of Monoporeia affinis would provide information on whether this deposit feeder could use newly settled phyto-plankton as a food source. The estimation of the presence of a time delay required calculation of the metabolic constant that converts respiration loss to loss in mass, m .1 This constant was estimated to 0.02760.012 and it did not differ significantly between the 10- and 18-day experiments. The masses after an initial starvation period due to any
given time delay in the onset of feeding were derived from the integration of differential equation (Eq. (1)). While increasing the time delay, the starvation reduce the body mass at the onset of feeding, and the daily growth rate during the remaining period had to increase to reach the observed final body mass. This yielded growth rates for the two experiments that increased rapidly when the time delay approached the length of each experiment (Fig. 3). The growth rate without any time delay was lower for the 10-day experiment with lower amounts of food addition. At a time delay of 5 days the calculated growth rate curves for the two experiments intersected. For longer time delays, the growth rates were higher in the low addition experiment. Since this is not realistic, the time delay for the onset of feeding should be less than 5 days.
3.3. Changes in the water and the sediment chlorophyll
The phytoplankton settled rapidly after being added to the cylinders. More than 80% of the added chl a had disappeared from the water in the experimental cylinders from 1 day to the next. The highest chl a contents at the end of the experiment with food
21
addition was noted in non-frozen muddy clay, 9.862.9mg cylinder , and lowest in the 21
pre-frozen muddy clay treatment, 6.160.6mg cylinder . The water chl a increased in all treatments without algal addition and reached the highest level, 8.561.6 mg
21
cylinder , in non-frozen muddy clay. The remaining treatments had lower final water 21
chl a contents, 1.660.9mg cylinder .
No chl a could be detected in the fine sand before the start of the experiment in the upper 5-mm of the sediment. In this sediment type, chl a increased in phytoplankton
21
addition treatments and reached 94635 mg cylinder in this layer (Fig. 4). In 21
comparison, the total addition of chl a amounted to 950mg cylinder . There were no differences between the initial chl a contents among non-frozen and pre-frozen muddy
21
clay, 470637 and 461664 mg cylinder , respectively. In treatments with
phyto-Fig. 3. Estimated specific growth rates, assuming different time delays between the settling of the phytoplankton and the onset of feeding and assimilation. The two curves denote the results from the 18-day
21 21
Fig. 4. Chl a in the uppermost 5-mm sediment at the start of experiment (white columns) and at the end of experiment in cylinders with (black columns), and without (shadow columns) addition of phytoplankton, irrespective of sediment (fine sand, and non-frozen and pre-frozen muddy clay). Error bars denote61 S.D.
plankton addition, chl a increased in both non-frozen and pre-frozen muddy clay to 6776190 and 596667, respectively, at the end of the experiment. In the treatments without addition, chl a deceased in both non-frozen and pre-frozen muddy clay, 107635
21
and 315666 mg cylinder , respectively.
The reduction of total chl a content in the cylinders during the experiment was somewhat less than the amount added for all treatments (Fig. 5). The specific growth rate of M. affinis showed a significant positive correlation (r50.67, n512, P50.017) with the reduction of the chl a (total reduction in water and uppermost 0.5 cm in the sediment) (Fig. 6). The interpretation of such a correlation would be that M. affinis consumed most of the phytoplankton. The reduction in chl a was about equal in all sediment types, about 80–90% of the added chl a. Despite this similarity, the growth of
M. affinis was only similar in the sand and non-frozen muddy clay with phytoplankton addition (Fig. 1). However, a high reduction in chl a also occurred in the non-frozen muddy clay when no phytoplankton was added (Fig. 5). The corresponding reduction of the initial sediment chl a was much smaller in the pre-frozen sediment.
3.4. Estimation of the consumed amounts of added phytoplankton
One question of interest is how large a fraction of the added phytoplankton was actually consumed by M. affinis. We determined a conversion constant, from 3065mg
21 21
Fig. 5. Initial chl a contents of sediment (columns); reduction of total chl a (chl a in water and uppermost 5-mm of the sediment combined) content in cylinders with (filled circles) and without (open circles) addition of phytoplankton. The chl a addition (squares) to cylinders exposed to phytoplankton addition amounted to 950
21
mg cylinder area irrespective of sediment (fine sand, and non-frozen and pre-frozen muddy clay). Error bars denote61 S.D.
conversion from mm chlorophyll tomm carbon. This yielded a total carbon addition of 21
25–30 mg C cylinder . Since at least 10% of the chlorophyll remained in the cylinders at the end of the experiment, we estimate that the lost fraction amounted to 23–27 mg C
21
cylinder . By using the initial and final weights of M. affinis from the
non-phyto-Fig. 6. Relationship between reduction of total (water and uppermost 5-mm sediment combined) chl a and
21
plankton addition treatment in Eq. (1), we calculated the energetic loss of carbon as 2.2 21
mg C cylinder . The absolute growth in sand with phytoplankton addition was 5–7 mg 21
C cylinder . By using the relationship: growth5assimilation efficiency3ingestion2
energetic costs, we can estimate the total ingestion by M. affinis per cylinder. Assuming an assimilation efficiency in the range 0.7–0.8, we obtained a total ingestion of 9–13 mg
21
C cylinder . Thus, about 40% of the added phytoplankton carbon was ingested. The corresponding calculations for the pilot experiment with lower daily addition of phytoplankton, less than one-third of that in the 18-day experiment, yielded 70–100% ingestion of the added phytoplankton carbon.
4. Discussion
A seemingly high quality sediment, collected from the sediment surface layer during the late spring bloom was not sufficient for growth of M. affinis. This was the case despite a high initial chlorophyll content in this sediment. The growth condition deteriorated in this sediment when it was frozen before the experiment. In the pre-frozen sediment, the conditions became unfavourable for M. affinis, and we observed drastically increased swimming activity in the phytoplankton addition treatment in this sediment. Most likely it was the increased swimming activity that led to negative growth and high mortality. In order to get positive growth of M. affinis, fresh phytoplankton had to be added to the experimental units. When doing so, the sandy, inorganic, and the non-frozen muddy clay gave similar positive responses for both growth and survival. Our results show that the choice of pre-treatment of the sediment and the addition of high quality food in experiments with M. affinis is crucial for obtaining useful results. This should be especially important when performing interaction experiments. Although our study only focused on one species of deposit feeder, there is reason to believe that other species may also be sensitive to the pre-treatment of the sediment and the quality of the food.
4.1. What is the main food source?
lakes. Additionally, in a Baltic archipelago, bacteria and meiofauna production do not seem to cover the energy requirements of M. affinis (Uitto and Sarvala, 1991). However, food sources other than fresh phytoplankton may play an important role during other periods of the year, when survival is more important than growth.
The maximum growth rates observed in the 18-day experiment were close to 0.02. Our measure is somewhat lower than that of 0.04 for 11 M. affinis, found by Uitto and Sarvala (1991) in the Gulf of Finland. In our study the temperature was 5.48C, somewhat lower than the 6.58C in Uitto and Sarvala’s (1991) study. This temperature difference could partly explain the lower growth rate in our study. The optimal temperature range for M. affinis growth is 8–128C (Gordeev, 1952). However, a doubling of the growth rate should not be expected from a 18C increase, indicating that the individuals in our experiment did not reach maximum growth rate. Consequently, the growth rates in the low addition pilot experiment should have been far from the maximum rates. Our calculations of the consumption of the phytoplankton in this experiment also suggest that the growth rate should have been below maximum since almost all phytoplankton carbon was used for growth. Hence, the possible time delay between the settling of the phytoplankton and the feeding and assimilation seems to be restricted to a few days at most. The temperature is a possible explanation for observed time delays between sedimentation and growth responses observed in the field. For example, Lehtonen and Andersin (1998) reported that individual growth responded to the sedimented spring bloom after 4 weeks. As in other poikilotherms, the physiological
˚
rates affecting growth are generally temperature dependent (Segerstrale, 1937; Dermott and Corning, 1988). A simple explanation for a time delay should be expected when the spring bloom is settling, while the temperature is still increasing. Thus, at low temperature the maximum growth rate will also be low, while maximum growth rate increases as the temperature increases. Adaptation to the long period of starvation during winter may also cause a time delay, since the physiological mechanism may need time to activate the digestion processes, as found for the copepod Calanus hyperboreus (Head and Conover, 1983). Lehtonen (1996) concluded that the physiological condition is one of the reasons for a time-lag in M. affinis. This mechanism is likely to cause a time-lag between the onset of phytoplankton spring bloom sedimentation and onset of growth. It is, however, questionable if it can cause a time-lag between peak of sedimentation and
M. affinis maximum growth rate. Our results indicate that the temperature hypothesis is a more likely explanation for the time delay observed in the field, rather than it being due to a need for bacterial or meiofauna degradation of the phytoplankton.
4.2. Starvation despite chlorophyll in the sediment
the sediment contained as much chlorophyll as was added during the entire experimental period. Consequently, the upper 2 cm contained twice as much chlorophyll as was added. The reduction of the chlorophyll in the uppermost 0.5 cm of the sediment indicates that M. affinis actually consumed this fraction. However, the low growth resulting from this consumption indicates that the quality was low, or the sizes of the chlorophyll particles were small. According to Dermott and Corning (1988), the ability to select high-quality particles declines quickly with increasing size of D. hoyi. The size of the M. affinis we used was probably too large to allow efficient selection of the small food particles. Field observations commonly show that 01 M. affinis continue to grow during autumn, whereas 11 and 21 decrease in mass (e.g., Sarvala, 1986; Uitto and Sarvala, 1991). Since sedimentation of fresh phytoplankton is generally low during the autumn, the selectivity of diluted small particles in the sediment by the smaller individuals may be one explanation for the observed pattern.
4.3. Are pre-frozen sediments harmful?
The freezing process changed the sediment characteristics, which gave rise to high swimming activity and mortality. Although M. affinis consumed most of the added phytoplankton in this treatment, its weight decreased. The increased metabolic cost of swimming most likely reduced the energy left for growth. Spending less time in the sediment reduces bioturbation and leads to decreased oxygen concentration in these treatments. M. affinis also increased its swimming activity in response to decreasing oxygen concentration in experiments by Johansson (1997a). M affinis and D. hoyi are not found in anoxic sediments (M. affinis, Johansson, 1997b; D. hoyi, Sly and Christie, 1992). There may have been an escalating response in our pre-frozen sediments, where for some other reason the individuals avoided the sediment. Leaving the sediment then made the situation even worse. We can only speculate on the reason for the avoidance. One explanation could be toxic or repellent exudates from bacterial degradation of dead micro-organisms and / or meiofauna. In fact, at the end of the experiment, cylinders belonging to this treatment smelled different from the other cylinders. Alternatively, the freezing process may have changed the physical properties of the sediment, making it more difficult for M. affinis to penetrate.
5. Conclusions
experiments. One possible explanation for this is that the settling phytoplankton in the field are immediately ingested, de-fragmented, or diluted into the sediment by bioturba-tion. Pre-treatment of experimental sediment by freezing made the sediment highly unfavourable for the amphipods. Possibly, the amphipods would have performed better if aeration and / or water circulation had been used. The results nevertheless suggest that pre-frozen soft sediment should be used with caution, or avoided.
Acknowledgements
We thank Christian Otto and Erik Bonsdorff for comments on the manuscript, Kristina Samuelsson for help with the phytoplankton culture, and Sara Jonsson for phytoplankton identifications work. Tim Hipkiss improved the English and two anonymous reviewers
˚
provided valuable comments on the manuscript. Umea Marine Sciences Centre (UMF), ˚
Umea University provided the facilities needed for this work. [RW]
References
Ankar, S., 1977. The soft bottom ecosystem of the northern Baltic proper with special reference to the ¨
macrofauna. Contrib. Asko Lab. 19, 1–62.
Bianchi, T.S., Dawson, R., Sawangwong, P., 1988. The effects of macrobenthic deposit-feeding on the degradation of chloropigments in sandy sediments. J. Exp. Mar. Biol. Ecol. 122, 243–255.
Cederwall, H., 1977. Annual macrofauna production of a soft bottom in the northern Baltic Proper. In: Keegan, B.F., O’Ceidigh, P., Boaden, P.J.S. (Eds.), 11th Eur. Symp. Mar. Biol, Biology of Benthic Organisms, Pergamon, Oxford, pp. 155–164.
Couch, C.A., 1989. Carbon and nitrogen stable isotopes of meiobenthos and their food resources. Estuarine Coastal Shelf Sci. 28, 433–442.
Dermott, R., Corning, K., 1988. Seasonal ingestion rates of Pontoporeia hoyi (Amphipoda) in lake Ontario. Can. J. Fish. Aquat. Sci. 45, 1886–1895.
Dybern, B.I., Ackefors, H., Elmgren, R., 1976. Recommendations on methods for marine biological studies in the Baltic Sea. Baltic Mar. Biol. Publ. 1, 1–98.
Edler, L., 1979. Recommendations for marine biological studies in the Baltic Sea: Phytoplankton and chlorophyll. Baltic Mar. Biol. 5, 1–38.
Elmgren, R., 1978. Structure and dynamics of Baltic communities with special reference to the relationship between macro- and meiofauna. Kieler Meeresforsch. (Sonderh.) 4, 1–22.
Elmgren, R., Ankar, S., Marteleur, B., Ejdung, G., 1986. Adult interference with postlarvae in soft sediments: The Pontoporeia –Macoma example. Ecology 67, 827–836.
Goedkoop, W., Johnson, R.K., 1992. Modelling the importance of sediment bacterial carbon for profundal macroinvertebrates along a lake nutrient gradient. Neth. J. Aquat. Ecol. 26, 477–483.
Goedkoop, W., Johnson, R.K., 1994. Exploitation of sediment bacterial carbon by juveniles of the amphipod
Monoporeia affinis. Freshwater Biol. 32, 553–563.
Gordeev, O.N., 1952. Biologiya i ekologiya reliktovogo rachka Pontoporeia affinis Lindstr. v ozerakh Karelii. Uchenye Zapiski Karelo-Finskogo Universiteta. Biol. Nauki (in Estonian) 4, 98–109.
Gu, B., Schell, D.M., Alexander, V., 1994. Stable carbon and nitrogen isotopic analysis of the plankton food web in a subarctic lake. Can. J. Fish. Aquat. Sci. 51, 1338–1344.
Head, E.J.H., Conover, R.J., 1983. Induction of digestive enzymes in Calanus hyperboreus. Mar. Biol. Lett. 4, 219–231.
Hill, C., 1992. Interactions between year classes in the benthic amphipod Monoporeia affinis, effects on juvenile survival and growth. Oecologia 91, 157–162.
Hill, C., Elmgren, R., 1987. Vertical distribution in the sediment in the co-occurring benthic amphipods
Pontoporeia affinis and P. femorata. Oikos 49, 221–229.
Hylleberg, J., Gallucci, V., 1975. Selectivity in feeding by the deposit bivalve Macoma nasuta. Mar. Biol. 32, 167–178.
Hobson, K.A., Ambrose, W.G.J., Renaud, P.E., 1995. Sources of primary production, benthic-pelagic coupling,
13 15
and trophic relationships within the Northeast Water Polynya, insights fromd C andd N analysis. Mar. Ecol. Prog. Ser. 128, 1–10.
Johansson, B., 1997a. Behavioural response to gradually declining oxygen concentration by Baltic Sea macrobenthic crustaceans. Mar. Biol. 129, 71–78.
Johansson, B., 1997b. Tolerance of the deposit-feeding Baltic amphipods Monoporeia affinis and Pontoporeia
femorata to oxygen deficiency. Mar. Ecol. Prog. Ser. 151, 135–141.
¨ Johnson, R.K., 1987a. The life history, production and food habits of Pontoporeia affinis Lindstrom
(Crustacea: Amphipoda) in mesotrophic Lake Erken. Hydrobiologia 144, 277–283.
Johnson, R.K., 1987b. Seasonal variation in diet of Chironomus plumosus (L.) and Chironomus anthracinus Zett (Diptera: Chironomidae) in mesotrophic Lake Erken (Sweden). Fre. Biol. 17, 525–532.
Johnson, R.K., Wiederholm, T., 1992. Pelagic–benthic coupling: the importance of diatom interannual variability for population oscillations of Monoporeia affinis. Limnol. Oceanogr. 37, 1596–1607. Kern, J.C., Taghon, G.L., 1986. Can passive recruitment explain harpacticoid copepod distributions in relation
to epibenthic structure? J. Exp. Mar. Biol. Ecol. 101, 1–23.
Kuparinen, J., Leonardsson, K., Mattila, J., Wikner, J., 1994. Food web structure, carbon flow and trends in the Gulf of Bothnia. Baltic Sea. Vatten 50, 201–219.
Kuparinen, J., Leonardsson, K., Mattila, J., Wikner, J., 1996. Food web structure and function in the Gulf of Bothnia, the Baltic Sea. Ambio 8, 13–21.
Lehtonen, K.K., 1994. Metabolic effects of short-term starvation on the benthic amphipod Pontoporeia affinis ¨
Lindstrom from the northern Baltic Sea. J. Exp. Mar. Biol. Ecol. 176, 269–283.
Lehtonen, K.K., 1996. Ecophysiology of the benthic amphipod Monoporeia affinis in an open-sea area of the northern Baltic Sea: seasonal variations in oxygen consumption and ammonia excretion. Mar. Biol. 126, 645–654.
Lehtonen, K.K., Andersin, A.B., 1998. Population dynamics, response to sedimentation and role in benthic metabolism of the amphipod Monoporeia affinis in an open-sea area of the northern Baltic Sea. Mar. Ecol. Prog. Ser. 168, 71–85.
Leonardsson, K., 1991. Effects of cannibalism and alternative prey on population dynamics of Saduria
entomon (ISOPODA). Ecology 72 (4), 1273–1285.
Lopez, G., Elmgren, R., 1989. Feeding depths and organic absorption for the deposit-feeding benthic amphipods Pontoporeia affinis and Pontoporeia femorata. Limnol. Oceanogr. 34, 982–991.
Lopez, G.R., Kofoed, L.H., 1980. Epipsammic browsing and deposit-feeding in mud snails (Hydrobiidae). J. Mar. Res. 38, 585–599.
Lopez, G.R., Levinton, J.S., 1987. Ecology of deposit-feeding animals in marine sediments. Q. Rev. Biol. 62, 235–260.
Marzolf, G.R., 1965. Substrate relations of the burrowing amphipod Pontoporeia affinis in Lake Michigan. Ecology 46, 579–592.
McCall, P.L., Tevesz, M.J.S. (Eds.), 1982. Animal-sediment Relations: the Biogenic Alteration of Sediments, 1st Edition, Plenum, New York.
Miyazaki, T., Honjo, Y., Ichimura, S.E., 1985. Applicability of the stable isotope method using carbon-13 and nitrogen-15 simultaneously to the estimation of carbon and nitrogen assimilation in a eutrophic, freshwater lake, Lake Nakanuma, Japan. Arch. Hydrobiol. 102, 355–366.
Moore, J.W., 1977. Importance of algae in the diet of subarctic populations of Gammrus lacustris and
Pontoporeia affinis. Can. J. Zool. 55, 637–641.
Robbins, R.A., 1982. Stratigraphic and dynamic effects of sediment reworking by Great Lakes zoobenthos. Hydrobiologia 92, 611–622.
¨ Sarvala, J., 1986. Interannual variation of growth and recruitment in Pontoporeia affinis (Lindstrom)
(Crustacea: Amphipoda) in relation to abundance fluctuations. J. Exp. Mar. Biol. Ecol. 101, 41–59.
˚ ¨ ¨ ¨ ¨ ¨
Segerstrale, S.G., 1937. Studien uber die Bodentierwelt in sudfinnlandischen Kustengewassern. III. Zur Morphologie und Biologie des Amphipoden Pontoporeia affinis, nebst einer Revision der Pontoporeia-Systematik. Soc. Sci. Fenn. Comment. Biol. (in German) 7, 1–183.
Siegfried, C.A., 1985. Life history, population dynamics and production of Pontoporeia hoyi (Crustacea: Amphipoda) in relation to the trophic gradient of Lake George, New York. Hydrobiologia 122, 175–180. Sly, P.G., Christie, W.J., 1992. Factors influencing densities and distributions of Pontoporeia hoyi in Lake
Ontario. Hydrobiologia 235 / 236, 321–352.
Smith, C.R., Brumsickle, S.J., 1989. The effects of patch size and substrate isolation on colonization modes and rates in an intertidal sediment. Limnol. Oceanogr. 34, 1263–1277.
Sparrevik, E., 1999. Sediment texture and cannibalism affect survival during moult in Saduria entomon (Isopoda). Mar. Biol. 133, 437–441.
Sparrevik, E., Leonardsson, K., 1998. Recruitment in the predacious isopod Saduria entomon (L.): alternative prey reduces cannibalism. J. Exp. Mar. Biol. Ecol. 221, 117–130.
Sparrevik, E., Leonardsson, K., 1999. Direct and indirect effects of predation by Saduria entomon (Isopoda) on the size-structure of Monoporeia affinis (Amphipoda). Oecologia 120, 77–86.
Systat for windows, 1992. Statistics, version 5 edition. Evanston, IL: Systat, Inc., 750 pp.
Taghon, G.L., 1982. Optimal foraging by deposit-feeding invertebrates: Roles of particle size and organic coating. Oecologia (Berlin) 52, 295–304.
Tevesz, M.S., McCall, P.L. (Eds.), 1983. Biotic Interactions in Recent and Fossil Benthic Communities, 1st Edition, Plenum, New York.
Turner, S.J., Grant, J., Pridmore, R.D., Hewitt, J.E., Wilkinson, M.R., 1997. Bedload and water-column transport and colonization processes by post-settlement benthic macrofauna: does infaunal density matter? J. Exp. Mar. Biol. Ecol. 216, 51–75.
Uitto, A., Sarvala, J., 1991. Seasonal growth of the benthic amphipods Pontoporeia affinis and P. femorata in a Baltic archipelago in relation to environmental factors. Mar. Biol. 111, 237–246.
Vriser, B., 1998. Meiofaunal recolonization of defaunated sediments: a field experiment, preliminary results. Periodicum Biologorum 100, 63–69.