Leaf gas exchange and water relation characteristics of field
quinoa (
Chenopodium quinoa
Willd.) during soil drying
C.R. Jensen
a,*, S.-E. Jacobsen
b, M.N. Andersen
c, N. Nu´n˜ez
a,
S.D. Andersen
a, L. Rasmussen
a, V.O. Mogensen
aaLaboratory for Agrohydrology and Bioclimatology,Department of Agricultural Sciences, The Royal Veterinary and Agricultural Uni6ersity,Agro6ej10,DK-2630Taastrup,Denmark
bCentro Internacional de la Papa — International Potato Center(CIP),A6.La Uni6ersidad795,Apartado1558,Lima12,Peru cResearch Centre Foulum,Danish Institut for Plant and Soil Science,PO Box25,DK-8830Tjele,Denmark
Received 17 June 1999; received in revised form 11 February 2000; accepted 1 March 2000
Abstract
The effects of soil drying on leaf water relations and gas exchange were studied in quinoa grown in pots with sandy soil and in lysimeter plots with sandy loam in the field. Midday values of leaf water potential (cl), leaf osmotic
potential (cp), relative water content (RWC), leaf conductance (gl), light saturated net photosynthesis (Asat), and
specific leaf area (SLA) were determined in fully watered and droughted plants. At branching, flowering and grain fillingglin leaves of fully watered plants varied from 0.3 to 1.0, 0.3 to 0.6 and 0.2 to 0.7 mol m2s−1andAsatvaried
from 18 to 34, 14 to 24 and 8 to 26mmol m2 s−1. In droughted plants stomatal closure began when leaf water
potential (cl) decreased below−1.2 to−1.6 MPa andAsatwas reduced to 5 – 10mmol m2s−1as a result of stomatal
closure, whencldecreased to−1.5 to −2.0 MPa. The osmotic potential at full turgor (cp100) decreased by age from
−1.0 to−1.4 MPa. During severe water stress quinoa maintained positive turgor down to a zero turgor leaf water potential value (cl0) of −1.8 MPa. Quinoa had a limited osmotic adjustment c
p
100 between fully watered and
droughted plants being 0.3 – 0.4 MPa at the most. During branching the turgid weight/dry weight (TW/DW) ratio decreased from 9 to 5. At flowering and grain filling the TW/DW ratio was low (4 – 6). The bulk elastic modulus (omax) determined at the beginning of the grain filling period was medium to high (18 – 22 MPa). SLA was high (23 – 21 m2
kg−1) during branching and decreased during the later growth stages. Conclusively, both high net photosynthesis
rates and SLA values during early vegetative growth probably result in early vigour of quinoa supporting early water uptake and thus tolerance to a following drought. The stomatal response of quinoa was insensitive to drought induced decrease of leaf water status. The leaf water relations were characterised by low osmotic potentials and low TW/DW ratios during later growth stages sustaining a potential gradient for water uptake and turgor maintenance during soil drying. © 2000 Elsevier Science B.V. All rights reserved.
Keywords:Leaf gas exchange; Water relation characteristics;Chenopodium quinoa
www.elsevier.com/locate/eja
* Corresponding author. Tel.: +45-35283392; fax: +45-35283384. E-mail address:[email protected] (C.R. Jensen).
C.R.Jensen et al./Europ.J.Agronomy13 (2000) 11 – 25
12
1. Introduction
In recent years there has been a growing inter-est for introducing so-called alternative crops in
Europe. One such crop is quinoa (Chenopodium
quinoa Willd) originating from the South Ameri-can highlands, where it has been cultivated by local farmers for several millennia. The Andes region is characterised by a harsh climate, with frequent periods of drought, imposing great de-mands on the local flora, and quinoa is therefore considered a hardy plant with good drought toler-ance (Galwey, 1989; Jacobsen, 1993; Jacobsen et al., 1997a,b, 1998). Previously, several investiga-tions have shown that quinoa is drought tolerant which has been attributed to morphological char-acteristics such as an extensive ramified root sys-tem and hygroscopic papillae on the leaf cuticula (Canahua, 1977; Espindola, 1986) but data on physiological response to drought are scarce (Vacher, 1998). However, until now few investiga-tions have been undertaken in order to study the leaf water relations of quinoa in the field and during the season.
Turgor maintenance during reduction in leaf water status due to drought was thought to be the means by which a plant maintains its metabolic processes and sustains its growth and survival (e.g. Hsiao et al., 1986; McCree, 1986). Turgor maintenance may be obtained by a sensitive stom-ata closure response induced by phytohormones generated in the roots (Jensen et al., 1998; Ali et al., 1999), osmotic adjustment (Ali et al., 1999) or facilitated by changes in cell wall properties (Cut-ler et al., 1977). Under limited water conditions, higher yield was obtained by wheat genotypes having high osmotic adjustment than low osmotic adjustment (Morgan et al., 1986). Furthermore, inherent low osmotic potentials will be a mean by which the plants can sustain a potential gradient for water uptake when the soil water potential is decreased during soil drying (Jensen et al., 1993; Shalhevet, 1993). Finally, high photosynthetic rates and specific leaf area (SLA) support early vigour important to drought resistance to a fol-lowing long lasting drought period in Mediter-ranean-type climate by reducing the amount of water lost by soil evaporation (Turner, 1997).
As gas exchange and water relations have not been studied in field quinoa as far as we know, the purpose of the present investigation was to study the effects of drought on leaf conductance, net photosynthesis and leaf water relations char-acteristics during drought at different stages of growth in field grown plants. Gas exchange and water relations characteristics of quinoa were compared with various cultivated crop species.
2. Materials and methods
A pot and a lysimeter experiment was con-ducted in the field at the experimental station Højbakkegaard of the Agricultural University,
KVL, 20 km west of Copenhagen (55°40% N;
12°18% E; 28 m above MSL). A mobile glass roof
automatically protected pots and lysimeter plots against rain. When rain ceased the roof was re-moved automatically.
2.1. Pot experiment
The quinoa variety Chenopodium quinoa Willd.
cv. Kankolla was sown on 20 May 1997, in pots and germinated 1 June 1997. Kankolla is a tradi-tionally grown variety of the Peruvian altiplano with a high level of drought and frost tolerance. The pots were fertilised with 3 g N, 1 g P and 3 g K per pot mixed into the soil. The pots contained a sandy soil (a coarse textured melt-water top sand from the Danish Governmental Research Station, Jyndevad) with a water content of 19
vol.% at field capacity (−0.01 MPa) and 5 vol.%
at permanent wilting (−1.5 MPa). The soil water
retention curve is shown in Fig. 1. Forty pots were used and each contained 21.6 kg of dry soil comprising 3.4% organic matter, 4.2% clay (0 – 2
mm), 3.8% silt (2 – 20mm), 10% fine sand (20 – 200
mm) and 78.7% coarse sand (200 – 2000 mm). The
1993) by withholding watering. The drought treat-ment was undertaken under moderate evaporative demands (Fig. 2).
2.2. Lysimeter experiment
Quinoa ( Chenopodium quinoa Willd. cv. KVL
205) sown on 20 May 1994 and emerged on 3 June 1994, was grown under temperate climatic conditions (Fig. 2). Seeds were sown at a density
of 30 grains m−1
with a row spacing of 12.5 cm,
i.e. 400 seeds m−2
. Prior to sowing 120, 30, 90
and 9 kg ha−1
of N, P, K and Mg, respectively, was applied. The experiment was established in 12
lysimeter plots (each 2×2 m2 area) on sandy
loam (Kristensen and Aslyng, 1971). At the bor-der of each lysimeter plot the protection areas were treated the same as the lysimeter plots. The sandy loam contained 3% organic matter, 16%
clay (0 – 2mm), 17% silt (2 – 20mm), 40% fine sand
(20 – 200mm) and 24% coarse sand (200 – 2000mm)
in the top soil (0 – 30 cm depth) and 20% clay,
17% silt, 43% fine sand and 20% coarse sand in the bottom layer (30 – 100 cm depth). The water content in this soil is 260 mm at field capacity
(−0.01 MPa) and 115 mm at permanent wilting
(−1.5 MPa), giving the plant available soil water
of 145 mm. The soil water retention curve is seen in Fig. 1.
Each lysimeter plot was supplied with an indi-vidually operated trickle irrigation system. Six plots were well-watered and six were equally treated with a single drought treatment and sub-jected to increasing soil water deficits at the late
anthesis/early grain filling (stage 12 – 14 according
to Jacobsen and Stølen, 1993). The drought treat-ment was undertaken under moderate evaporative demands (Fig. 2).
2.3. Plant water relations
Leaf water relation measurements were made during 4 h centred around solar noon. The leaf was enclosed in a polyethylene bag after gas ex-change measurement in the field, and immediately detached for measurement of its water potential
(cl) using a pressure chamber (Soil Moisture
Equipment, Santa Barbara, CA). After taking the water potential measurement, the leaf was divided into two parts, one of which was immediately plunged into liquid nitrogen and then transferred
to a freezer of −20°C for later osmotic potential
determination. The second half of the leaf was used for relative water content determination
[RWC=(FW−DW)/(TW−DW)]. To this end
the leaf sample was weighted (FW) and then floated on distilled water for 4 h at 22°C under dim light. The turgid weight (TW) was determined after blotting, and the dry weight (DW) was mea-sured after the samples had been dried for 24 h at 80°C. The one-sided area was measured by a leaf area meter (model 3050A, LiCor Inc. Lincoln NE). Specific leaf area (SLA) was calculated as leaf area per unit of dry mass.
To determine the osmotic potential, the frozen leaf was allowed to thaw for about 20 min before being pressed. Then the press sap was removed with a filter paper disc and sealed in a C-52 chamber (Wescor Inc. Logan, UT) and incubated at 22°C for 10 – 15 min before osmotic potential Fig. 1. Soil – water characteristic curve in sand (Hansen and
C.R.Jensen et al./Europ.J.Agronomy13 (2000) 11 – 25
14
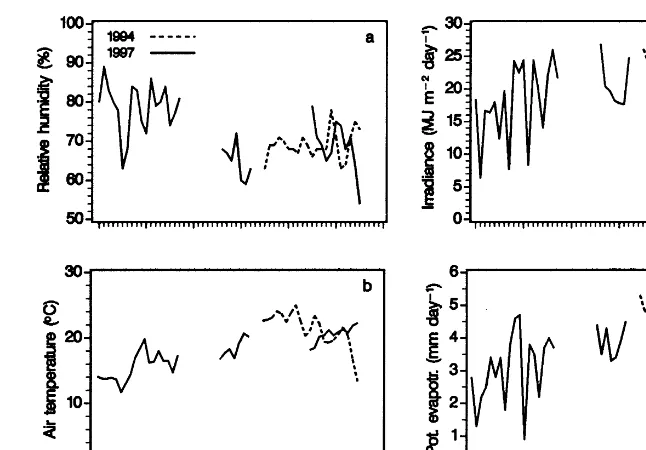
Fig. 2. Mean daily values of relative humidity (a), air temperature (b), irradiance ( c), and potential evapotranspiration as calculated by the equation of Penman (1956). · · · 1994 (lysimeter experiment). - - - - 1997 (pot experiment).
was read with a dew point microvoltmeter (HR – 33T, Wescor Inc., Logan, UT, USA). Leaf turgor
potential (cp) was obtained as: cp=cl−cp. The
osmotic potential at full hydration (cp100) was
calculated as: cp
100
=cp×RWC.
Water retention characteristics of leaves were assessed using pressure – volume (PV) curves ob-tained with a pressure chamber at the end of the drying period of the lysimeter experiment. Fully expanded upper leaves selected from the gross boundary layer of the crop were excised in dis-tilled water at dawn and rehydrated for 3 – 4 h in sealed glass in the dark. Drying of the leaves
between cl measurements took place on the
bench, and changes in leaf water contents were
determined by weighing immediately after the cl
determination with six replicates for every treat-ment. Each leaf was partially wrapped in a plastic sheet in order to decrease the rate of drying. Data for one PV-curve of each single leaf were obtained within 12 h.
By plotting 1/clversus RWC (type II
transfor-mation) a curve was obtained with an initially non-linear portion followed by and approximately linear section. The beginning of the linear portion
indicates the leaf water potential at the turgor loss
point (c0
leaf) and the RWC value at zero turgor
(RWC0
). Data points belonging to the turgor and zero turgor region were discriminated by eye. The
bulk elastic volumetric modulus (o) was defined
as:
o=Vdcp
dV
which is the change in turgor pressure (dcp) for
an infinitesimal change in symplastic water
con-tent (V) (Andersen et al., 1991). When RWC=1
then =max. It was assumed that the
relation-ship between cp and 1/RWCs, where RWCs is
relative symplastic water content, can be de-scribed by an exponential function. Hereby, at
RWCs=1−RWCa, where RWCa is the relative
apoplastic water content, the maximum turgor (cp(max)) is reached. The derivation of RWCa is given by Andersen et al. (1991). Turgor in the turgid region was described as:
cp=cp(max)e
b[RWCs−1−(1−RWCa)−1]
whereb, the sensitivity factor of elasticity, relates
exponential changes in turgor to changes in
2.4. Gas exchange measurement
Leaf conductance (gl) and photosynthesis (A)
were measured in 10 – 15 days old fully expanded upper leaves on attached leaves using the LI-6200 portable photosynthesis system (LiCor, Lincoln, NE) and a 250 ml cuvette. The leaves were posi-tioned within the gross boundary layer of the crop. Inside the cuvette the photosynthetic active radiation (PAR, 400 – 700 nm) was 87% of that outside. Only light saturated photosynthesis at
PAR\800 mmol m−2
s−1
was used. Leaf tem-perature varied between 27 and 33°C. Relative
humidity in the cuvette was 35 – 45%. [CO2] in the
cuvette was between 320 and 340 ppm. The gas exchange measurement was undertaken about 0.5 min after the leaf had been inserted into the cuvette. The standard calibration check was per-formed by the manufacturer before and after the growing season. No drift had occurred in the
water vapour and CO2 calibration curves. As a
daily routine a CO2 calibration check was
per-formed on the instrument. The boundary layer conductance in the cuvette as measured on
leaf-shaped humidified filter paper was 3.0 mol m−2
s−1
.
2.5. Nitrogen
The total nitrogen content in the dry matter was measured by the Kjeldahl method (Bremmer and Mulvaney, 1982).
2.6. Statistics
The experiment was arranged in a systematic block design with four to six replicates of each
treatment. Studentt-test was used to determine if
the means of the two treatments were different (SAS, 1988).
3. Results
3.1. Pot experiment
After onset of soil drying by withholding irriga-tion of the pots gas exchange and leaf water
relations of quinoa were measured during branch-ing (Fig. 3), flowerbranch-ing (Fig. 4) and grain fillbranch-ing (Fig. 5). Pot water use depended on plant size and evaporative demands (Fig. 2d). The periods of soil drying from field capacity until all plant available water had been used were 16, 6 and 10 days for the drying cycles at branching, flowering and grain filling, respectively (Figs. 3a, 4a and 5a).
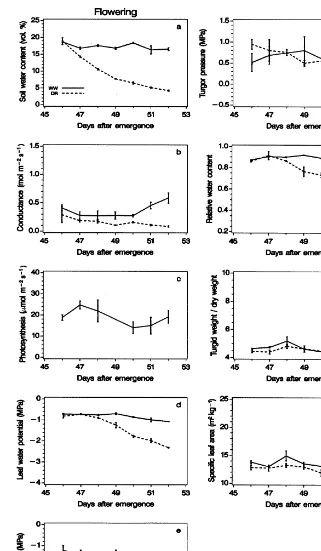
3.1.1. Leaf responses in fully irrigated plants At branching, flowering and grain filling under fully watered conditions in young fully developed leaves positioned in the gross boundary layer of
the atmosphere, leaf conductance (gl) varied from
0.3 to 1.0, 0.3 to 0.6 and 0.2 to 0.7 mol m−2 s−1
(Figs. 3b, 4b and 5b) while saturated net
photo-synthesis of CO2(Asat) varied from 18 to 34, 14 to
24 and 8 to 26 mmol m−2 s−1 (Figs. 3c, 4c and
5c). Due to a spell with high evaporative demands
(Fig. 2) gl closed at midday 24 – 26 days after
emergence (DAE).
Leaf water potential (cl) was high (−0.4 MPa)
during branching (Fig. 3d) as compared with
−0.8 to −1.0 MPa during flowering and grain
filling (Figs. 4d and 5d). Resistance to water transport in the young plants was probably less than at flowering and grain filling (reflected in high stomatal conductance, Fig. 3b), thus causing a lower potential gradient. The RWC was high (0.9) at all three growth stages (Figs. 3g, 4g and 5g). Despite similar levels of RWC leaf osmotic
potential (cp) was high (−1.2 to −1.4 MPa) at
branching and flowering (Figs. 3e and 4e) as
compared withcpat grain filling (−1.2 to −1.8
MPa) (Fig. 5e) resulting in a leaf turgor pressure
(cp) of similar size at the three growth stages (in
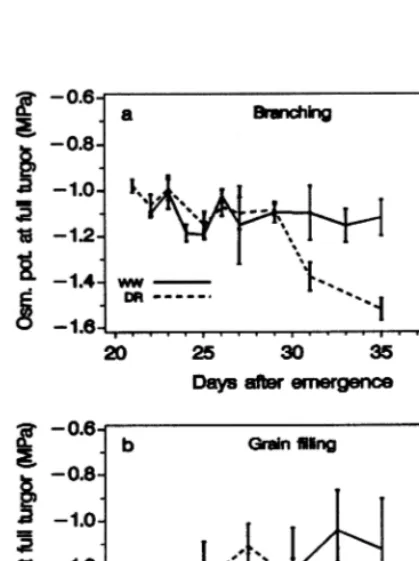
most cases 0.4 – 1.0 MPa) (Figs. 3f, 4f and 5f). The solute content of the leaves was built up during the season. Thus, the osmotic potential at full
turgor (cp
100
) varied between −1.0 and −1.4 in
fully watered plants during branching and grain filling (Fig. 6). In accord herewith the turgid
weight/dry weight ratio (TW/DW) decreased from
9 during early branching to 6 – 4 during later growth stages (Figs. 3h, 4h and 5h) reflecting the building up of solutes in the cells. Similarly, the
C.R.Jensen et al./Europ.J.Agronomy13 (2000) 11 – 25
16
C.R.Jensen et al./Europ.J.Agronomy13 (2000) 11 – 25
18
branching (Fig. 3i), while SLA was 20 to 14 m2
kg−1 at flowering and grain filling (Figs. 4i and
5i).
3.1.2. Stomatal response during soil drying At branching (at slow soil drying due to small plant size) beginning of stomatal closure occurred
31 DAE (Fig. 3b) when clwas about −1.2 MPa
(Fig. 3d). At flowering beginning of stomatal
clo-sure occurred 49 DAE (Fig. 4b) at a similar cl
value. At grain filling beginning of stomatal
clo-sure occurred 69 DAE when cl was about −1.6
MPa (Fig. 5d). Due to scatter thesecl-thresholds
for droughted plants were less clear when relating
gl to cl during the three growth stages (Fig. 7).
The initially high level of stomatal conductance atbranching resulted in the highest stomatal
con-Fig. 7. Single observations of leaf conductance as a function of leaf water potential during soil drying at branching, flowering and grain filling.
ductance at low leaf water potential of the three growth stages (Fig. 7).
3.1.3. Leaf water relations during soil drying
During soil drying cl decreased from about
−0.7 to −2.4 – (−3.2) MPa (Figs. 3d, 4d and
5d). cpdecreased from −1.1 to −2.7 MPa
dur-ing branchdur-ing (Fig. 3e), from −1.4 to −2.7 MPa
during flowering (Fig. 4e) and from −1.4 to
−3.5 MPa during grain filling (Fig. 5e). cp was
maintained positive during the main part of the drying cycles (Figs. 3f, 4f and 5f). During
branch-ing and grain fillbranch-ing cp
100 decreased to
−1.4 –
(−1.5) MPa indicating a moderate
non-signifi-cant level of osmotic adjustment of about 0.3 MPa (Fig. 6).
RWC was about 0.9 under fully watered condi-tions and decreased below 0.65 during branching and flowering (Figs. 3g and 4g). During grain filling severe soil drying was prolonged and RWC decreased below 0.3 (Fig. 5g). Under severe
drought TW/DW was only slightly influenced
(Figs. 3h, 4h and 5h), while SLA was decreased significantly at branching during the long drying cycle where new leaves might have developed during drought (Fig. 3i).
3.1.4. Final grain yield response
Final grain yield was 12.2 g plant−1in control
plants and it was significantly (PB0.05) increased
to 14.1 g plant−1 when exposed to soil drying
during branching, and it was significantly de-Fig. 6. Leaf osmotic potential at full turgor during soil drying
C.R.Jensen et al./Europ.J.Agronomy13 (2000) 11 – 25
20
creased to 9.7 and 4.1 g plant−1when exposed to
soil drying during flowering and grain filling, re-spectively. The latter low grain yield is probably due to the long lasting soil drying period (Fig. 5a). Stimulation of grain yield when crops have been exposed to drought during the vegetative stage of growth has earlier been found in several species (Turner, 1990).
3.2. Lysimeter experiment
The experiment was conducted during the late
anthesis/early grain filling stage.
3.2.1. Photosynthetic characteristics in fully irri -gated plants
During the investigated period N% in leaf dry matter decreased from 5 to 3% (Fig. 8e).In order
to further investigate gas exchange in quinoa Asat,
gl, SLA and N% were measured in fully watered
plants during early grain filling (growth stage 14)
(Table 1). The level of Asatwas similar to that at
similar growth stage in pot experiment (Fig. 5c)
while gl tended to be higher than in the pot
experiment (Fig. 5b). Photosynthetic WUE (Asat/
gl) was 1592.8 (S.E.M.) [mmol (CO2)
mol−1
(H2O)] and photosynthetic nitrogen use
efficiency (NUE) was 8.590.99 (S.E.M.) [mmol
(CO2) g
−1 (N) s−1].
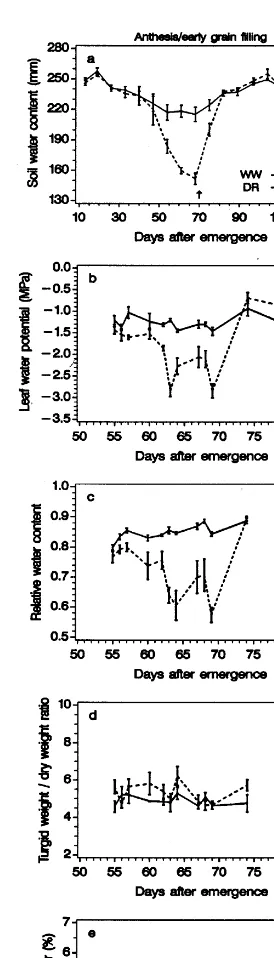
3.3. Water relations during soil drying
In fully watered plants midday values of cl
varied between −1.0 and −1.3 MPa (Fig. 8b)
and the relative water content (RWC) was 0.85 –
0.90 (Fig. 8c). The leaf turgor pressure (cp) was
0.1 – 0.6 MPa and the osmotic potential (cp) was
−1.3 to −1.6 MPa. Leaf water relations were
clearly affected by drought from about 61 to 63
DAE, where cl and RWC in stressed plants
dropped to −2.8 and 0.64 MPa, respectively
(Fig. 8b and c).
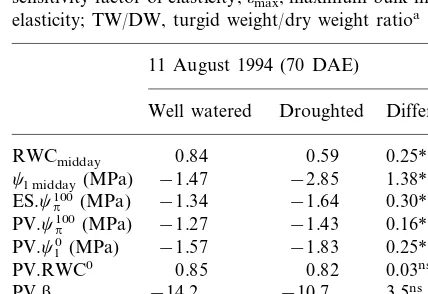
At the end of the drying period pressure – vol-ume (PV) analysis (Table 2) was undertaken in well-watered plants and in severely droughted plants just before rewatering. The droughted
plants had low middaycl(−2.9 MPa) and RWC
(0.59) values and were close to wilting. The analy-Fig. 8. Changes of soil water content (a), leaf water potential
R
.
Jensen
et
al
.
/
Europ
.
J
.
Agronomy
13
(2000)
11
–
25
21
Table 1
Photosynthesis (Asat), conductance (gl), photosynthetic WUE (Asat/gl), leaf nitrogen content (leaf N), photosynthetic nitrogen use efficiency (NUE), % N in dry matter, specific leaf area (SLA) and photon flux density (Q, 400–700 nm) during measurement of irrigated plantsa
WUE SLA
gl Leaf N NUE Q
Asat
Time of [N]
(mmol m−2s−1) (g m−2) (mmol (CO
2) (m2kg−1)
(mmol (CO2)
(mol m−2s−1) (mmol m−2s−1)
measurement (% in DM)
mol−1(H
2O)) g−1(N) s−1)
4.790.24 18.491.09 11689114 DAE 60–62 22.091.89 1.590.246 1592.8 2.690.20 8.590.99
15.2 4.3 18.9
29.2 2.3 1300–1600
1.2c 35c
Sunflower leavesb
aData are means9S.E.M. of five leaves.
C.R.Jensen et al./Europ.J.Agronomy13 (2000) 11 – 25
22
Table 2
Water relation characteristics of fully expanded quinoa leaves at early grain filling stage grown in sandy loam in the field as determined by expressed sap (ES) or pressure–volume (PV) technique from well watered and droughted treatments when nearly all plant available soil water had been used.cleaf, leaf water potential;cp100, osmotic potential at full hydration;cl0, leaf water potential at the turgor loss point; RWC, leaf relative water content; RWCa, leaf relative apoplastic water content; RWC0, relative water content at the turgor loss point; b, sensitivity factor of elasticity;omax, maximum bulk modulus of elasticity; TW/DW, turgid weight/dry weight ratioa
11 August 1994 (70 DAE)
Droughted Difference
aThe values are means based on data of six leaves from each treatment. *, ** differences significantly different from zero at the 0.05, 0.01 probability levels, respectively, using t-test to determine the significance levels (SAS, 1988).
4. Discussion
4.1. Photosynthesis and SLA
This study exhibited features which probably support drought tolerance in quinoa. When com-pared with photosynthetic characteristics of other dicots at early grain filling the photosynthetic characteristics of quinoa including photosynthetic WUE and NUE (Table 1) were within the range of other dicots (Jensen et al., 1996) but lower than found in the most efficient cultivated plants rape (Jensen et al., 1996) and sunflower (Freeden et al., 1991). However, during early branching in well watered plants the high rate of net photosynthesis
(Asat 18 – 34 mmol m2 s−1; Fig. 3c) together with
high SLA values (23 – 21 m2 kg−1; Fig. 3i) might
secure assimilates for rapid leaf expansion and root growth. Poorter and Remkes (1990) found that SLA was highly correlated with relative growth rate in 24 herbaceous species. As plants in drought prone areas often are planted after winter rain at high soil moisture content, features secur-ing rapid root and top growth after germination (early vigour) will cause that available moisture can be utilised ahead of loss due to deep drainage and soil evaporation. Such features of drought resistance have earlier been recognised in wheat. Biomass production at the five- to six-leaf stage was positively correlated with grain yield on deep sandy soils with poor water holding capacity (Turner and Nicolas 1987).
4.2. Stomatal response during soil drying
The stomatal response to soil drying indicated that quinoa had an insensitive stomatal response
as stomatal closure did not occur before cl was
below −1.2 to −1.6 MPa. This midday-cl
-threshold for stomatal closure during soil drying is similar to that in semidwarf-wheat genotypes as measured under glass-house conditions during the vegetative stage of growth (Shimshi et al., 1982; Henson et al., 1989) and to that in vegetative field sorghum predominantly grown under semi-arid conditions (Girma and Krieg 1992a,b). Thus, quinoa can be characterised as a crop tolerating dehydration as compared with other dicots, e.g.
sis showed an osmotic adjustment (cp100) of 0.16
MPa by the PV method which was supported by the extraction of sap (ES) method (0.30 MPa). Also, the level of osmotic adjustment was in agreement with the seasonal adjustment at the end of drying period of the pot experiment (Fig. 6).
The water potential at zero turgor (cl
0 ) in droughted plants decreased significantly by 0.25 MPa in sand relative to well-watered plants
(Table 2). Whencldecreased below thecl
0 value,
the leaves turned flaccid. There was no significant
difference in the TW/DW ratio and in omax
be-tween well-watered and droughted plants during the drying period. The relative apoplastic water
content (RWCa) was significantly decreased in
rape (Jensen et al., 1996) and lupins (Henson et al., 1989; Jensen et al., 1998). This makes it less likely that chemical signalling causes a first order of response to drought in quinoa as found lately in lupin (Jensen et al., 1998) and in temperate wheat (Ali et al., 1998).
4.3. Leaf water characteristics during soil drying
The levels of leaf water potential obtained here were in accordance with the results of Garcı´a et al. (1991), who showed that under irrigation
predawnclwas from −0.5 to −1.0 MPa and in
stressed conditions down to −1.5 MPa.cpoften
decreases as plant age and is lower in field plants than in glass house and climate chamber plants (Turner and Begg, 1981). This was also the case in
the present experiment as cp
100 decreased from
−1.0 MPa at early branching to −1.4 MPa
during grain filling (Fig. 6; Table 2). The level of osmotic adjustment was 0.3 – 0.4 MPa at the most (Fig. 6; Table 2); thus, the ability of osmotic adjustment of quinoa seems to be moderate. Nei-ther could Delatorre et al. (1997) demonstrate a significant osmotic adjustment in quinoa.
As determined by the PV-method the level of cp
100
found in quinoa is comparable to that found in monocotyledonous species grown in the field under temperate conditions, e.g. in barley, where cp
100 was also between
−1.0 and −1.3 MPa
(Andersen et al., 1991; Jensen et al., 1992), and in
wheat flag leaves of fully watered plantscp
100was
−1.2 MPa (Ali et al., 1999) and under semi-arid
conditionscp100was −1.1 MPa in wheat (Rascio
et al. 1988) and −0.8 MPa in field sorghum
(Girma and Krieg 1992a). In other cultivated C3
dicotyledonuos plants such as lupin and rapecp100
was only −0.7 and −0.9 MPa, respectively
(Jensen and Henson, 1990; Jensen et al., 1996). The low osmotic potential in itself will support the maintenance of the potential gradient for wa-ter uptake at low soil wawa-ter potential under high evaporative demands causing deficits in the plant (Shalhevet, 1993; Ali et al., 1999) as also envis-aged in modelling work (Jensen et al., 1993). Field studies have shown that wheat lines with a high degree of osmotic adjustment yielded up to 60% more than genotypes without this characteristic
under drought prone conditions (Morgan et al., 1986). Thus the inherent low osmotic potential in quinoa probably causes drought tolerance as in the case of lowering the osmotic potential by osmotic adjustment in wheat. However this de-pend partly on the bulk elastic modulus. The bulk
elastic modulus (omax) was higher (Table 2) than
values found in the dicot rape (15 – 17 MPa) (Jensen et al., 1996) and similar to values found in lupin (Jensen and Henson, 1990). However, in
droughted plants omax tended to decrease
non-sig-nificantly from 22 to 18 MPa (Table 2), which may have sustained turgor maintenance in the droughted plants, as the water potential at zero
turgor (cl
0) in droughted plants decreased
signifi-cantly. This way of turgor maintenance has also been described in other species (Jane and Green,
1983). Similarly, the low TW/DW ratio of 4 – 6 at
flowering and grain filling (Figs. 4h and 5h) (but not at branching, Fig. 3h) is comparable with the ratio of 4.0 in field wheat flag leaves (Ali et al., 1999). This suggests drought resistance, as small thick walled cells may be adapted to large losses of water without loss of turgor (Cutler et al.,
1977). The low TW/DW ratio of 4 – 6 probably
has caused the relatively high RWCa value of
14 – 19% (Table 2) as much of the apoplastic water is stored in the cell walls (Andersen et al., 1991).
References
Ali, M., Jensen, C.R., Mogensen, V.O., 1998. Early signals in field grown wheat in response to soil drying. Aust. J. Plant Physiol. 25, 871 – 882.
Ali, M., Jensen, C.R., Mogensen, V.O., Andersen, M.N., Henson, I.E., 1999. Root signalling and osmotic adjust-ment during soil drying sustains grain yield of field grown wheat. Field Crops Res. 62, 35 – 52.
Andersen, M.N., Jensen, C.R., Lo¨sch, R., 1991. Derivation of pressure – volume curves by a non-linear regression proce-dure, and determination of apoplastic water. J. Exp. Bot. 42, 159 – 165.
Bremmer, A.M., Mulvaney, C., 1982. Total nitrogen. In: Page, A.L., Miller, R.H., Keeney, D.R. (Eds.), Methods of Soil Analysis, Part 2: Chemical and Microbiological Properties. Agron. Monograph No. 9, second ed. American Society of Agronomy, Madison, pp. 595 – 624.
C.R.Jensen et al./Europ.J.Agronomy13 (2000) 11 – 25
24
Cutler, J.M., Rains, D.W., Loomis, R.S., 1977. The impor-tance of cell size in the water relations of plants. Physiol. Plant. 40, 255 – 260.
Espindola, G., 1986. Respuestas fisiologicas, morfologicas y agronomicas de la quinua al deficit hidrico. MSc thesis. Inst. De Ensenanza y Ciencias Agricolas, Chapingo, Mexico.
Delatorre, J., Riquelme, A., Tello, V., 1997. Determinacio´n del potencial osmo´tico en quinua (Chenopodium quinoa) con cuatro concentraciones de sodio. Proceedings de Congreso Internacional de Agricultura para Zonas Aridas, Arica, Chile, p. 24.
Freeden, A.L., Gamon, J.A., Field, C.B., 1991. Resonses of photosynthesis and carbohydrate partitioning to limita-tions in nitrogen and water availability in field grown sunflower. Plant Cell Environ. 14, 963 – 970.
Galwey, N.W., 1989. Quinoa. Biologist 36, 5.
Garcı´a, M., Vacher, J.J, Hidalgo, J., 1991. Estudio compara-tivo del comportamiento hı´drico de dos variedades de quinua en el altiplano central. Actas del VII Congreso Internacional sobre Cultivos Andinos, La Paz, Bolivia, p. 57 – 62.
Girma, S.F., Krieg, D.R., 1992a. Osmotic adjustment in sor-ghum. I. Mechanisms of diurnal osmotic potential changes. Plant Physiol. 99, 577 – 582.
Girma, S.F., Krieg, D.R., 1992b. Osmotic adjustment in sor-ghum. II. Relationship to gas exchange rates. Plant Phys-iol. 99, 583 – 588.
Hansen, S., Jensen, H.E., 1986. Spatial variability of soil water and evapotranspiration. Nordic Hydrol. 17, 261 – 268. Henson, I.E., Jensen, C.R., Turner, N.C., 1989. Leaf gas
exchange and water relations of lupins and wheat. I. Shoot responses to soil water stress. Aust. J. Plant Physiol. 16, 401 – 413.
Hsiao, T.C., Acevedo, E., Fereres, E., Henderson, D.W., 1986. Stress metabolism: water stress, growth and osmotic ad-justment. Phil. Trans. Royal Soc. Lond. B 273, 479 – 500. Jacobsen, S.-E., 1993. Quinoa, a Novel Crop for European
Agriculture. Ph.D. thesis. Department of Agricultural Sci-ence. The Royal Veterinary and Agricultural University, Copenhagen, Denmark.
Jacobsen, S.-E., Stølen, O., 1993. Quinoa — morphology and phenology and prospects for its production as a new crop in Europe. Eur. J. Agron. 2, 19 – 29.
Jacobsen, S.-E., Stølen, O., Mujica, A, 1997a. Mejoramiento de la productividad de (Chenopodium quinoa Willd.) con enfansis en la resistencia a seqia, frio y sales. Libro de resimenes, IX Congreso Internacional de Cultivos Andinos ‘‘Oscar Blanco Galdos’’, 22 – 25 April 1997, Cusco, Peru, p. 97.
Jacobsen, S.-E., Stølen, O., Mujica, A, 1997b. Mecanismos de resistencia a sequia en la quinua (Chenopodium quinoa Willd.). Libro de Resumenes de Ponencias, Congreso In-ternacional de Agricultura para Zonas Aridas, 14 – 16 May 1997, Arica, Chile, p. 68.
Jacobsen, S.-E., Nunez, N., Spehar, C., Jensen, C.R., 1998. Quinoa: A potential drought resistant crop for the
Brazil-ian savannah. International Conference on Sustainable Agriculture in Tropical and Subtropical Highlands with Special Reference to Latin America (SATHLA), 9 – 13 March 1998, Rio de Janeiro, Brazil.
Jane, G.T., Green, T.G.A., 1983. Utilisation of pressure vol-ume technique and non-linear least square analysis to investigate site induced stress in evergreen trees. Oecologia (Berlin) 57, 380 – 390.
Jensen, C.R., Henson, I.E., 1990. Leaf water relations charac-teristics ofLupinus augustifoliusandL.cosentinii. Oecolo-gia (Berlin) 82, 114 – 121.
Jensen, C.R., Andersen, M.N., Lo¨sch, R., 1992. Leaf water relation characteristics of differently potassium fertilized and watered field grown barley plants. Plant Soil 140, 225 – 239.
Jensen, C.R., Svendsen, H., Andersen, M.N., Lo¨sch, R., 1993. Use of the root contact concept, an empirical leaf conduc-tance model and pressure – volume curves in simulating crop water relation. Plant Soil 149, 1 – 26.
Jensen, C.R., Mogensen, V.O., Mortensen, G., Anderson, M.N., Schjoerring, J.K., Thage, J.H., Koribidis, J., 1996. Leaf photosynthesis, and drought adaptation in field grown oilseed rape (Brassica napus L.). Aust. J. Plant Physiol. 23, 631 – 644.
Jensen, C.R., Mogensen, V.O., Poulsen, H.-H., Henson, I.E., Aagot, S., Hansen, E., Ali, M., Wollenweber, B., 1998. Soil water matric potential rather than water content deter-mines drought responses in field-grown lupin (Lupinus angustifoliusL.). Aust. J. Plant Physiol. 25, 353 – 363. Kristensen, K.J., Aslyng, H.C., 1971. Lysimeters with rainfall
and soil water control. Nord. Hydrol. 2, 79 – 92. McCree, K.J., 1986. Whole-plant carbon balance during
os-motic adjustment to drought and salinity stress. Aust. J. Plant Physiol. 13, 33 – 43.
Morgan, J.M., Hare, R.A., Fletcher, R.J., 1986. Genetic varia-tion in osmoregulavaria-tion in bread and durum wheats and its relationship to grain yield of field environments. Aust. J. Agric. Res. 37, 449 – 457.
Penman, H.L., 1956. Evaporation: an introductory survey. Neth. J. Agric. Res. 4, 9 – 29.
Poorter, H., Remkes, C., 1990. Leaf area ratio and net assim-ilation rate of 24 wild species differing in relative growth rate. Oecologia 83, 553 – 559.
Rascio, A., Cedola, M.C., Sorrentino, G., Pastore, D., Wittmer, G., 1988. Pressure – volume curves and drought resistance in two wheat genotypes. Physiol. Plant. 73, 122 – 127.
SAS Institute Inc., 1988. SAS/STAT Users guide. Release 6.03 Edition. Cary, NC, P1028.
Shalhevet, J., 1993. Plants under salt and water stress. In: Fowden, L., Mansfield, T., Stoddart, J. (Eds.), Plant Adap-tation to Environmental Stress. Chapman & Hall, London, pp. 133 – 154.
Turner, N.C., 1990. Plant water relations and irrigation man-agement. Agric. Water Manage. 17, 59 – 73.
Turner, N.C., 1997. Further progress in crop water relations. Adv. Agron. 58, 293 – 338.
Turner, N.C., Begg, J.E., 1981. Plant-water relations and adaptation to stress. Plant Soil 58, 97 – 131.
Turner, N.C., Nicolas, M.E., 1987. Drought resistance of wheat for light-textured soils in a mediterranean climate.
In: Srivastava, J.P., Porceddu, E., Acevedo, E., Varma, S. (Eds.), Drought Tolerance in Winter Cereals. John Wiley, New York, pp. 203 – 216.
Vacher, J.J., 1998. Responses of two main Andean crops, quinoa Chenopodium quinoa Willd) and papa amarga (Solanum juzepczukii Buk.) to drought on the Bolivian Altiplano: significance of local adaptation. Agric. Ecosyst. Environ. 68, 99 – 108.