isprs archives XLI B7 763 2016
Teks penuh
Gambar
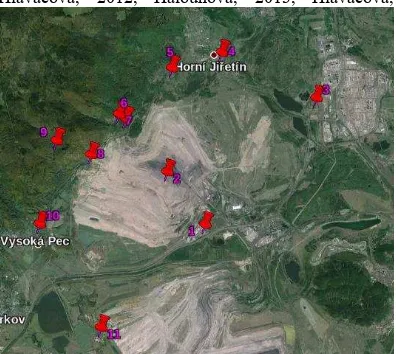
![Figure 3. Sentinel-1 estimated movements for reflectors 2-8 and 10-11 with regard to reflector 1 [cm]](https://thumb-ap.123doks.com/thumbv2/123dok/3281578.1402356/2.595.67.532.342.712/figure-sentinel-estimated-movements-reflectors-regard-reflector-cm.webp)

Dokumen terkait
The International Archives of the Photogrammetry, Remote Sensing and Spatial Information Sciences, Volume XLI-B8, 2016 XXIII ISPRS Congress, 12–19 July 2016, Prague,
The International Archives of the Photogrammetry, Remote Sensing and Spatial Information Sciences, Volume XLI-B8, 2016 XXIII ISPRS Congress, 12–19 July 2016, Prague,
The International Archives of the Photogrammetry, Remote Sensing and Spatial Information Sciences, Volume XLI-B7, 2016 XXIII ISPRS Congress, 12–19 July 2016, Prague, Czech
The International Archives of the Photogrammetry, Remote Sensing and Spatial Information Sciences, Volume XLI-B5, 2016 XXIII ISPRS Congress, 12–19 July 2016, Prague,
The International Archives of the Photogrammetry, Remote Sensing and Spatial Information Sciences, Volume XLI-B3, 2016 XXIII ISPRS Congress, 12–19 July 2016, Prague,
The International Archives of the Photogrammetry, Remote Sensing and Spatial Information Sciences, Volume XLI-B3, 2016 XXIII ISPRS Congress, 12–19 July 2016, Prague,
The International Archives of the Photogrammetry, Remote Sensing and Spatial Information Sciences, Volume XLI-B1, 2016 XXIII ISPRS Congress, 12–19 July 2016, Prague,
The International Archives of the Photogrammetry, Remote Sensing and Spatial Information Sciences, Volume XLI-B1, 2016 XXIII ISPRS Congress, 12–19 July 2016, Prague,
