Technical change in Senegal’s irrigated rice sector:
impact assessment under uncertainty
Monica G. Fisher
1, William A. Masters
∗, Mamadou Sidibé
1 Department of Agricultural Economics, 1145 Krannert Building, Purdue University, West Lafayette, IN 47907, USAReceived 19 October 1998; received in revised form 8 February 2000; accepted 24 February 2000
Abstract
This paper addresses the prospects for technical change in the irrigated rice sector of Senegal, and measures ex-ante the economic returns to recent research efforts. In 1994, three new rice varieties were released to farmers in the Senegal River Valley (SRV), the major irrigated rice region in Senegal. The productivity advantage of the new varieties is based primarily on early maturity, which permits double-cropping. (The seeds are also higher yielding than existing cultivars.)
We use a conventional [Akino and Hayami (1975), Am. J. Agric. Econ. 57, 1–10] partial-equilibrium model adapted to the Senegalese situation, to assess the social benefits of research and compare those to its costs in calculating the internal rate of return (IRR). To account for uncertainty regarding the future values of model variables we use simulation which allows us to generate a distribution of all possible outcomes of the IRR. We find that rice research is almost certain to have a very high payoff over the 1995–2004 period. The expected value of the IRR is calculated to be 121% per year, with a 97.5% probability that it lies above annual capital costs of 18%. © 2001 Elsevier Science B.V. All rights reserved.
1. Introduction
This paper addresses the prospects for technical change in the irrigated rice sector of Senegal, and measures the economic returns to recent research efforts. West African irrigation systems have long been seen as producing rice at very high cost relative to imports (e.g. Pearson et al., 1981), but technolog-ical innovations and policy reforms in the 1990s have dramatically raised rice productivity and increased efficiency. We document the recent and potential fu-ture economic gains from those changes, which have
∗Corresponding author.
E-mail address: [email protected] (W.A. Masters).
1Fisher and Sidib´e are graduate research assistants and Masters
is an Associate Professor in the Department of Agricultural Eco-nomics, Purdue University. www.agecon.purdue.edu/staff/masters.
made rice production more competitive and have generated large net social gains.2
While most of the variables and parameters involved in rate of return studies are highly uncertain, much of the literature on returns to agricultural research has treated both the research process and its setting as deterministic (Anderson, 1991). We adapt existing models to account for uncertainty in market condi-tions and agronomic variables. Projecting the future probability distributions of four key variables (world rice prices, yields, technology diffusion and area
2 The paper does not ask how trade policy changes would affect
rice production, or what is Senegal’s current comparative advantage in this sector. Those are separate questions, requiring different analytical methods. Instead, we focus specifically on the impact of R&D investments, which have proven to be both politically feasible and economically desirable given recent and likely future conditions in the rest of the economy.
expansion), we find that research undertaken in the 1990–1995 period is almost certain to have a very high payoff over the 1995–2004 period. In the con-text of a conventional Akino and Hayami (1975) partial-equilibrium model, we find the expected value of the internal rate of return (IRR) to this investment to be 121% per year, with a 97.5% probability that the rate lies above the annual costs of capital of 18% (which was the interest rate for loans with the national credit organization in Senegal in 1995). Agricultural research has been found to have similarly high pay-offs elsewhere, with IRR estimates ranging between 20 and 190% in the developing world (FAO, 1996).
The performance of the rice sector in Senegal, as in West Africa as a whole, is critical to the growth of the whole economy. Rice plays a key role in consumption and consumer expenditures (Kite, 1993; Randolph, 1997; Wilcock et al., 1997), rural employment and income generation, government investment and the trade balance (Kite, 1993; Reardon et al., 1997). With limited yield increases in the past, production growth has relied primarily on the expansion of cultivated area. But with increasing land scarcity, farmers are pushed onto marginal, lower quality lands resulting in land degradation (Reardon, 1995) and reduced production levels. To support a rising population, increased rice productivity is needed, made possible with new crop varieties accompanied by increased use of labor and other inputs.
The technology used for irrigated rice production in Senegal changed little in the late 1970s and 1980s. Appropriate new rice varieties were not available, and government restrictions reduced farmers’ incentives to change. In 1994, three new rice cultivars were re-leased to farmers in the Senegal River Valley (SRV), the major irrigated rice growing region in the coun-try.3 These Sahels, as they are called, were adapted to the agro-ecological conditions of the SRV by the West Africa Rice Development Association (WARDA) in collaboration with the national agricultural research organization, Institut Senegalais de Recherche Agri-cole (ISRA). The research approach of WARDA was to take the environmental constraints as given and then experiment with possibilities to decrease cycle-length, and improve yields, grain quality and adaptability to
3We use ‘cultivar’ and ‘variety’ interchangeably to refer to
subspecies types of cultivated rice, as is the accepted practice.
local conditions with improved genetic material from the International Rice Research Institute (IRRI) and the International Network for Genetic Evaluation of Rice (INGER).
The productivity advantage of the Sahels is based primarily on early maturity, which permits double-cropping.4 This is in contrast to Asian Green Revolution rice varieties whose productivity advan-tage is based primarily on fertilizer responsiveness. Yields of the Sahels are also higher than the existing cultivars, which were introduced to the SRV in the 1960s and 1970s.
Complementary to the research efforts of WARDA and ISRA is the Government of Senegal’s (GOS) move toward liberalizing the rice sector. Develop-ment planners hope that liberalization will increase efficiency in marketing and importation through in-volvement of the private sector, and with the end of price controls increase incentives to domestic pro-ducers. Appropriate macro and sectoral policies are expected to be positively related with the rate of return to investment (Kite, 1993).
In this context, we estimate the potential impact of research on the Sahels, using the IRR to measure in-vestment worth. Results of the study can help the GOS determine if research on the Sahels has been consis-tent with its goals, and provide information of use to donor agencies in their allocation of funds, research institutions in developing their research agendas, and others concerned with African development. Our in-corporation of uncertainty in the estimation of research impacts should also be useful in guiding future impact assessments in other countries.
1.1. Cultivar development in the SRV
Irrigated rice technology was introduced to the Sahel in the 1920s as a package consisting of Asian varieties, irrigation development, river regulation and partial mechanization. At that time, only low yielding indigenous rice varieties were cultivated by Sahelian farmers. The majority of the rice cultivars currently
4 Only one of the Sahels, Sahel 108, is of short enough duration
grown in the Sahel were obtained through WARDA coordinated trials in the 1970s and 1980s (WARDA, 1990–1993).
In the SRV, about 90% of all farmers use only one or two rice cultivars, medium-duration Jaya and short-duration I Kong Pao (IKP). Jaya, which was first imported to Senegal from India by a Senegalese official in 1970 (Dalrymple, 1986), is very high yielding with a potential of about 9 t/ha. It has high grain quality and thus favorable for consumption. Its two major weaknesses are intolerance to the saline conditions present in the Delta (northwestern SRV) and its long growth cycle which does not permit for double-cropping. IKP, which was brought to Senegal by a technical assistance mission from Taiwan a few years before the introduction of Jaya (Dalrymple, 1986), may be grown in any season and has a short cycle suitable for rice–rice double-cropping, but has poor grain quality and lower yield potential than Jaya. At least eight other rice cultivars have since been introduced, but adoption has been negligible primarily because these have not measured up to Jaya and/or IKP in terms of yield, stability or grain quality. Although Jaya and IKP have many favorable characteristics, new rice cultivars are needed for a variety of reasons. Agronomists at WARDA and ISRA state the need to broaden the genetic base of rice germplasm in order to decrease vulnerability to pests and disease, and the need for cultivars which are better adapted to specific agro-ecological conditions present in the SRV. There is also a need to improve grain quality as newly liberal-ized private mills are expected to initiate quality-based buying. Prior to reforms, farmers turned over all paddy production irrespective of quality to SAED, the government parastatal formerly responsible for irri-gation construction, extension, input distribution, and marketing and processing of rice in the SRV.
Of critical importance for increased rice produc-tivity and farm incomes is the release of new short duration cultivars that increase the possibility for rice–rice double-cropping. Whereas, in the past scien-tists focused on high yields for increased productivity, double-cropping is now recognized as being the key factor for intensification in the SRV.
Currently, there exist two common rice cropping patterns in the region. Some farmers produce only a single rice crop each year, usually during the wet (rainy) season. Others cultivate two rice crops a year,
but on separate fields. During the dry season, they cultivate rice on one field (what we here call a ‘dry season’ field) and before harvesting that crop they be-gin cultivation of a second wet season crop on a sepa-rate field (what we term ‘wet season’ field). Rice–rice double-cropping is practiced on a very limited basis.
Although irrigation development opened up the possibility for two rice growing seasons, several factors have prevented farmers from double-cropping (Le Gal and Papy, 1998). The main constraint has been insufficient time between dry season harvesting and rainy season land preparation with the current varieties. Other constraints include environmental constraints such as the extremely heavy winds at the start of the dry season, seasonal labor shortages, inad-equate knowledge of how to combine crop, soil and water management, and difficulties obtaining credit at the start of the dry season.
In 1994, WARDA and ISRA proposed three new cultivars: Sahel 108 (from Asian material), Sahel 201 (also from Asia), and Sahel 202 (from Nigeria). Sahel 108 is targeted for the dry season when short duration is important for enabling farmers to double-crop. Sahel 201 and Sahel 202 are medium duration and therefore for use in the longer, rainy season. Sahel 201 was introduced for tolerance to salinity with high yield and Sahel 202 for high yield with good grain quality.
The research strategy at WARDA was to identify IRRI and INGER varieties with at least the same yield potential as Jaya and IKP, but with improvements in other important criteria including adaptability to the varying agro-ecological conditions across the region, cycle length and grain quality. A succession of varietal evaluation and yield trials forms the central element of WARDA’s integrated research approach. Table 1 summarizes results from WARDA coordinated trials in the SRV.
Table 1
Cycle length and mean yield of new and existing cultivarsa
Season Duration type
Variety Cycle length (days)
Yield (t/ha)
Wet Short Sahel 108 113 6.118
IKP 116 5.213
Medium Sahel 201 124 6.088 Sahel 202 125 6.228
Jaya 123 4.913
Dry Short Sahel 108 119 5.395
IKP 127 4.857
aWARDA statistics from experiment station trials from 1988
to 1993.
moderately tolerant to saline conditions in ongoing experiments.
In 1995, the Sahels were released officially as varieties, increasing the technology options available to farmers in the SRV. During the dry season, farmers can choose to cultivate short duration cultivars: IKP and/or Sahel 108. With the shorter cycle of Sahel 108, double-cropping on the same field should be more feasible. During the wet season, farmers can choose to cultivate short and medium duration cultivars on their wet season field: the existing cultivars (Jaya, IKP) or the new cultivars (Sahel 108, Sahel 201 and Sahel 202).
Fig. 1. Economic surplus model.
1.2. The model
To evaluate the impact of the WARDA–ISRA work on rice, we develop an economic surplus model based on Akino and Hayami (1975), adapted to the Sene-galese situation. In the model, as in the real world, Senegal is a small-country in the trade of rice. It is ex-pected that Senegal will continue to import rice during the period of the analysis, and that the domestic price for rice will gradually adjust to the world rice price as structural adjustment measures are implemented. Social returns are measured in terms of the change in economic surplus that occurs as the rice supply curve pivots outward due to the upward shift in the rice production function associated with the technological change.
(farmers and local processors) receive for rice at that location. These prices determine the level of production and imports, but the social gains from research must be measured at the social opportunity cost of the imports displaced by increasing local production. This price P, is the world price of im-ports plus transport and marketing costs, net of taxes and tariffs which are transfers within the Senegalese economy.
In the absence of research, domestic production of rice is Qwo (where Pp and Swo intersect), rice con-sumption is C (where Pcand D intersect), and the gap between demand and supply is filled with imports in the amount QMwo. With research, domestic produc-tion is increased to Qw, consumption C remains the same, and Senegal continues to import to fill the ex-cess demand for rice, but at a lower level of QMw. Because innovation in Senegal does not influence the world price, the prices of rice remain constant. The gain in economic surplus is entirely producer surplus (area 0AB), and is not affected by the slope and po-sition of the demand curve as long as D intersects Sw to the right of Qw.
To estimate the model, we use constant elasticity supply functions and specify them as follows:
Qsw=GPγ (1)
Qswo=(1−h)GPγ (2)
whereQswis the supply with the Sahels,Qswothe sup-ply in the absence of technological change, P the eco-nomic price of rice produced in Senegal (the import parity price),γ the price elasticity of supply, G a con-stant which scales the price variable, and h represents the rate of shift in the supply function due to varietal improvement.
The relationship between the rate of shift of the sup-ply function (h) and the rate of shift of the production function (k), may be approximated as follows:
h≈(1+γ )k (3)
Using Eq. (3) and the supply function equations, we calculate the economic benefit of rice research, area
0AB, as follows:
where k is the rate of shift of the production function,
P the economic price, and Qw the quantity produced
with research, and we have assumed that the constant
c is equal to 0.
For each year of the analysis, we can estimate the rate of shift of the production function (parameter k) by averaging the yield differences between the Sahels and the existing cultivars weighted by the area planted in new varieties
where YE ,Sis the yield of the relevant existing cultivar for the given season (dry or wet), YN ,S the yield of Sahel 108, Sahel 201 or Sahel 202 in the given season, and LN ,Sis the proportion of area planted in the given Sahel cultivar during the particular season. The first part of the above equation accounts for single-crop effects, the second part for double-crop effects on the production function.
Because this is an ex-ante study we observe Qwo but not Qw. The relationship between the two supply functions may be used to obtain Qw as follows: Qsw=GPγ
the economic benefit it is necessary to subtract these costs as a separate step to obtain the net economic benefit.
1.3. Uncertainty and expected returns
We used the IRR to cumulate economic benefits and costs over time. The IRR is equivalent to the discount rate that makes the net present worth of the incremental benefit stream equal to 0 and may be calculated with the following formula:
n
X
t=1
Bt −Ct
(1+IRR)t =0 (7)
where Btand Ctare the benefits and costs in year t, and
n is the analysis period. The IRR criterion is to accept
all projects that have an IRR greater than or equal to the opportunity cost of capital, usually expressed as the interest rate (Gittinger, 1982).
Since this study is an ex-ante impact assessment calculation of the expected value of the IRR relied on projections of known values into the future (based on time series and/or cross-sectional data), and future estimates of currently unknown values based on ex-pert opinion. While most variables and parameters in-volved in rate of return studies are highly uncertain, analysts have often treated research and the research setting as deterministic (Anderson, 1991). Analysts of-ten report a single value of the IRR calculated at the expected values of the individual variables. However, the expected value of the IRR is not necessarily equiv-alent to the IRR calculated at the expected value of the variables because the IRR is a non-linear function of the uncertain variables.
In cases in which analysts have accounted for un-certainty in model variables, the traditional approach has been to conduct sensitivity analyses on selected variables individually or in combination, holding all other variables constant (e.g. Ayer and Schuh, 1972; Flores-Moya et al., 1978; Nagy, 1991; Traxler and Byerlee, 1992). The result is a set of IRR values, with the number of values equal to the number of sensitiv-ity analyses performed. The analytical limitations of sensitivity analysis are that it does not take account of the probabilities associated with each input variable value, and the technique is unable to account for all the potential outcomes of the different input variables simultaneously.
Fig. 2. Volatility of world rice prices over time.
We used Monte Carlo simulation to overcome the analytical limitations of sensitivity analysis. With Monte Carlo simulation, all valid combinations of input variable values are sampled to generate a prob-ability distribution of all possible outcomes of the IRR, showing the range of possible values of the IRR as well as the probability that each outcome will occur. Uncertainty in model results follows directly from uncertainty in the input variables, whose prob-ability distributions are specified explicitly, including possible covariance among variables.
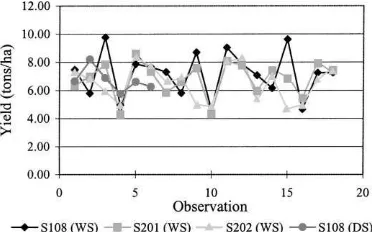
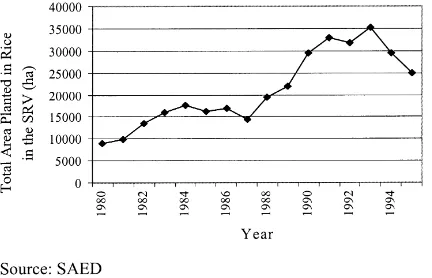
To focus on the variables whose uncertainty could have the greatest impact on model results, we selected four variables (world rice prices, yields, diffusion, and area expansion) based on the following criteria: past data which exhibits great volatility (world rice prices, yields, area expansion), no past data exists (diffusion), and the IRR is highly sensitive to changes in the vari-able (world rice prices, yields, diffusion, Figs. 2–4).
Fig. 4. Volatility of area expansion in the SRV (1980–1995). For each variable for which past data exist (world rice prices, yields, and area expansion), we assumed a normal distribution and used the available data to calculate the mean and standard deviation. World rice price data are from the Rice Outlook report of the Eco-nomic Research Service (1996), adjusted for shipping and handling into the St. Louis market as detailed in the data Appendices A and B.5 All yield data are from WARDA coordinated trials in the SRV. To calculate yield advantage for the single-crop component of pa-rameter k we used yield data from experiment station trials in the SRV (two stations, three trials per year from 1991 to 1993, with same treatment used on all varieties). For the double-crop component of param-eter k we used farm level yield data from 1995 rainy season trials on farmers’ fields using several different treatments. Data on area in rice come from SAED and cover the years 1980–1995.
In the case of future rates of diffusion in which we had to rely on expert opinion we assumed triangular distributions. The triangular distribution is frequently used when actual data is absent. WARDA provided us with estimates for the upper ceiling on adoption for each new variety, as well as the year in which they expect this upper ceiling to be reached. In order to be conservative, we assumed the WARDA figures are maximum values and then reduced these figures by 25
5Our calculations assume that rice continues to flow inland from
the port city (Dakar) to St. Louis, even after adoption of Sahel varieties. If the increased supply must be shipped to Dakar, then its value would fall by about 19,350 FCFA per ton (12% of farmgate prices). This change is unlikely to affect qualitative results, given the much larger variability in world rice prices already captured in the model and illustrated in Fig. 2.
Fig. 5. Estimated rate of diffusion of the Sahels, wet season and dry season (1995–2004).
and 50% to obtain the mode and minimum values for the triangular distribution.
For dry season, Sahel 108 we also needed to specify the percentage of overall adoption that is single ver-sus double-crop. We assumed a triangular distribution for the upper ceiling on adoption of double-crop Sahel 108 with minimum, mode and maximum values of 0, 25 and 50% of the upper ceiling level for Sahel 108 overall. The upper ceiling on adoption for single-crop Sahel 108 was then calculated as the difference be-tween Sahel 108 overall and double-crop Sahel 108.
For the first year of diffusion for each cultivar, we used fixed low estimates because of available infor-mation regarding severe credit constraints during this year with implementation of structural adjustment. We then assumed a linear increase from 1996 to 2000 (the year WARDA expects the upper ceiling to be reached) of the analysis. Estimates of the rate of diffusion are displayed in Fig. 5.
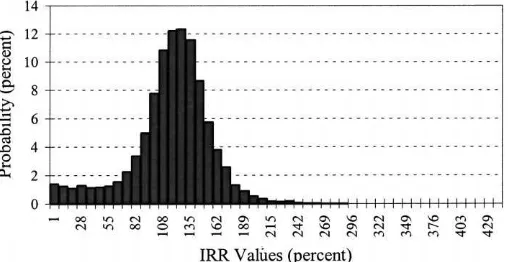
Fig. 6. Probability distribution of the IRR.
farmers adopt Sahel 108 only as the other Sahels are of medium duration and not appropriate for the short, dry season. Sahel 108 is then either single or double-cropped. It was not necessary to specify correlation between single and double-crop since we calculated diffusion of single-crop Sahel 108 as the difference between overall adoption of Sahel 108 and double-crop Sahel 108.
During the rainy season, farmers can adopt Sahel 108, Sahel 201 and Sahel 202. The relationship be-tween adoption of the three seeds is not evident. It could be that farmers adopt the three varieties together, implying a highly positive covariance. Alternatively, farmers may see them as substitutes for one another, implying a highly negative one. We assume a covari-ance of 0, implying an intermediate outcome.
2. Results
All the data on benefits and costs of rice research were entered into an Excel spreadsheet and @Risk software was used to perform simulation.6 Project-ing the future probability distributions and descriptive statistics of the four key variables, we found that re-search undertaken between 1990 and 1995 is almost certain to have a very high payoff over the 1995–2004
6Since simulation is a random process there will always be some
change in the IRR statistics with additional iterations. As more iterations are performed the results become more stable, but a 0% change in statistics with further iterations is not possible. We set the convergence threshold to a 0.5% change, the lowest possible in @Risk.
period.7 The expected value of the IRR is 121% with a standard deviation of 39%. This level of return on investment is impressive and provides strong evidence that research funds have been well spent. Furthermore, taking account of uncertainty by computing an ex-pected IRR over random variables does turn out to give a substantially different answer than computing a fixed IRR at the expected value of each variable, which in this case is 135%.
As is evident from Fig. 6, most of the probability mass falls into high values of the IRR. There are some extremely high values with a maximum sam-pled value of 447%. However, the probability of the IRR falling into the extremely high values is very low and over 95% of the sampled values are less than or equal to 175%.
There are also positive probabilities of attaining very low values of the IRR. The lowest sampled value of the IRR is 1.26%. However, there exists only a 2.5% chance that the IRR will fall below the interest rate of 18%. Thus, our results indicate that using the IRR criterion, there exists a 97.5% probability that the investment in rice research has been worthwhile.
As we expected, the IRR is highly sensitive to val-ues of the double-cropping variable. The only input variable significant with very low and very high val-ues of the IRR is the value of the upper ceiling of
7 We cut off the benefit/cost stream after 10 years. It is uncertain
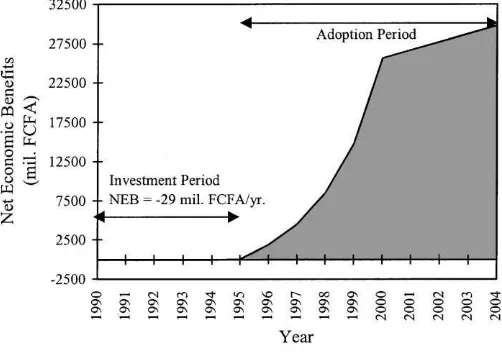
Fig. 7. Net economic benefits per year.
double-cropping. When the IRR is very low (below the 0.05 percentile), the upper ceiling for the proportion of rice area devoted to double-cropping has a median value of 10.5%. When the IRR is very high (above the 0.95 percentile), the corresponding median value is 11.0%. Thus, small changes in the upper ceiling of double-cropping lead to large changes in the expected value of the IRR.
The expected value of the net economic benefits are shown in Fig. 7. The first 5 years of the analysis is the investment period when WARDA carried out rice research on the Sahels. During that time no benefits are attained, thus net economic benefits are negative.
The 1995–2004 period is the adoption period. From 1995 to 2000, costs increase rapidly as extension costs are incurred to diffuse the seeds and adopters incur fixed and variable adoption costs. However, the annual rise in benefits is even more dramatic than the cost increase since farmers are able to produce significantly greater amounts of paddy with the short-duration, high yield Sahels. Thus, net economic benefits rise rapidly during the period.
In the year 2000, benefits begin to level off since the upper ceiling on diffusion has been reached. Costs drop and then level off as fixed costs of land expansion are eliminated and only variable costs of production remain. Net economic benefits continue to increase, but at a slower rate than previously.
In the longer term, beyond the analysis period, the net benefit curve will become negatively sloped and
fall to zero as the Sahels depreciate or become obsolete and are replaced with new varieties generated through research. Depreciation occurs because conditions are constantly changing and pests and weeds eventually evolve to overcome plant resistance. Technologies such as high yielding varieties become obsolete when they are replaced by improved varieties developed for the same conditions (Alston et al., 1995).
3. Conclusions and recommendations for further research
The rate of return to the WARDA–ISRA research on rice in Senegal is projected to be high, with a mean IRR value of 121%. This is an unusual but not un-precedented payoff, as the exhaustive survey of previ-ous studies by Echeverria (1990) finds returns to rice research programs from 16 to 133%. A key determi-nant of this result is the low cost and rapid success of the research program, made possible by WARDA’s use of pre-existing germplasm collection of rice from IRRI and INGER to identify cultivars that would per-mit double-cropping (for an overview of the IRRI pro-grams see Evenson and Gollin, 1997).
limit the expansion of cropped area onto marginal or forested lands.
Although there is likely to be considerable variation in the new varieties’ impact, both between households (for a review of this literature, see Freebairn, 1995) and within them (Saito and Spurling, 1992; and for a review of this literature, see Blumberg, 1991), more labor-intensive use of existing irrigation schemes is very likely to raise real wages among the poor.
High payoffs to Senegal’s rice program high-lights the importance of applied research addressing location-specific needs. A well-targeted program, borrowing from the global pool of germplasm and expertise to select key traits in a relatively brief pe-riod of time, can yield enormous benefits. Even under conditions of great uncertainty, the gains from such research are very likely to far outweigh the costs.
Acknowledgements
Many thanks are due to Tom Cusack, Salif Diack, Cynthia Donovan, Amadou Abdoulaye Fall, Kouamé Miézan, Tom Randolph, and John Sanders for provid-ing data and/or commentprovid-ing on earlier drafts.
Appendix A. Data sources
A.1. Import parity price
Calculation of the import parity price of milled rice was done as follows. We assumed a normal dis-tribution and then calculated the mean and standard deviation of the world FOB rice price (Thai 100% broken, milled rice) using data from the Rice Outlook reports of the Economic Research Service (marketing years 1981–1982 to 1995–1996). Since domestic rice is probably more highly valued by at least some con-sumers, this reference price gives us a lower bound on the opportunity cost of marginal supply at St. Louis. To compute trading margins we added onto the mean FOB price an estimated cost of freight and insurance (estimated from Rice Outlook reports), and then con-verted this figure to FCFA/t with the 1994 official exchange rate of 555.2 FCFA=US$ 1 (CIA, 1996). We then added to this CIF price all relevant costs to get the imported rice to the market in St. Louis in the SRV (port charges, insurance, handling and unloading,
transport to the St. Louis market). Then we deducted from the St. Louis market wholesale price all the rele-vant costs that would be necessary to get domestically produced paddy from the farm gate to the market in St. Louis (transport, processing, storage) to arrive at the import parity price at the farm gate. The latter cost data except for storage cost were obtained from Kite (1993) and were for 1991. To convert these values to 1994 FCFA we used a rate of inflation of 6.1% which is the 1995 estimate of the CIA (1996). No data were available for storage cost. We assumed a 10% storage loss and used the value of this loss for storage cost.
Calculation of import parity price of milled rice
Item Amount Source
FOB milled rice (Thai 100% broken) (US$/t)
304.80 a
+Freight and insurance (US$/t) 22.00 b Converted at 1994
official exchange rate (555.2 FCFA=US$ 1)
c
=CIF Dakar (at 1994 FCFA/t) 181439.36
+Port charges +Insurance (1994 FCFA/t) 923.26 d +Transport to market
in St. Louis (1994 FCFA/t)
9674.56 d
=Wholesale price at the St. Louis market (1994 FCFA/t)
197413.13
−transport to farm gate (1994 FCFA/t)
bAverage cost and freight, Thai 100% broken rice, 1983–1984 to 1992–1993 (Economic Research Service, 1996).
cCIA (1996) World Factbook.
dFrom Kite (1993); amounts converted to 1994 FCFA at 6.1% rate of inflation (CIA, 1996); distance from port in Dakar to St. Louis of 270 km from Kite (1993).
eWeighted average of distance from the two main rice production areas in the SRV (from WARDA); weights are the proportion of total SRV production (figures from SAED 1995–1996).
fCalculated as the value of a 10% storage loss.
A.2. Production
Since this is an ex-ante study, the available quantity data is for without research. Data for paddy produc-tion is available from SAED for the years 1980–1995 and is disaggregated by season. We regressed quan-tity on time (R2=0.67 for dry season and R2=0.68 for wet season) and then used the regression equation to predict without research quantity figures, by season, for years 1995–2004. We then added the seasonal fig-ures to obtain the yearly production figfig-ures. To convert the quantity of paddy figures to milled rice we used a 66% rate of transformation (recommendation of ISRA researchers). Quantity of milled rice produced with research was then calculated as
Qsw= Q s wo 1−h
A.3. Research and extension costs
Research costs include costs of both WARDA and ISRA. It is estimated that new variety testing takes 5–10 years. Since the Sahel materials were selections rather than crosses, the lower limit of 5 years was used. Research expenditures began in 1990, with re-gional adaptation testing and agronomic work contin-uing for 5 years until the introduction of the Sahels in 1995, when research on the Sahels was stopped. WA-RDA’s annual reports contain research program expe-nditures, 25% of which goes to the Sahel program. Using WARDA figures for the area in irrigated rice in each Sahelian country, an estimation of research costs specific to the SRV was calculated for each of the 5 years. For each year, this figure was divided by 4 since WARDA was involved in research on eight other
Sa-hels during this period. Because of difficulties obtain-ing research costs from ISRA and since it is expected that ISRA costs related to the Sahels were minimal, ISRA research costs were not included in the analysis. Extension costs (for additional distribution of seeds and demonstrations) were estimated by ISRA re-searchers at approximately 10 million FCFA/year. The costs of extension were included in the analysis for only the first 5 years following introduction of the seeds in 1995. After the first 5 years, farmer–farmer transfer should have more impact on diffusion of the seeds than extension. However, it is expected that the booming small-scale commercial seed sector will have a very much broader and faster impact on diffu-sion than either extendiffu-sion efforts or farmer-to-farmer transfer.
A.4. Costs of adoption
Switching from the use of existing varieties to the Sahels does not require increased inputs, and the cost of seeds is not higher. However, increased production associated with use of the Sahels requires additional labor for harvesting and threshing. Data for these costs were obtained from an ISRA report (Fall, 1996) and were multiplied by the increased production resulting from use of the Sahels.
Double-cropping costs of adoption are the variable costs of production: labor, seeds, fertilizer, irrigation costs. Variable costs were provided by an ISRA re-searcher and were in 1993 FCFA. We converted the cost figure to 1994 FCFA with an inflation rate of 6.1% (CIA, 1996) and multiplied this by the area double-cropped for each year of the analysis period. There are no fixed costs for double-cropping as it uses land that is already developed for use in the wet season.
A.5. Elasticities of demand and supply
The estimate for the price elasticity of demand,
Appendix B. @Risk spreadsheet
Year Sahel 108
dry season (t/ha)a
Averrage yield Sahel 108 wet season (t/ha)a
Average yield Sahel 201 wet season (t/ha)a
Average yield Sahel 202 wet season (t/ha)a
Average yield
(farm-level) Sahel 108 wet season (t/ha)a 1990
1991 1992 1993 1994
1995 6.330 7.15 6.809 6.503 6.340
1996 6.330 7.15 6.809 6.503 6.340
1997 6.330 7.15 6.809 6.503 6.340
1998 6.330 7.15 6.809 6.503 6.340
1999 6.330 7.15 6.809 6.503 6.340
2000 6.330 7.15 6.809 6.503 6.340
2001 6.330 7.15 6.809 6.503 6.340
2002 6.330 7.15 6.809 6.503 6.340
2003 6.330 7.15 6.809 6.503 6.340
2004 6.330 7.15 6.809 6.503 6.340
aYield data are from WARDA experiment station trials (two locations in SRV from 1991 to 1993); new technologies are Sahel 108, Sahel 201 and Sahel 202; old technologies are IKP and Jaya.
Year Average yield IKP
dry season (t/ha)
Average yield IKP wet season (t/ha)
Average yield Jaya wet season (t/ha)
1990 1991 1992 1993 1994
1995 5.9820 6.199 6.012
1996 5.9820 6.199 6.012
1997 5.9820 6.199 6.012
1998 5.9820 6.199 6.012
1999 5.9820 6.199 6.012
2000 5.9820 6.199 6.012
2001 5.9820 6.199 6.012
2002 5.9820 6.199 6.012
2003 5.9820 6.199 6.012
Year Yield advantage Sahel 108 dry seasona
Yield advantage Sahel 108 wet seasona
Yield advantage Sahel 201 wet seasona
Yield advantage Sahel 202 wet seasona 1990
1991 1992 1993 1994
1995 0.05 0.13 0.12 0.08
1996 0.05 0.13 0.12 0.08
1997 0.05 0.13 0.12 0.08
1998 0.05 0.13 0.12 0.08
1999 0.05 0.13 0.12 0.08
2000 0.05 0.13 0.12 0.08
2001 0.05 0.13 0.12 0.08
2002 0.05 0.13 0.12 0.08
2003 0.05 0.13 0.12 0.08
2004 0.05 0.13 0.12 0.08
aYield advantage calculated as: YA=1−(Y
o/Yn) where Yoand Ynare for old and new seeds.
Year Estimated rate diffusion double-crop Sahel 108 dry seasona
Estimated rate diffusion Sahel 108 dry seasona
Estimated rate diffusion single-crop Sahel 108 dry seasona
1990 1991 1992 1993 1994
1995 0.020 0.020 0.000
1996 0.076 0.061 0.015
1997 0.132 0.102 0.030
1998 0.188 0.143 0.045
1999 0.244 0.184 0.060
2000 0.300 0.225 0.075
2001 0.300 0.225 0.075
2002 0.300 0.225 0.075
2003 0.300 0.225 0.075
2004 0.300 0.225 0.075
Year Estimated rate diffusion Sahel 108 wet season
Estimated rate diffusion Sahel 201 wet season
Estimated rate diffusion Sahel 202 wet season
1990 1991 1992 1993 1994
1995 0.020 0.010 0.010
1996 0.054 0.023 0.031
1997 0.087 0.036 0.051
1998 0.121 0.049 0.072
1999 0.154 0.062 0.092
2000 0.188 0.075 0.113
2001 0.188 0.075 0.113
2002 0.188 0.075 0.113
2003 0.188 0.075 0.113
2004 0.188 0.075 0.113
Year Rice area expansion dry season (ha)a
Rice area expansion wet season (ha)a
Dry season land (ha)a
Wet season land (ha)a
Total land (ha)a 1990
1991 1992 1993 1994
1995 291.27 775.33 4750.0 20218.0 24968.0
1996 291.27 775.33 5041.3 20993.3 26034.6
1997 291.27 775.33 5332.5 21768.7 27101.2
1998 291.27 775.33 5623.8 22543.9 28167.8
1999 291.27 775.33 5915.1 23319.3 29234.4
2000 291.27 775.33 6206.4 24094.7 30301.0
2001 291.27 775.33 6497.6 24869.9 31367.6
2002 291.27 775.33 6788.9 25645.3 32434.2
2003 291.27 775.33 7080.2 26420.6 33500.8
2004 291.27 775.33 7371.4 27195.9 34567.4
Year Area in single-crop Sahel 108 dry season (ha)
Area in double-crop Sahel 108 dry season (ha)
Area in Sahel 108 wet season (ha)
Area in Sahel 201 wet season
Area in Sahel 202 wet season
1990 1991 1992 1993 1994
1995 95.00 0.00 404.36 202.18 202.18
1996 307.52 314.90 1123.14 482.85 640.30
1997 543.92 653.06 1893.87 783.67 1110.20
1998 804.20 1014.48 2716.55 1104.66 1611.90
1999 1088.37 1399.16 3591.18 1445.80 2145.38
2000 1396.43 1807.10 4517.75 1807.10 2710.65
2001 1461.96 1865.25 4663.12 1865.25 2797.87
2002 1527.50 1923.40 4808.50 1923.40 2885.10
2003 1593.04 1981.55 4953.87 1981.55 2972.32
2004 1658.57 2039.70 5099.24 2039.70 3059.55
Year Demand elasticitya Supply elasticityb Production function shift (k)c Supply function shift (h)d 1990
1991 1992 1993 1994
1995 −0.64 0.30 0.01 0.01
1996 −0.64 0.30 0.10 0.13
1997 −0.64 0.30 0.19 0.25
1998 −0.64 0.30 0.29 0.38
1999 −0.64 0.30 0.38 0.50
2000 −0.64 0.30 0.48 0.62
2001 −0.64 0.30 0.48 0.62
2002 −0.64 0.30 0.48 0.62
2003 −0.64 0.30 0.48 0.62
2004 −0.64 0.30 0.48 0.62
aDemand elasticity from Christopher Delgado, as cited Kite (1993). bSupply elasticity from Akino and Hayami (1975).
cFor each year, k is calculated as sum over new seeds of the diffusion rate times yield advantage; for double cropping yield advantage during the dry season is yield of Sahel 108 during dry season because prior to adoption farmers did not crop this land; no farm-level estimate of the Sahel 108 yield is available for the dry season.
Year Quantity paddy produced without (t)a
Quantity milled rice produced without (t)a
Quantity milled rice produced with (t)a 1990
1991 1992 1993 1994
1995 160289.03 105790.76 106579.13
1996 168424.20 111159.97 127766.82
1997 176559.38 116529.19 155904.10
1998 184694.55 121898.40 195080.92
1999 192829.73 127267.62 253379.83
2000 200964.90 132636.83 349320.76
2001 209100.08 138006.05 363461.47
2002 217235.25 143375.27 377602.17
2003 225370.43 148744.48 391742.88
2004 233505.60 154113.70 405883.59
aQuantity paddy produced without comes from SAED for 1981–1995; projected to 2004 (Rsq=0.67); world rice prices from Rice Outlook Report of the Economic Research Service (1996); paddy converted to milled rice at 66% transformation rate.
Year Price of Thai (100% broken)
milled rice (US$/t)
Import parity price Thai
(100% broken) milled rice (94 FCFA/t)
1990 1991 1992 1993 1994
1995 304.80 156754.15
1996 304.80 156754.15
1997 304.80 156754.15
1998 304.80 156754.15
1999 304.80 156754.15
2000 304.80 156754.15
2001 304.80 156754.15
2002 304.80 156754.15
2003 304.80 156754.15
Year WARDA research costs (milled 94 FCFA)a SAED/PNVA extension costs (milled 94 FCFA)a
1990 28.29
1991 28.29
1992 28.29
1993 29.01
1994 29.01
1995 10.74
1996 10.74
1997 10.74
1998 10.74
1999 10.74
2000 2001 2002 2003 2004
aWARDA costs come from their annual reports; in 1993 FCFA converted to 1994 FCFA with 6.1% inflation rate (CIA, 1996); extension costs estimated by ISRA researchers; in 1993 FCFA converted to 1994 FCFA with 6.1% inflation rate; irrigation set up cost estimated by ISRA researchers; in 1993 FCFA converted to 1994 FCFA with 6.1% inflation rate; per hectare variable costs come from Fall (1996); labor and transport costs come from Fall (1996); per unit costs of labor/transport originally in FCFA/ha; converted to FCFA/t at average yield of 4.9 t/ha, the average figure for 1990–1995 in SRV (SAED 1980–1995 data).
Year Per hectare variable costs (mil. 94 FCFA/ha)
Each year’s variable costs (milled 94 FCFA)
Per unit cost for extra labor and transport (milled 94 FCFA/t)
Each year’s extra labor and transp. costs (milled 94 FCFA)
1990 1991 1992 1993 1994
1995 0.23 0.00 0.0117 7.96
1996 0.23 73.91 0.0117 22.01
1997 0.23 153.27 0.0117 37.11
1998 0.23 238.10 0.0117 53.25
1999 0.23 328.38 0.0117 70.45
2000 0.23 424.12 0.0117 88.70
2001 0.23 437.77 0.0117 91.63
2002 0.23 451.42 0.0117 94.57
2003 0.23 465.07 0.0117 97.51
Year Economic benefit of rice research (milled 94 FCFA)
Cost of rice research and adoption (milled 94 FCFA)
Net economic benefit (milled 94 FCFA)
IRR
1990 28.29 −28.29 1.349
1991 28.29 −28.29
1992 28.29 −28.29
1993 29.01 −29.01
1994 29.01 −29.01
1995 95.06 18.70 76.36
1996 2002.46 106.65 1895.80
1997 4747.83 201.12 4546.72
1998 8824.36 302.09 8522.27
1999 15206.62 409.57 14797.06
2000 26127.77 512.82 25614.95
2001 27185.44 529.41 26656.03
2002 28243.11 545.99 27697.12
2003 29300.77 562.58 28738.20
2004 30358.44 579.16 29779.28
References
Akino, M., Hayami, Y., 1975. Efficiency and equity in public research: rice breeding in Japan’s economic development. Am. J. Agric. Econ. 57, 1–10.
Alston, J.M., Norton, G., Pardy, P.G., 1995. Science Under Scarcity: Principles and Practice for Agricultural Research Evaluation and Priority Setting. Cornell University Press, Ithaca, 585 pp.
Anderson, J. R., 1991. Agricultural research in a variable and unpredictable world. In: Pardey, P.G., Roseboom, J., Anderson, J.R. (Eds.), Agricultural Research Policy: International Quantitative Perspectives. Cambridge University Press, Cambridge, pp. 103–128.
Ayer, H.W., Schuh, G.E., 1972. Social rates of return and other aspects of agricultural research: the case of cotton research in Sao Paulo, Brazil. Am. J. Agric. Econ. 54, 557–569. Blumberg, R.L., 1991. Income under female versus male control.
In: Blumberg, R.L. (Ed.), Gender, Family and Economy: The Triple Overlap. Sage Publications, Newbury Park, pp. 97–127.
CIA, 1996. World Factbook. http://www.odci.gov/cia/publications/ nsolo/factbook/sg.htm.
Dalrymple, D., 1986. Development and spread of high-yielding rice varieties in developing countries. United States Agency for International Development, Washington, DC.
Echeverria, R.G., 1990. Assessing the impact of agricultural research. In: Echeverria, R.G. (Ed.), Methods for Diagnosing Research System Constraints and Assessing the Impact of Agricultural Research, Vol. 2. Assessing the Impact of Agricultural Research. ISNAR, The Hague, pp. 1–28. Economic Research Service, 1996. Rice situation and outlook
report. United States Department of Agriculture, Washington, DC.
Evenson, R.E., Gollin, D., 1997. Genetic resources, international organizations and improvement in rice varieties. Econ. Dev. Cultur. Change 45, 471–500.
Fall, A.A., 1996. Filiere riz dans la Vallee du Fleuve Senegal: couts de production. Institut Senegalais de Recherches Agricoles, Dakar, Senegal.
FAO, 1996. Role of research in global food security and agricultural development. http://www.fao.org/wfs/final/e/ volume2/t09b-e.htm.
Flores-Moya, P., Evenson, R.E., Hayami, Y., 1978. Social returns to rice research in the Philippines: domestic benefits and foreign spillover. Econ. Dev. Cultur. Change 26, 591–607.
Freebairn, D.K., 1995. Did the green revolution concentrate incomes? A uantitative study of research reports. World Dev. 23, 265–279.
Gittinger, J.P., 1982. Economic Analysis of Agricultural Projects, 2nd Edition. Johns Hopkins University Press, Baltimore, MD, 505 pp.
Kite, R., 1993. Senegal: implications for the rice policy dialogue. United States Agency for International Development, Dakar, Senegal.
Le Gal, P.Y., Papy, F., 1998. Co-ordination processes in a collectively managed cropping system: Double cropping of irrigated rice in Senegal. Agric. Systems 57, 135–159. Nagy, J.G., 1991. Returns from agricultural research and extension
in wheat and maize in Pakistan. In: Evenson, R.E., Pray, C.E. (Eds.), Research and Productivity in Asian Agriculture. Cornell University Press, Ithaca, pp. 93–113.
Pearson, S.R., Stryker, J.D., Humphreys, C.P., 1981. Rice in West Africa: Policy and Economics. Stanford University Press, Stanford, 482 pp.
(Eds.), Irrigated Rice in the Sahel: Prospects for Sustainable Development. West Africa Rice Development Association, Dakar, Senegal, pp. 71–88.
Reardon, T., 1995. Sustainability issues for agricultural research strategies in the semi-arid tropics: focus on the Sahel. Agric. Syst. 48, 345–359.
Reardon, T., Dione, J., Adesina, A., Tefft, J., 1997. Rice in West Africa before and after CFA franc devaluation: focus on CILSS countries. In: Miezan, K.M., Woperais, M.C.S., Dingkuhn, M., Deckers, J., Randolph, T.F. (Eds.), Irrigated Rice in the Sahel: Prospects for Sustainable Development. West Africa Rice Development Association, Dakar, Senegal, pp. 137–158.
Saito, K.A., Spurling, D., 1992. Developing Agricultural Extension for Women Farmers. The World Bank, Washington, DC. Traxler, G., Byerlee, D., 1992. Economic returns to crop
management research in a post-green revolution setting. Am. J. Agric. Econ. 74, 573–582.
WARDA, 1990–1993. Annual Report. West Africa Rice Development Association, Ivory Coast.