SATELLITE-BASED ASSESSMENT OF GRASSLAND YIELDS
K. Grant a, *, R. Siegmundb, M. Wagnerb, S. Hartmanna
a Bavarian State Research Center for Agriculture (LfL), Institute for Crop Science and Plant Breeding, 85354 Freising, Germany –
(Kerstin.Grant, Stephan.Hartmann)@lfl.bayern.de b
GAF AG, 80634 Munich, Germany – (Melanie.Wagner, Robert.Siegmund)@gaf.de
KEY WORDS: Radar, Change detection, Sentinel-1, Grassland, Cutting date, Forage yield model
ABSTRACT:
Cutting date and frequency are important parameters determining grassland yields in addition to the effects of weather, soil conditions, plant composition and fertilisation. Because accurate and area-wide data of grassland yields are currently not available, cutting frequency can be used to estimate yields. In this project, a method to detect cutting dates via surface changes in radar images is developed. The combination of this method with a grassland yield model will result in more reliable and regional-wide numbers of grassland yields. For the test-phase of the monitoring project, a study area situated southeast of Munich, Germany, was chosen due to its high density of managed grassland. For determining grassland cutting robust amplitude change detection techniques are used evaluating radar amplitude or backscatter statistics before and after the cutting event. CosmoSkyMed and Sentinel-1A data were analysed. All detected cuts were verified according to in-situ measurements recorded in a GIS database. Although the SAR systems had various acquisition geometries, the amount of detected grassland cut was quite similar. Of 154 tested grassland plots, covering in total 436 ha, 116 and 111 cuts were detected using CosmoSkyMed and Sentinel-1A radar data, respectively. Further improvement of radar data processes as well as additional analyses with higher sample number and wider land surface coverage will follow for optimisation of the method and for validation and generalisation of the results of this feasibility study. The automation of this method will than allow for an area-wide and cost efficient cutting date detection service improving grassland yield models.
* Corresponding author.
1. INTRODUCTION
1.1 Importance of cutting dates for grassland yield
Grassland ecosystems support human, fauna and flora populations worldwide by providing numerous goods and services such as provision of forage for livestock, wildlife habitats, and biodiversity conservation (White et al., 2000). In Bavaria (Germany), grassland covers 34% of the agricultural land area and contributes primarily to the production of forage for the dairy and meat industry (StMELF, 2014). Despite the economic importance of Bavarian grassland, actual and area-wide data of grassland yield is not available (Diepolder et al., 2013). Detailed grassland harvest quantification is missing because, in contrast to other agricultural products (e.g. grain, maize, sugar beets), grassland forage does not enter the market and usually remains on the farm. Therefore, quantification techniques such as scales or sensors are generally not in practice. Cutting date and frequency are important parameters, which determine grassland yield, in addition to the effects on yield of climate, soil, plant composition and fertilisation. These parameters would be required for yield modelling (e.g. see yield model in Herrmann et al., 2005). Furthermore, in the absence of yield data, cutting frequency is currently used to estimate amounts of fertiliser for managed grassland (Wendland et al., 2012). This is necessary because, by state regulation, fertilisation must be oriented on the anticipated nutrient requirements based on actual nutrient discharge via harvest. Thus, information on cutting frequencies might also assist in plausibility tests for fertilizer use. However, a method to record dates when grass is harvested over large areas would not only improve estimations of grassland yields and sustainable use of fertiliser, but could also be relevant for questions of nature conservation (Herben and Huber-Sannwald, 2002). Thus, it is necessary to find a cost- and time-efficient method to detect cutting dates for whole regions or countries.
1.2 Sentinel-1
Remote sensing techniques are useful to monitor surface changes for large areas. So far, it has been very expensive to get the necessary satellite images with high time resolutions for wide areas. The new European earth observation programme Copernicus has developed a set of satellites (called Sentinel), which will cover the entire world’s land masses at least on a bi-weekly basis. The European Space Agency and the European Commission provide the data obtained with Sentinels on an open and free basis (DLR, 2014). The first Copernicus satellite, Sentinel-1A, carrying a C-band radar system, was launched in April 2014 and radar images are now available routinely every 12 days and systematically for land monitoring (ESA, 2014). Together with the identically constructed Sentinel-1B (launch 2016) the revisit time of each point will be shortened to 6 days. Thus, this study aims to investigate the applicability of Sentinel-1A radar data for the derivation of agricultural information as they offer a great potential for research across regions.
1.3 Radar & grassland cuts
This study focusses on the detection of cutting dates in grasslands as changes in the radar backscatter. Cutting of grass significantly affects the vegetation structure and surface of the grassland (height, density, shape) and therefore results in changes of the backscatter intensity of the radar signals. By comparing the reflection signals over a set of radar images acquired at a high temporal sampling frequency or with short time interval, cuts are expected to be detectable using change detection techniques. The application of change detection methods is therefore promising since the cuts and harvest events are temporally sampled in an adequate way.
The International Archives of the Photogrammetry, Remote Sensing and Spatial Information Sciences, Volume XL-7/W3, 2015 36th International Symposium on Remote Sensing of Environment, 11–15 May 2015, Berlin, Germany
This contribution has been peer-reviewed.
2. TEST-PHASE – GRASSLAND CUT DETECTION 2.1 Acquisition plan
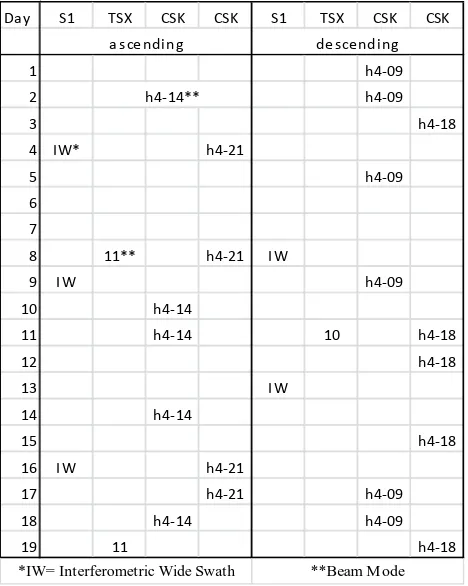
In order to achieve a high monitoring potential a variety of operational SAR systems are used. For the test-phase, specifically to increase the temporal acquisition frequency, the high resolution X-band systems COSMO-SkyMed (CSK) and TerraSAR-X (TSX) are utilised. Future operational monitoring will exploit the C-band system Sentinel-1 (A and B) plus optional X-band acquisitions. During the test-phase a multimission acquisition plan (Table 1) will be used in a way that for given harvest periods of three weeks the subsequent scheme will be applied. Begin and end of these periods are determined according to reports of contract farmers. Validation of cutting dates is done by in-situ measurements and reports of date and location of grassland cuts in the study area.
Table 1. Acquisition plan for one harvest period using TerraSAR-X (TSX), Sentinel-1A (S1) and COSMO-SkyMed (CSK) system; study area can be acquired with CSK using
*IW= Interferometric Wide Swath **Beam M ode
A feasibility study was done using CSK and Sentinel-1 radar images from October 2014 during the last grassland cuts in a study area south-east of Munich, Germany.
2.2 Feasibility study
2.2.1 Incoherent monitoring
The acquisition capacity of a multi-mission exercise provides a flexible basis to map and monitor both continuous, as well as episodic, events with a high degree of flexibility and agility plus a high unmatched revisit rate with multiple data take opportunities (DTO) for any location. Due to the robustness of the monitoring approach change detection is applied for the
same systems and similar acquisition geometries only. Therefore only comparisons of the same beam modes and sensors are made. The approach continues recent investigations to apply SAR-satellite monitoring to the European subsidy control system (INVEKOS), in which the potential of COSMO-SkyMed data were evaluated for its integration in operational INVEKOS tasks or in precision farming support systems in study areas in Germany (Britti et al., 2011, Cesarano et al., 2011, Strehl, 2012, Wagner, 2014). In the present case changes in backscatter – resulting from cutting of the grass layer – is derived from robust amplitude change detection methods, i.e. amplitude ratios. It is assumed that the high acquisition rate samples grassland cutting events sufficiently in a way that changes in density of the vegetation are mapped prior to significant /full regrowth. During our test phase the change detection technique and relevant optimisation methods, such as filter settings, are validated. The determination of changes is performed based on a plot level (field boundaries) using spatial statistics over the amplitude variation and is indicated in the field layer. The resulting change map is verified using all available in-situ data.
2.2.2 COSMO-SkyMed data
COSMO-SkyMed Images of the 3rd and 15th October 2014 were evaluated. All images were HH polarized X-band full-resolution data acquired in HImage mode. The SAR data was in Single Look Slant Range Complex format in product level 1A. The average ground range and azimuth resolution of the imagery are 2 m and 2.8 m, respectively. Both acquisitions were recorded at 16:58 (UTC) with a scene centre incidence angle of 46°.
2.2.3 Sentinel-1A data
Sentinel-1 data for 5th and 17th October 2014 were retrieved from the ESA archive and evaluated. Both images were VV/VH polarized C-band high-resolution data acquired in the interferometric wide swath mode. The data was in ground range detected (GRD) format and product level 1. The average ground range and azimuth resolution of the imagery are 20 m and 22 m, respectively. Both acquisitions were recorded at 05:26 (UTC).
2.2.4 Field data – grassland cuts
Grassland plots in the study area were surveyed in-situ between 30th September and 13th October 2014 for cutting activities. Dates and location of grassland cuts were noted on a map. In a next step, this information was digitalised resulting in a shapefile for further analysis in a GIS environment. During this time period, cuts on 154 grassland plots were detected.
2.2.5 SAR data processing
COSMO-SkyMed
The CSK images were georeferenced using a digital terrain model (Range Doppler Terrain Correction, SRTM) and reprojected to the coordination system 3-degree-Gauss-Krüger zone 4. For analysis and comparison the radar images were radiometrically calibrated. The corrected amplitude data was resampled to 3 m and transformed to the logarithmic scale (unit dB). Speckle was reduced with an adaptive Frost filter (window size 7*7). All image processing was performed with SARscape (ENVI) and ERDAS Imagine. Radar data was exported as GeoTIFF (unsigned 8bit) to visualize and analyse data in a GIS environment.
The International Archives of the Photogrammetry, Remote Sensing and Spatial Information Sciences, Volume XL-7/W3, 2015 36th International Symposium on Remote Sensing of Environment, 11–15 May 2015, Berlin, Germany
This contribution has been peer-reviewed.
Sentinel-1
Sentinel-1 data was pre-processed using data conversion and orthorectification processes implemented in SARscape. Data was georeferenced using a digital terrain model (Range Doppler Terrain Correction, SRTM) and reprojected to the coordination system 3-degree-Gauss-Krüger zone 4. For analysis and comparison the radar images were co-registered. For each image, both polarisation channels (VV and VH) were radiometrically corrected and exported as sigma0 (σ0) values (unit dB).
Grey level statistic
Radar data was overlaid with a shapefile including the grassland plots with cutting dates from in-situ measurements. The grey values of each image represent the strength of the radar return. For a qualitative comparison grey level statistics were calculated for each grassland plot illustrating the backscatter or intensity change before and after an area of grassland had been harvested.
2.3 Results
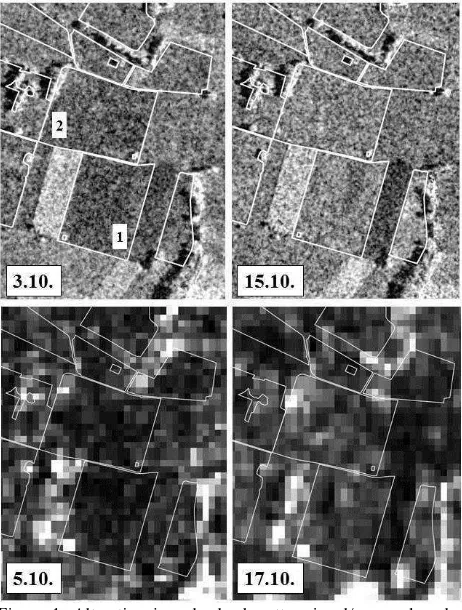
Alterations in the grey values of radar images of both systems (CSK, Sentinel-1) showed modified radar backscatter signals due to surfaces changes in the test area (example see Figure 1). These changes were caused by grassland cuttings, which could be verified by in situ measurements. In order to estimate the separability of cut and uncut grassland, mean grey values of each image were extracted and compared (example in Table 2).
Figure 1. Alteration in radar backscatter signal/grey value by grassland cuts in a part of the study area; images: CosmoSkyMed: 3rd and 15th October 2014; Sentinel-1A: 5th and 17th October 2014 VV polarized; in situ measurements detected grassland cut on plot 1 on 6th and plot 2 between 10th)
Of 154 tested plots (covering in total 436 ha) 116 and 111 cuts were detected with CSK and Sentinel-1 data comparison, respectively. Neither CSK nor S1 grey value analyses resulted in the detection of cuts on 25 grassland plots. Furthermore, 18 cuts were missed by Sentinel-1 but not by CSK. In contrast, 13 cuts were detected by Sentinel-1 but not by CSK.
Table 2. Grey value comparison for the two grassland plot samples (see Figure 1); given are in-situ detected cutting date, grey value mean and differences extracted from CosmoSkyMed images of 3rd and 15th October 2014 as well as from Sentinel-1A data of 5th and 17th October; negative value in grey value and sigma0 (for Sentinel-1A) difference indicates grassland cuts
Plot Cutting date sigma0
3.10. 15.10. difference 5.10. 17.10. difference difference
1 6.10. 80 127 -47 16 27 -11 -27.1 2 10.10. 90 133 -43 17 30 -13 -32.6 *after adap tive Frost-filtering
CosmoSky M ed*
Grey value mean
Sentinel-1A
According to the sigma0-values (VV polarization), 151 plots showed an increase in the radar backscatter amplitude. Therefore, the difference between 5th and 17th October were negative, also indicating the grassland cuts on these plots (example in Table 2).
2.4 Discussion
This feasibility study showed that grassland cuts can be detected using radar images of chronologically close dates. So far, change detection with both SAR systems with a revisit time of 12 days resulted in the retrieval of about 74% known grassland cuts. Although the systems had various acquisition geometries (e.g. differences in polarisation, wave length, spatial resolution), the amount of detected grassland cut was quite similar. Further analysis has to show, if specific field conditions such as low grass height difference, environmental condition (wind, soil type, moisture, trees) or management practices let to the missing of 25 grassland cuts by both SAR systems (Bouman & van Kasteren, 1990a, b). The 18 cuts only missed by detection with Sentinel-1A data (S1) might be caused by the coarse resolution or differences in wave length. Zoughi et al., (1987) reported that in contrast to X-Band, soil and its properties was the dominant factor in backscatter from grass canopy at C-Band. Reason for the detection of 13 cuts by S1 but not by CSK might be the VV polarisation. Horizontal polarisation seems to be more sensitive to horizontally oriented target components such as soil surface, therefore vertical polarisation might result in stronger backscatter from the upper portion of grass canopy (Zoughi et al., 1987). However, due to the coarse resolution of S1 data, the grey value mean results from fewer pixels per plot compared to CSK data. Therefore, the statistics of S1 data are not as reliable as of CSK data. Further analysis with a higher sample number and wider land surface coverage is necessary for validation and generalisation of the results of this feasibility study. The detection rate of 74% is not yet sufficient for reliable estimation of cutting frequencies. However, the radar data processing could be further optimized for instance by filtering or using coherence information. Coherent monitoring was out of scope for the recent study conclusion, though the applicability of those techniques will be conducted during further steps of the test phase. Grassland is a dynamic system and plants are continuously growing (up to 10-20 cm in a week at optimal conditions). Enhancing the revisit times (e.g. 6 days instead of 12 with additional Sentinel-1B data) and thus using a set of radar images acquired at a higher temporal sampling frequency,
The International Archives of the Photogrammetry, Remote Sensing and Spatial Information Sciences, Volume XL-7/W3, 2015 36th International Symposium on Remote Sensing of Environment, 11–15 May 2015, Berlin, Germany
This contribution has been peer-reviewed.
changes in grassland growth might be better incorporated. In this context, it should be mentioned that, in October, the height difference in grassland before and after the cut is usually not very pronounced (10-15 cm). Therefore, the detection rate of this feasibility study is reasonable. For annual grassland yield the first cut in the year is the most important, usually contributing 25-40% depending on the management intensity. Then, pre- to post cut height difference is generally about 30 to 50 cm. Thus, a higher detection rate for the first cut can be expected.
3. OUTLOOK – YIELD ESTIMATION
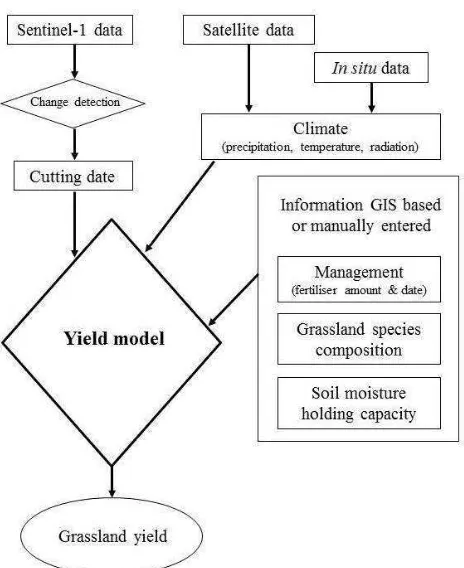
The improved and automated method for grassland cutting date detection based on Sentinel-1 radar data will be integrated in a grassland yield and quality model such as used by Herrmann et al., (2005). The main model parameters are the satellite-based cutting date information in addition to climate and site specific data retrieved from state or national geographic information systems (Figure 2). Then, yield and quality estimations can be calculated area-wide
Figure 2. Outline of improved and regionalized grassland yield model
In addition, a yield prognosis model with a web interface might be developed using this model to predict the best date (in terms of yield and quality) for the next cutting for single grassland plots. Radar information could be used to set the starting point for the model run. If known, farmers might add more detailed information of their grasslands to further improve the estimation.
ACKNOWLEDGEMENTS
This project was funded by the German Federal Ministry of Economic Affairs and Energy as part of the program “GMES – Dienste für den öffentlichen Bedarf” (FKZ 50EE1318). We thank all farmers in the study area for their assistance.
REFERENCES
Bouman, B., van Kasteren, H., 1990a. Ground-Based X-Band (3-cm Wave) Radar Backscattering of Agricultural Crops. I. Sugar Beet and Potato; Backscattering and Crop Growth,
Remote Sensing of Environment, 34, pp. 93-105
Bouman, B., van Kasteren, H., 1990b. Ground-Based X-Band (3-cm Wave) Radar Backscattering of Agricultural Crops. II. Wheat, Barley, and Oats; The Impact of Canopy Structure.
Remote Sensing of Environment, 34, pp. 107–119.
Britti, F., Ligi, R., Rossi, L. Monaldi, G., 2011. New GAEC controls through high revisit SAR: COSMO-SkyMed in support to agro-environmental analysis and monitoring, GEOCAP
Conference, Tallin
Cesarano, L., Pietranera, L., Britti, F., Gentile, V., 2012. Time and resolution: COSMO-SkyMed VHR data in support to precision farming applications – North Germany Pilot Project,
GEOCAP Conference, Tallin
Diepolder, M., Raschbacher, S., Heinz, S., Kuhn, G., 2013. Rohproteinerträge und –gehalte bayerischer Grünlandflächen In: Mehr Eiweiß vom Grünland und Feldfutterbau Potenziale, Chancen und Risiken, Schriftenreihe der Bayerischen
Landesanstalt für Landwirtschaft, 6/2013, pp. 136-140
Herrmann, A., Kelm, M., Kornher, A., Taube, F., 2005. Performance of grassland under different cutting regimes as affected by sward composition, nitrogen input, soil conditions and weather—a simulation study, European Journal of
Agronomy 22, pp. 141-158
StMELF (Bayerisches Staatsministerium für Ernährung, Landwirtschaft und Forsten) 2014. Bayerischer Agrarbericht 2014, http://www.agrarbericht-2014.bayern.de/landwirtschaft-laendliche-entwicklung/index.html (25.03.2015)
Strehl, F., 2012. Monitoring of agricultural fields using very
high resolution SAR-data, Bachelor thesis, University of
Applied Sciences Munich
Wagner, M., 2014. Potential analysis of COSMO-SkyMed VHR
data for substituting optical data in remote sensing based agricultural subsidy control, Master thesis, HafenCity
University Hamburg.
Wendland, M., Diepolder, M., Capriel, P., 2012. Leitfaden für
die Düngung von Acker- und Grünland – Gelbes Heft, LfL-
Information, Bayerische Landesanstalt für Landwirtschaft, Freising, pp. 1-97
White, R., Murray, S., Rohweder, M., 2000. Pilot analysis of
global ecosystems: grasslands ecosystems, World Resources
Institute, Washington, DC, pp. 1-69
Zoughi, R., Bredow, J., Moore, R., 1987. Evaluation and comparison of dominant backscattering sources at 10 GHz in two treatments of tall-grass prairie, Remote Sensing of
Environment, 22, pp. 395-412
The International Archives of the Photogrammetry, Remote Sensing and Spatial Information Sciences, Volume XL-7/W3, 2015 36th International Symposium on Remote Sensing of Environment, 11–15 May 2015, Berlin, Germany
This contribution has been peer-reviewed.