Lipoprotein-associated phospholipase A
2, platelet-activating factor
acetylhydrolase: a potential new risk factor for coronary artery
disease
Muriel J. Caslake
a,*, Chris J. Packard
a, Keith E. Suckling
b, Stephen D. Holmes
c,
Paul Chamberlain
c, Colin H. Macphee
baDepartment of Pathological Biochemistry,4th Floor QEB,Glasgow Royal Infirmary Uni6ersity NHS Trust,Glasgow,UK bDepartment of Vascular Biology,SmithKline Beecham Pharmaceuticals,New Frontiers Science Park North,Third A6enue,Harlow,
Essex CM19 5AW,UK
cDepartment of Antibody Technology,SmithKline Beecham Pharmaceuticals,New Frontiers Science Park North,Third A6enue,Harlow,
Essex CM19 5AW,UK
Received 12 January 1999; received in revised form 21 June 1999; accepted 28 September 1999
Abstract
A specific and robust immunoassay for the lipoprotein-associated phospholipase A2 (Lp-PLA2), platelet-activating factor acetylhydrolase, is described for the first time. The immunoassay was used to evaluate possible links between plasma Lp-PLA2 levels and atherosclerosis risk amongst susceptible individuals. Such an investigation was important because Lp-PLA2participates in the oxidative modification of low density lipoprotein by cleaving oxidised phosphatidylcholines, generating lysophosphatidyl-choline and oxidised free fatty acids. The majority of Lp-PLA2 was found associated with LDL (approximately 80%) and, as expected, enzyme levels were significantly positively correlated to LDL cholesterol. Plasma Lp-PLA2 levels were significantly elevated in patients with angiographically proven coronary artery disease (CAD) when compared with age-matched controls, even though LDL cholesterol levels did not differ significantly. Indeed, when included in a general linear model with LDL cholesterol and other risk factors, Lp-PLA2appeared to be an independent predictor of disease status. We propose, therefore, that plasma Lp-PLA2mass should be viewed as a potential novel risk factor for CAD that provides information related to but additional to traditional lipoprotein measurements. © 2000 Elsevier Science Ireland Ltd. All rights reserved.
Keywords:Lipoprotein-associated phospholipase A2; Potential new risk factor; Coronary artery disease
www.elsevier.com/locate/atherosclerosis
1. Introduction
Various dyslipidaemias exist that increase the predis-position of an individual to develop atherosclerotic coronary artery disease (CAD). Elevated plasma levels of low density lipoprotein (LDL) cholesterol have been shown in many studies to be associated with an in-creased incidence of CAD whereas plasma high density lipoprotein (HDL) levels are inversely related to risk [1,2]. Not surprisingly, plasma concentrations of apolipoprotein (apo) B and A-1, the major protein components of LDL and HDL, respectively, are also
accepted risk factors for CAD. The precise pathophysi-ological mechanisms through which dyslipidaemias in-crease the likelihood of atherosclerosis remain poorly understood, but the oxidative modification of LDL within the arterial wall appears to play an important role [3,4].
Attention has recently focused on three lipoprotein-associated enzymes that can participate in the LDL oxidation process and as a consequence modulate the many pro-inflammatory activities of oxidised LDL (oxLDL). For instance, much of the protective activity of HDL against oxLDL has been attributed to the presence of paraoxonase and lecithin-cholesterol acyl-transferase (LCAT), two enzymes found exclusively on HDL. Paraoxonase hydrolyses and inactivates pro-inflammatory lipid peroxides present in oxLDL [5,6],
* Corresponding author. Tel.: +44-141-211-4596; fax: + 44-141-553-2558.
E-mail address:[email protected] (M.J. Caslake)
and it was recently demonstrated that paraoxonase-null mice were more susceptible to atherosclerosis than wild-type littermates [7]. LCAT, known for many years to be responsible for plasma cholesteryl ester production, has also been shown to degrade both platelet activating factor (PAF) and oxidised polar phospholipids [8], two proposed atherogenic mediators [9].
The third enzyme thought to be intimately involved in LDL oxidation is the lipoprotein associated phos-pholipase A2 (Lp-PLA2), PAF acetylhydrolase. This
enzyme, unlike the other two, is found predominately on LDL [10] and as such is better placed to participate directly in any oxidative modification process. Previous work has demonstrated that this phospholipase A2 is
responsible for much if not all of the increased lysophosphatidylcholine content of oxidatively modified LDL [11 – 13]. It is also now recognised as a subtype of the growing phospholipase A2 superfamily [14] with a
broad substrate preference because it can hydrolyse both PAF as well as more complex polar phosphatidyl-cholines [12,13,15]. The role of Lp-PLA2in
atherogene-sis is currently under some debate because it can apparently play a dual function. Since much of the pro-atherogenic activity of oxidised LDL has been at-tributed to its increased lysophosphatidylcholine con-tent, this PLA2would appear to be pro-inflammatory in
nature [16]; paradoxically, the ability of Lp-PLA2 to
hydrolyse PAF and related phospholipids also suggests an anti-inflammatory role [9,17]. More recently, Lp-PLA2has also been shown to release bioactive oxidised
free fatty acids during the oxidation of LDL [13] thus providing further support for the pro-inflammatory argument.
To help resolve this apparent paradox we have devel-oped a specific ELISA to measure Lp-PLA2 mass to
evaluate the potential link between plasma Lp-PLA2
levels and individuals with atherosclerosis. Previous studies have shown that the plasma degradation of PAF is increased in patients with atherosclerosis [18 – 20] and stroke [21], but there was no information on the identity of the enzyme involved. By directly measuring Lp-PLA2mass we demonstrate that plasma Lp-PLA2is
an independent predictor of CAD and provides infor-mation additional to LDL cholesterol.
2. Methods
2.1. Subjects
A total of 148 male subjects, aged 39 – 74 years, from Glasgow, UK were recruited into the study. They were drawn from to one of three groups. (1) Subjects (n= 48) with CAD were identified from those who attended for coronary angiogram at the Glasgow Royal Infir-mary and met the entry criteria of a positive angiogram
at age B55 years. To be referred for angiography in local practice, individuals have symptoms of angina and a positive angiogram is recorded if stenotic disease is present. The severity of disease was not recorded in this study. The mean age at blood sampling was 5598 years. (2) Post myocardial infarction (PMI) patients (n=46) were recruited from the coronary rehabilitation classes at the Glasgow Royal Infirmary. They were at least 1 year post event which had taken place at age B55 years. The mean age at sampling was 5498 years. (3) Fifty-four normal aged matched subjects (53910 years) were recruited from the local community. Blood pressure measurements were taken and a record of history of smoking and medication was collected by questionnaire. No patients in the CAD and PMI group had diabetes but one in the control group was receiving insulin. Treatment with nitrates, aspirin andb-blockers were similar in diseased subjects, with nine in each group undergoing treatment. One subject in the PMI and two in the CAD groups were being treated with simvastatin and one in the CAD was taking ciprofi-brate.
Blood samples (30 ml) were drawn after an overnight fast into K2 EDTA at a final concentration of 1 mg/ml
and the plasma was analysed for lipids, lipoproteins and apolipoproteins immediately. Aliquots (1 ml) of plasma were fast frozen in liquid nitrogen and stored at −70°C. These frozen samples were transported monthly on dry ice to SmithKline Beecham Laborato-ries in Welwyn, Herts. for analysis of Lp-PLA2. The
identity of the samples was blind to the workers analysing Lp-PLA2 levels.
2.2. Lipoprotein, lipid, and apolipoprotein measurements
Assays of plasma cholesterol, triglyceride, VLDL cholesterol, LDL cholesterol and HDL cholesterol were performed by a modification of the standard Lipid Research Clinic’s protocol [22]. Apo AI and B were measured by immunoturbidimetry using kits purchased from Orion Diagnostics, Espoo, Finland.
2.3. Monoclonal antibody (Mab)generation
Lp-PLA2 was purified to homogeneity from human
LDL exactly as described previously [12]. Mice were immunised with 25 mg of purified, non-denatured, hu-man Lp-PLA2in Freund’s complete adjuvant followed
for large scale production. Monoclonal antibodies (50 – 100 mg) were purified from the tissue culture medium by Protein A chromatography (Prosep-A, Bioprocess-ing, Consett, UK) and isotyped using a standard kit produced by Amersham (Amersham, UK). The mono-clonal antibodies used in the assay were IgG and were named Mab 2C10 (first antibody) and Mab 2B4 (sec-ond antibody).
2.4. Reagents for immunoassay
Microtitre plates, the plate washer and fluorimeter were from Wallac (Turku, Finland). The plate-shaker incubator was purchased from Amersham. The coating buffer was 50 mM NA2HPO4, 150 mM NaCl, and
0.02% Kathon (Rohm and Haas, London, UK), pH 7.4. The blocking buffer was 50 mM Tris – HCl, 150 mM NaCl, 1% bovine serum albumin and 0.02% Kathon, pH 7.4. The wash solution contained 10 mM Tris – HCl, 150 mM NaCl, 0.05% Tween 20, and 0.02% Kathon, pH 7.4. The assay buffer used was 50 mM NA2HPO4, 150 mM NaCl, 20 mM CHAPS, 0.5%
bovineg-globulin, and 0.02% Kathon, pH 7.4. The Eu buffer consisted of 50 mM Tris – HCl, 150 mM NaCl, 0.5% bovine serum albumin, 0.05% bovine g-globulin, 0.01% Tween 40, 20mM diethylenetriaminepentaacetic acid, and 0.02% Kathon, pH 7.4. Biotinylated anti-Lp-PLA2 Mab 4B4 was prepared using a kit supplied by
Amersham.
2.5. Lp-PLA2 two site immunoassay procedure
Microtitre plate wells were coated with the first Mab 2C10 (4 mg/ml, 100 ml/well) overnight at 4°C after which the contents of the well were aspirated and 250ml per well of blocking buffer added for 60 min at 22°C. The wells were washed four times and 50 ml biotin labelled second monoclonal antibody 4B4 (2 mg/ml in assay buffer) and 50 ml purified recombinant Lp-PLA2
standards (0.3 – 30 ng/ml), plasma (diluted 1/100 in assay buffer) or SMART fraction (diluted 1/10 in assay buffer), was added and the wells incubated for 60 min at 22°C. The plate wells were washed four times and 100 ml per well of Eu-streptavidin (200 ng/ml, Wallac) was added and incubated for 30 min at 22°C. After the immunoreaction was complete the wells were washed four times and 200ml per well of enhancement solution (Wallac) added and after a 5 min incubation the fluorescence was measured. The fluorimeter software was used for curve fitting and result calculations.
2.6. Lipoprotein fractionation
Plasma samples were thawed, placed on ice, and filtered using a 0.3 mM sterile filter. Plasma was frac-tionated into its lipoprotein components by gel filtra-tion on a Pharmacia FPLC SMART system. Routinely 30 ml of filtered plasma was analysed using a Superose 6PC 3.2/30 column equilibrated at 15°C with 150 mM NaCl, 1 mM EDTA, and 0.05% Na azide, pH 8. Lipoproteins were eluted at a flow rate of 30ml/min and the fractions corresponding to VLDL, LDL, and HDL pooled based upon protein (absorbance at 280 nm), cholesterol and Lp-PLA2 activity profiles.
2.7. Lp-PLA2 assays
Either 50 ml aliquots of whole plasma or 30ml of the fractionated lipoprotein pools were assayed using 50 mM PAF as described previously [12].
2.8. Statistics
Group differences were explored by ANOVA using Tukey’s and Fishers method for pairwise comparison. Regression analysis and correlation coefficients were obtained for continuous variables. All statistical tests were performed using Minitab version 10.0. The ability of a parameter to predict disease was tested by entering variables into a general linear model.
3. Results
3.1. Lp-PLA2 two-site immunoassay
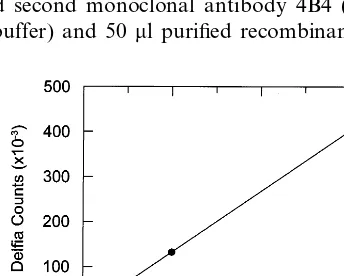
Fig. 1 shows that the Lp-PLA2calibration curve was
linear over the range 0.3 – 30 ng/ml. The lowest calibra-tor had counts approximately five times above back-ground. Excellent linearity of dilution was observed and the within- and between-assay coefficient of varia-tion was 4 and 9%, respectively (n=27). The recovery of Lp-PLA2 added to 10 different patient samples was
9598%. Zero cross-reactivity in the assay was noted at a 1000-fold excess with three different human
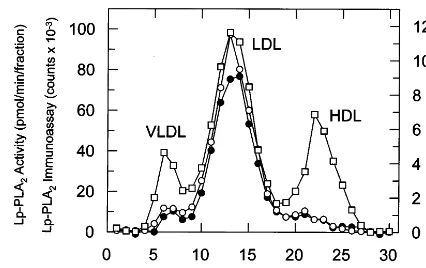
Fig. 2. Distribution of Lp-PLA2activity (), Lp-PLA2mass ( ) and cholesterol () following gel filtration of human male plasma. Plasma (30ml) was applied to a Superose 6 column and eluted with 150 mM NaCl, 1 mM EDTA, and 0.05% Na azide, pH 8. Fractions were collected and assayed for cholesterol content, Lp-PLA2 mass using the new two-site immunoassay, and Lp-PLA2 activity as de-scribed in Section 2.
zyme is calcium-independent and has 40% amino acid identity with Lp-PLA2 [24].
Fig. 2 demonstrates, as expected, a clear co-elution of Lp-PLA2 activity with immunoassay derived Lp-PLA2
mass following separation of plasma lipoprotein frac-tions by FPLC. Most of Lp-PLA2 is in the LDL size
range.
3.2. Analysis of patient data
3.2.1. Lipids, lipoproteins, and apolipoproteins
There were no significant differences between nor-mals and the control groups in age or blood pressure (Table 1). However, the number of smokers was higher in the diseased groups compared to control with 42% of the PMI group being smokers (ANOVA P=0.014). There were no significant differences between normals and diseased groups in plasma cholesterol, triglyceride, VLDL cholesterol, LDL cholesterol and apo AI (Table 2). HDL cholesterol was lower in the diseased groups when compared to normal (P=0.031) and both CAD and PMI groups were significantly different from con-trol (PB0.01). Analysis by ANOVA highlighted a sig-nificantly higher (P=0.042) apo B in the diseased groups and this was due to the CAD group which gave a significance ofPB0.01 when compared to the normal group. The lipoprotein values were intermediate in the PMI group with higher levels in the CAD group except for HDLc which was lowest in CAD.
3.2.2. Lp-PLA2 mass and acti6ity
There was a strong positive correlation (r=0.86,
PB0.001) between mass and activity of plasma Lp-PLA2 (Fig. 3A). The same was true in each of the
lipoprotein fractions for PLA2 mass versus activity,
VLDL (r=0.45,PB0.001), LDL (r=0.60,PB0.001) and HDL (r=0.71, PB001). Of the total Lp-PLA2
mass associated with the lipoproteins, 5.8% was found in VLDL, 83.3% in LDL and 10.9% in HDL. Similar findings were observed for PLA2 activity with 7% in
VLDL, 80.4% in LDL and 12.6% in HDL. Recoveries of plasma Lp-PLA2mass, plasma Lp-PLA2activity and
total plasma cholesterol from the lipoproteins fraction-ated by FPLC were all 95%.
Plasma Lp-PLA2 mass was significantly correlated
with cholesterol (r=0.59, PB0.001), triglyceride (r= 0.23, PB0.01). VLDLc (r=0.30, PB0.001), LDLc (r=0.57,PB0.001), HDLc (r= −0.23,PB0.01) and apo B (r=0.45,PB0.001) as shown in Table 3. Like-wise PLA2 mass in LDL was significantly correlated
with cholesterol (r=0.56, PB0.001), LDLc (r=0.58,
PB0.001) and apo B (r=0.39, PB0.001). The linear relationship between Lp-PLA2 mass and LDLc is
illus-trated in Fig. 3B.
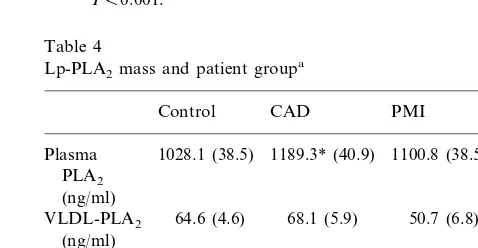
Plasma Lp-PLA2 mass differed significantly between
the groups (ANOVA P=0.009) with highest levels in CAD which differed significantly from control (PB Table 1
BP systolic 128.5 (2.0) 0.553
BP diastolic 83.3 (1.3) 80.5 (2.1) 80.8 (1.5) 0.375
25 42 0.014
Smokers (%) 20
aValues are mean (S.E.M.).
Table 2
Lipids and lipoproteinsa
P
Control CAD PMI
5.61 (0.13)
Cholesterol 5.92 (0.16) 5.46 (0.15) 0.084 (mmol/l)
Triglyceride 1.58 (0.10) 2.18 (0.26) 1.88 (0.15) 0.053 (mmol/l)
0.725 (0.05) 1.00 (0.12) 0.85 (0.06)
VLDLc 0.052
(mmol/l)
3.80 (0.13)
LDLc 3.96 (0.14) 3.65 (0.14) 0.292 (mmol/l)
0.031 1.13 (0.04)
HDLc 0.99* (0.04) 1.00* (0.05) (mmol/l)
aValues are mean (S.E.M.),Pfrom ANOVA. * Significant by Fishers pair wise comparisonPB0.05.
nant PLA2’s which were generated at SmithKline
Beecham Laboratories (data not shown): 14 kDa PLA2
(CHO-derived), 85 kDa PLA2 (baculovirus-derived),
and a recently described related serine-dependent PLA2
(baculovirus-derived). Both the 14 kDa PLA2 and 85
kDa PLA2 are calcium-dependent arachidonic acid
en-Fig. 3. Relationship between Lp-PLA2mass and Lp-PLA2activity (A) or LDL-cholesterol (B) in plasmas from male patients.
0.001) (Table 4). The level of the enzyme in LDL followed the same trend (CAD versus control, PB 0.01) but that in VLDL and HDL did not differ between the groups.
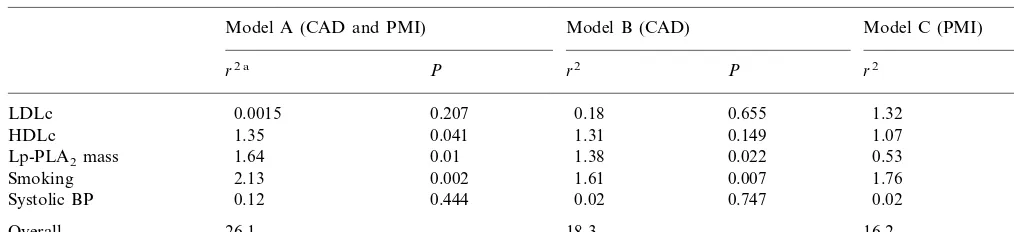
General linear models (GLMs) were used to test for predictors of disease. Controls were compared with all disease subjects (CAD and PMI) in model A, with those with CAD in model B and with those with PMI in model C Table 5. Plasma Lp-PLA2 mass was a
significant predictor of risk in models A and B and showed a trend in model C. Models A and B indicate that Lp-PLA2 was an independent predictor of risk
when the common risk factors, i.e. LDLc, HDLc, smoking and systolic blood pressure, were included in the multivariate models. In a GLM with apo B and Lp-PLA2, the mass of the enzyme was still a significant
predictor of CAD (r2=0.91, P=0.047) but not of PMI status. When HDLc, smoking and systolic BP were added to the model the trend towards higher Lp-PLA2was still evident but was no longer significant.
Apo B, like LDLc, was not a significant predictor in any GLM model when HDLc, smoking and systolic BP were included in the model.
4. Discussion
In view of the known positive correlation between plasma Lp-PLA2 activity and LDLc levels [25 – 27] we
attempted to ensure that the group of male subjects studied were well matched for fasting cholesterol levels (5.5 – 5.9 mmol/l) and LDLc levels (3.7 – 4.0 mmol/l). Thus, we intentionally chose PMI patients who were at least 1 year post event because acute MI is associated with depression of plasma lipoprotein concentrations and plasma Lp-PLA2 activity [28,29]. Cholesterol and
LDLc did not differ significantly between the three groups although plasma triglycerides (1.6 – 2.2 mmol/l) did show a tendency to be higher in the two diseased groups, CAD and PMI. HDLc, however, was signifi-cantly decreased in both patient groups (1.0 versus 1.13
mmol/l, PB0.01) and apo B significantly elevated in the CAD but not the PMI group. Contrary to earlier findings, PMI subjects were closer to normal than were the CAD group. This we attribute to greater interven-tion and lifestyle changes in the year following the MI. The CAD subjects studied were attending a risk factor clinic for the first time and so were likely not to have modified their risk factors.
Several workers have reported [10,30 – 32] that Lp-PLA2 (or PAF-AH) is transported in plasma
predomi-nantly associated with LDL and, in agreement, we
Table 3
Correlations between Lp-PLA2mass and lipoproteins
LDL HDL
Plasma VLDL
PLA2 PLA2 PLA2 PLA2
0.592***
Cholesterol 0.306*** 0.563*** −0.090 0.233** 0.374*** 0.114 0.234** Triglyceride
0.299*** 0.437***
VLDLc 0.174* 0.182*
0.163 −0.256**
0.574***
LDLc 0.584***
−0.131
−0.226** −0.192* 0.084 HDLc
−0.018
−0.003 −0.127 0.135
Apo AI
0.003 0.450*** 0.389***
Apo B 0.266**
*PB0.05. **PB0.01. ***PB0.001.
Table 4
Lp-PLA2mass and patient groupa
P
Control CAD PMI
1028.1 (38.5)
Plasma 1189.3* (40.9) 1100.8 (38.5) 0.009 PLA2
(ng/ml)
0.098 64.6 (4.6)
VLDL-PLA2 68.1 (5.9) 50.7 (6.8) (ng/ml)
817.7 (36.8) 932.5* (38.2) 869.4 (32.1) 0.072 LDL-PLA2
(ng/ml)
104.4 (12.8) 119.5 (10.0) 118.2 (6.0) 0.451 HDL-PLA2
(ng/ml)
Table 5
Predictors of coronary disease using a general linear model
Model B (CAD)
Model A (CAD and PMI) Model C (PMI)
P r2 P
r2 a r2 P
LDLc 0.0015 0.207 0.18 0.655 1.32 0.286
0.041 1.31
HDLc 1.35 0.149 1.07 0.042
0.01 1.38 0.022
1.64 0.53
Lp-PLA2mass 0.081
2.13
Smoking 0.002 1.61 0.007 1.76 0.004
0.444
Systolic BP 0.12 0.02 0.747 0.02 0.765
18.3 16.2
Overall 26.1
ar2is the estimated independent contribution of the variable.
observed that 80% of the PAF-hydrolysing activity within plasma was associated with LDL. Additionally, through the development of a robust and selective immunoassay for Lp-PLA2, we showed for the first
time that the lipoprotein distribution of Lp-PLA2mass
matches exactly that of PAF-AH activity. The strong correlation (r=0.86, PB0.001) between Lp-PLA2
mass and activity in plasma clearly shows that Lp-PLA2 contributes the majority of the PAF-hydrolysing
capability of plasma.
We found a strong correlation between Lp-PLA2
mass and plasma LDLcin agreement with earlier
stud-ies [25 – 27] which had based their observations on enzyme activity measurements. Similarly, we noted a strong correlation between plasma Lp-PLA2 mass and
plasma cholesterol, triglyceride, VLDLc, and apo B (Table 3) in agreement with Guerra et al. [27] who also demonstrated an association between PAF-AH activity and apo B, cholesterol, and triglyceride. The significant negative correlation observed by others [25 – 27] be-tween the PAF-degrading capacity of plasma and HDLc was also corroborated in our Lp-PLA2 mass
measurement studies. We therefore propose that the immunoassay developed offers a simple, sensitive, and reliable method for the detection of Lp-PLA2in plasma
compared to activity measurements.
Our observation that plasma Lp-PLA2 mass levels
were significantly elevated in the CAD group supports and confirms previous reports [18 – 20] suggesting a link between this lipoprotein-bound enzyme and individuals with atherosclerosis. This positive association was made all the more striking since LDL cholesterol levels were not significantly different between normals and CAD. A comparison of risk factors in CAD and normal groups indicated that plasma Lp-PLA2 mass was a
clearer marker of risk on a case control basis than either plasma cholesterol or LDL cholesterol. Even though the enzyme exhibited a strong relationship with LDL this was not the sole cause of the risk association since it was an independent predictor in the linear model. Indeed, plasma Lp-PLA2 was a stronger a
pre-dictor of disease in the CAD group than apo B. Part of
the reason why elevated Lp-PLA2 was such a good
predictor of disease may, as suggested by Guerra et al. [27], be due to it reflecting the presence of LDL parti-cles that are cleared slowly from the circulation. They speculated that the rate of removal of LDL from the circulation would determine the clearance rate of Lp-PLA2and therefore the plasma mass of the enzyme for
any individual. Consistent with this idea has been the observation that Lp-PLA2 is found enriched in the
highly atherogenic small dense LDL [33], a LDL sub-type known to have a prolonged plasma half-life [34]. Moreover, this association would tend to align Lp-PLA2 with a predominantly pro-inflammatory role
since these particles are considered pro-atherogenic be-cause they preferentially seed in the arterial intima and, being older, they are prone to oxidative modification [35].
In summary, the studies strongly support plasma Lp-PLA2 as a potential novel risk factor for CAD
which provides information related to and additional to that obtained from traditional lipid analyses.
Acknowledgements
We wish to acknowledge the technical assistance of M. Stewart, D. Emlyn-Jones, K. Moores, K. Milliner, G. Sully and the clinical assistance of V. Anber, M. Cuchel, M. Devine, L. Forster, I. Hendry, G. Lindsay and M. Towland.
References
[1] Assmann G, Schulte H. Relation of high density lipoprotein cholesterol and triglycerides to incidence of atherosclerotic coro-nary artery disease. Am J Cardiol 1992;70:733 – 7.
[2] Kwiterovich PO. The antiatherogenic role of high density lipo-protein cholesterol. Am J Cardiol 1998;82:13Q – 21Q.
[3] Witztum JL, Steinberg DJ. Role of oxidised low density lipo-protein in atherogenesis. Clin Invest 1991;88:1785 – 92. [4] Berliner JA, Heinecke JW. The role of oxidised lipoproteins in
[5] Mackness MI, Arrol S, Durrington PN. Paraoxonase prevents accumulation of lipoperoxides in low density lipoprotein. FEBS Lett 1991;286:152 – 4.
[6] Mackness MI, Mackness B, Durrington PN, Connelly PW, Hegele RA. Paraoxonase: biochemistry, genetics, and relation-ship to plasma lipoproteins. Curr Opin Lipidol 1996;7:69 – 76. [7] Shih DM, Gu L, Xia YR, et al. Nature 1998;394:284 – 7. [8] Goyal J, Wang K, Liu M, Subbaiah PV. Novel function of
lecithin-cholesterol acyltransferase. J Biol Chem 1997;272:16231 – 9.
[9] Berliner J, Leitinger N, Watson A, Huber J, Fogelman A, Navab M. Oxidized lipids in atherogenesis: formation, destruction and action. Thromb Haemost 1997;78:195 – 9.
[10] Stafforini DM, McIntyre TM, Carter ME, Prescott SM. Human plasma platelet-activating factor acetylhydrolase: association with lipoprotein particles and role in the degradation of platelet-activating factor. J Biol Chem 1987;262:4215 – 22.
[11] Steinbrecher UP, Pritchard PH. Hydrolysis of phosphatidyl-choline during LDL oxidation is mediated by platelet activating factor acetylhydrolase. J Lipid Res 1989;30:305 – 15.
[12] Tew DG, Southan C, Rice SQJ, et al. Purification, properties, sequencing and cloning of a lipoprotein associated, serine depen-dent phospholipase which is involved in the oxidative modifica-tion of low density lipoproteins. Arterioscler Thromb Vasc Biol 1996;16:591 – 9.
[13] Macphee CH, Moores K, Boyd H, et al. The lipoprotein-associ-ated phosphilipase A2 generates two bioactive products during the oxidation of low density lipoprotein: Studies using a novel inhibitor. Biochem J 1999;338:479 – 87.
[14] Dennis EA. The growing phospholipase A2superfamily of signal transduction enzymes. TIBS 1997;22:1 – 2.
[15] Stremler KE, Stafforini DM, Prescott SM, McIntyre TM. Hu-man platelet-activating factor acetylhydrolase: oxidatively frag-mented phospholipids as substrates. J Biol Chem 1991;266:11095 – 103.
[16] Macphee CH, Milliner K, Moores K, Tew DG. The involvement of LDL-associated phospholipase A2in atherogenesis. Pharma-col Rev Commun 1996;8:309 – 15.
[17] Tjoelker LW, Wilder C, Eberhardt C, et al. Anti-inflammatory properties of a platelet-activating factor acetylhydrolase. Nature 1995;374:549 – 53.
[18] Ostermann G, Ruhling K, Zabel-Langhennig R, Winkler L, Schlag B, Till U. Plasma from atherosclerotic patients exerts an increased degradation of platelet-activating factor. Thromb Res 1987;47:279 – 85.
[19] Ostermann G, Lang A, Holtz H, Ruhling K, Winkler L, Till U. The degradation of platelet-activating factor in serum and its discriminative value in atherosclerotic patients. Thromb Res 1988;52:529 – 40.
[20] Graham RM, Stephens CJ, Sturm MJ, Taylor RR. Plasma platelet-activating factor degradation in patients with severe coronary artery disease. Clin Sci 1992;82:535 – 41.
[21] Satoh K, Yoshida H, Imaizumi TA, Takamatsu S, Mizuno S. Platelet activating factor acetylhydrolase in plasma lipoproteins from patients with ischemic stroke. Stroke 1992;23:1090 – 2. [22] US Department Health, Education and Welfare. Lipid Research
Clinics Program: Manual of Laboratory Operations Vol. 1: Lipid and Lipoprotein Analysis (publication no. (NIH) 75-628). Bethesda, MD: National Institutes of Health, 1975.
[23] Zola H, editor. Monoclonal Antibodies. A Manual of Tech-niques. Boca Raton, FL: CRC Press, 1987:1987.
[24] Rice S, Southan C, Boyd H, et al. Expression, purification, and characterisation of a human serine dependent phospholipase with high specificity for oxidised phospholipids and platelet activating factor. Biochem J 1998;330:1309 – 15.
[25] Ostermann G, Kertscher HP, Winkler L, Schlag B, Ruhling K, Till U. The role of lipoproteins in the degradation of platelet-ac-tivating factor. Thromb Res 1986;44:303 – 14.
[26] Carter E, Wu L, Stafforini DM, et al. Platelet-activating factor acetylhydrolase correlates with plasma lipoproteins. Arterioscle-rosis 1988;8:712a.
[27] Guerra R, Zhao B, Mooser V, Stafforini D, Johnston JM, Cohen JC. Determinants of plasma platelet-activating factor acetylhydrolase: heritability and relationship to plasma lipo-proteins. J Lipid Res 1997;38:2281 – 8.
[28] Mainard F, Ozanne P, Madec Y. Variations in lipoproteins, hormones and blood glucose during the early acute phase of myocardial infarction. Atherosclerosis 1988;69:225 – 31. [29] Stephens CJ, Graham RM, Sturm MJ, Richardson M, Taylor
RR. Variation in plasma platelet-activating factor degradation and serum lipids after acute myocardial infarction. Coron Heart Dis 1993;4:187 – 93.
[30] Pritchard PH, Chonn A, Yeung CCH. The degradation of platelet-activating factor in the plasma of a patient with familial high density lipoprotein deficiency (Tangier disease). Blood 1985;66:1476 – 8.
[31] Satoh K, Imaizumi T, Kawamura Y, Yoshida H, Takamatsu S, Takamatsu M. Increased activity of platelet-activating factor acetylhydrolase in plasma low density lipoprotein from patients with essential hypertension. Prostaglandins 1989;37:673 – 82. [32] Surya II, Mommersteeg M, Erkelens DW, Akkerman J-WN.
PAF-acetylhydrolase, predominantly present in LDL in healthy subjects, is associated with HDL in a patient with LDL defi-ciency. J Lipid Med 1991;3:27 – 38.
[33] Karabina SP, Liapikos TA, Grekas G, Goudevenos J, Tselepis AD. Distribution of PAF acetylhydrolase activity in human plasma low-density lipoprotein subfractions. Biochim Biophys Acta 1994;1213:34 – 8.
[34] Packard CJ, Shepherd J. Lipoprotein heterogeneity and apolipo-protein B metabolism. Arterioscler Thromb Vasc Biol 1997;17:3542 – 56.
[35] Chapman MJ, Guerin M, Bruckert E. Atherogenic, dense low density lipoproteins: pathophysiology and new therapeutic ap-proaches. Eur Heart J 1998;19(Suppl. A):A24 – 30.
.